⇦ Back to Livestock and Feedstuff Management Home
¶ Introduction
“Prussic acid” or HCN is a compound found in certain forages which is potentially toxic to livestock, especially when grazing. Toxicity potential can be affected by forage type, growth stage, harvest method, feedstuff intake rate, animal type, animal age, animal condition, and other factors. Other Crop Files in this series discuss these factors in more detail.
The charts in this Crop File illustrate the result of a survey of forages that were analyzed by ServiTech Laboratories. The data covers a ten-year time span and a wide range of geography, field conditions, and sampling dates. These survey results are intended to provide general guidance. They should be used to compare the relative differences between the various feedstuffs shown in the tables. Results of an individual sample may differ from those shown in the table because of the individual circumstances.
¶ Feedstuff Identification
The charts show the relative prussic acid concentrations of various feedstuffs as either fresh forage (green and growing plants that may be harvested by grazing), hay, or silage. Some forages are absent because there were not enough analytical results to be significantly valid.
The customer usually identifies the type of forage when submitting samples. In some cases, the feedstuff type was not specified, so is logged in simply as “hay” or “silage”.
¶ Rating Toxicity Potential
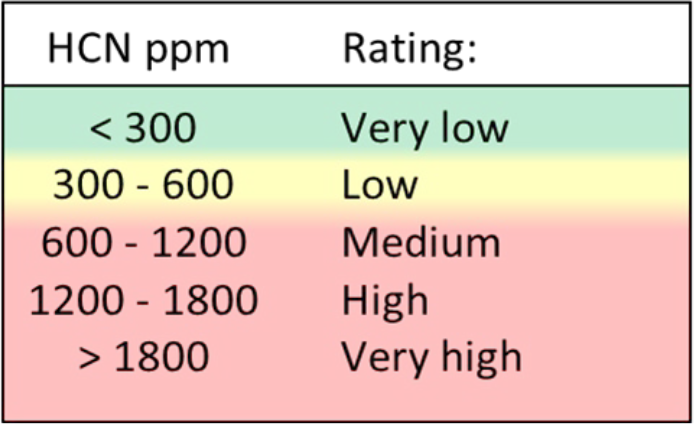
The charts use a colored background for a quick comparison of potential toxicity hazard. The greenshaded range (less than 300 ppm HCN) is considered to be safe for all classes of livestock. The yellow-shaded range (300 to 600 ppm HCN) suggests caution and that changes in feeding management may be needed. The red-shaded range (greater than 600 ppm NO3-N) suggests that changes in feeding management is important to avoid toxicity problems. The level of management increases with increasing prussic acid concentration.
¶ Box-and-whisker plots
The prussic acid concentrations are expressed as “HCN ppm” (i.e., hydrogen cyanide) on a dry matter basis. The survey results are charted using “box-and-whisker” plots.
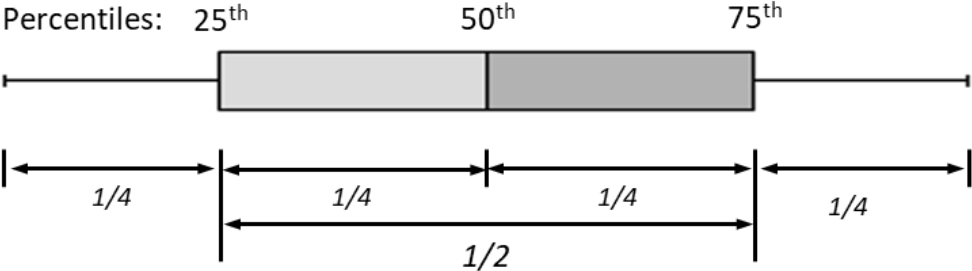
The plots illustrate the survey data for each feed type by using percentiles, which essentially divide the data into quarters.
The 50th percentile of the survey data is represented by the bar in the middle of the box. This identifies the “middle” value of the survey data for that forage. Thus, half of the sample results s in the survey were less than this concentration and half of the sample results were greater than this concentration.
The left-hand and right-hand ends of the box represent the 25th and 75th percentiles, respectively. This range represents the “middle half” of the survey data. Onefourth of the survey results fell between the 25th and 50th percentiles. One-fourth of the results fell in the range between the 50th and 75th percentiles.
The left-hand whisker represents the range of sample results that were below the concentration of the 25th percentile. This can be thought of as the “bottom” onefourth (or quarter) of the data results.
The right-hand whisker represents the range of samples with concentrations greater than the 75th percentile. This is “top” one-fourth or “top quarter” of the survey results.
¶ Figure 1. General Hazard Ratings for Prussic Acid in Forages (Dry Matter Basis)
¶ Figure 2. Box-And-Whisker Plot Interpretation
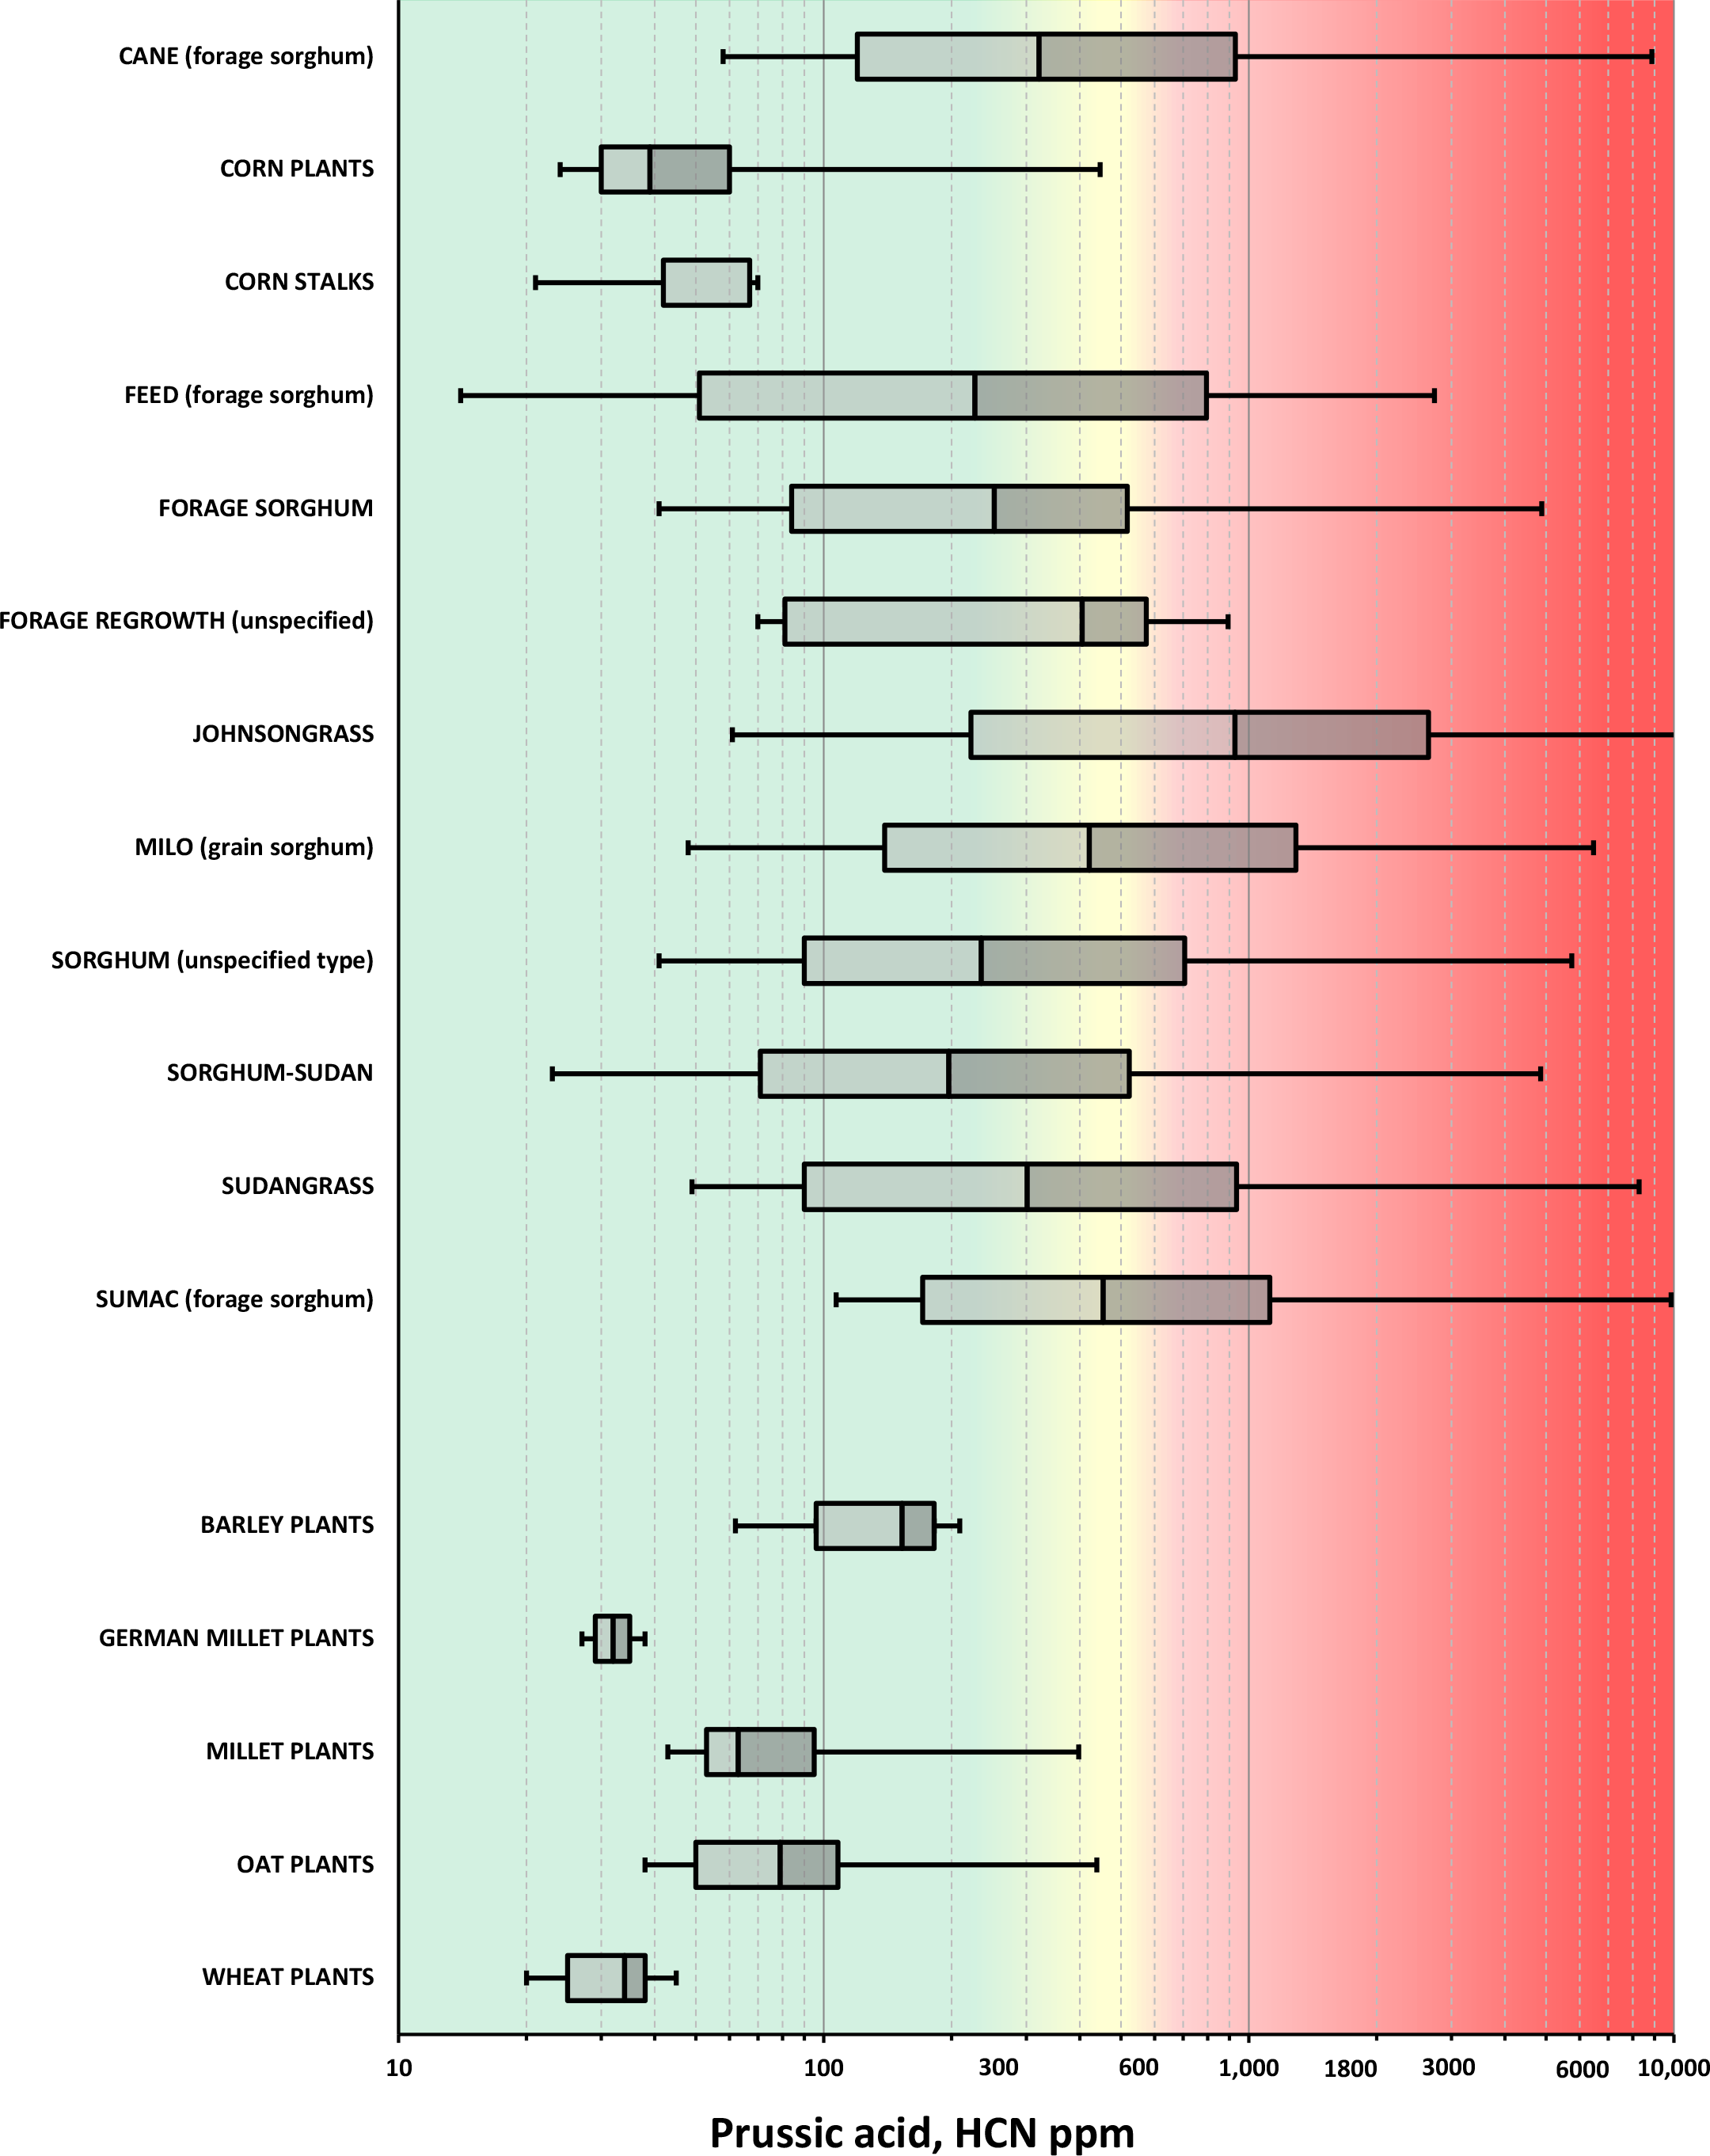
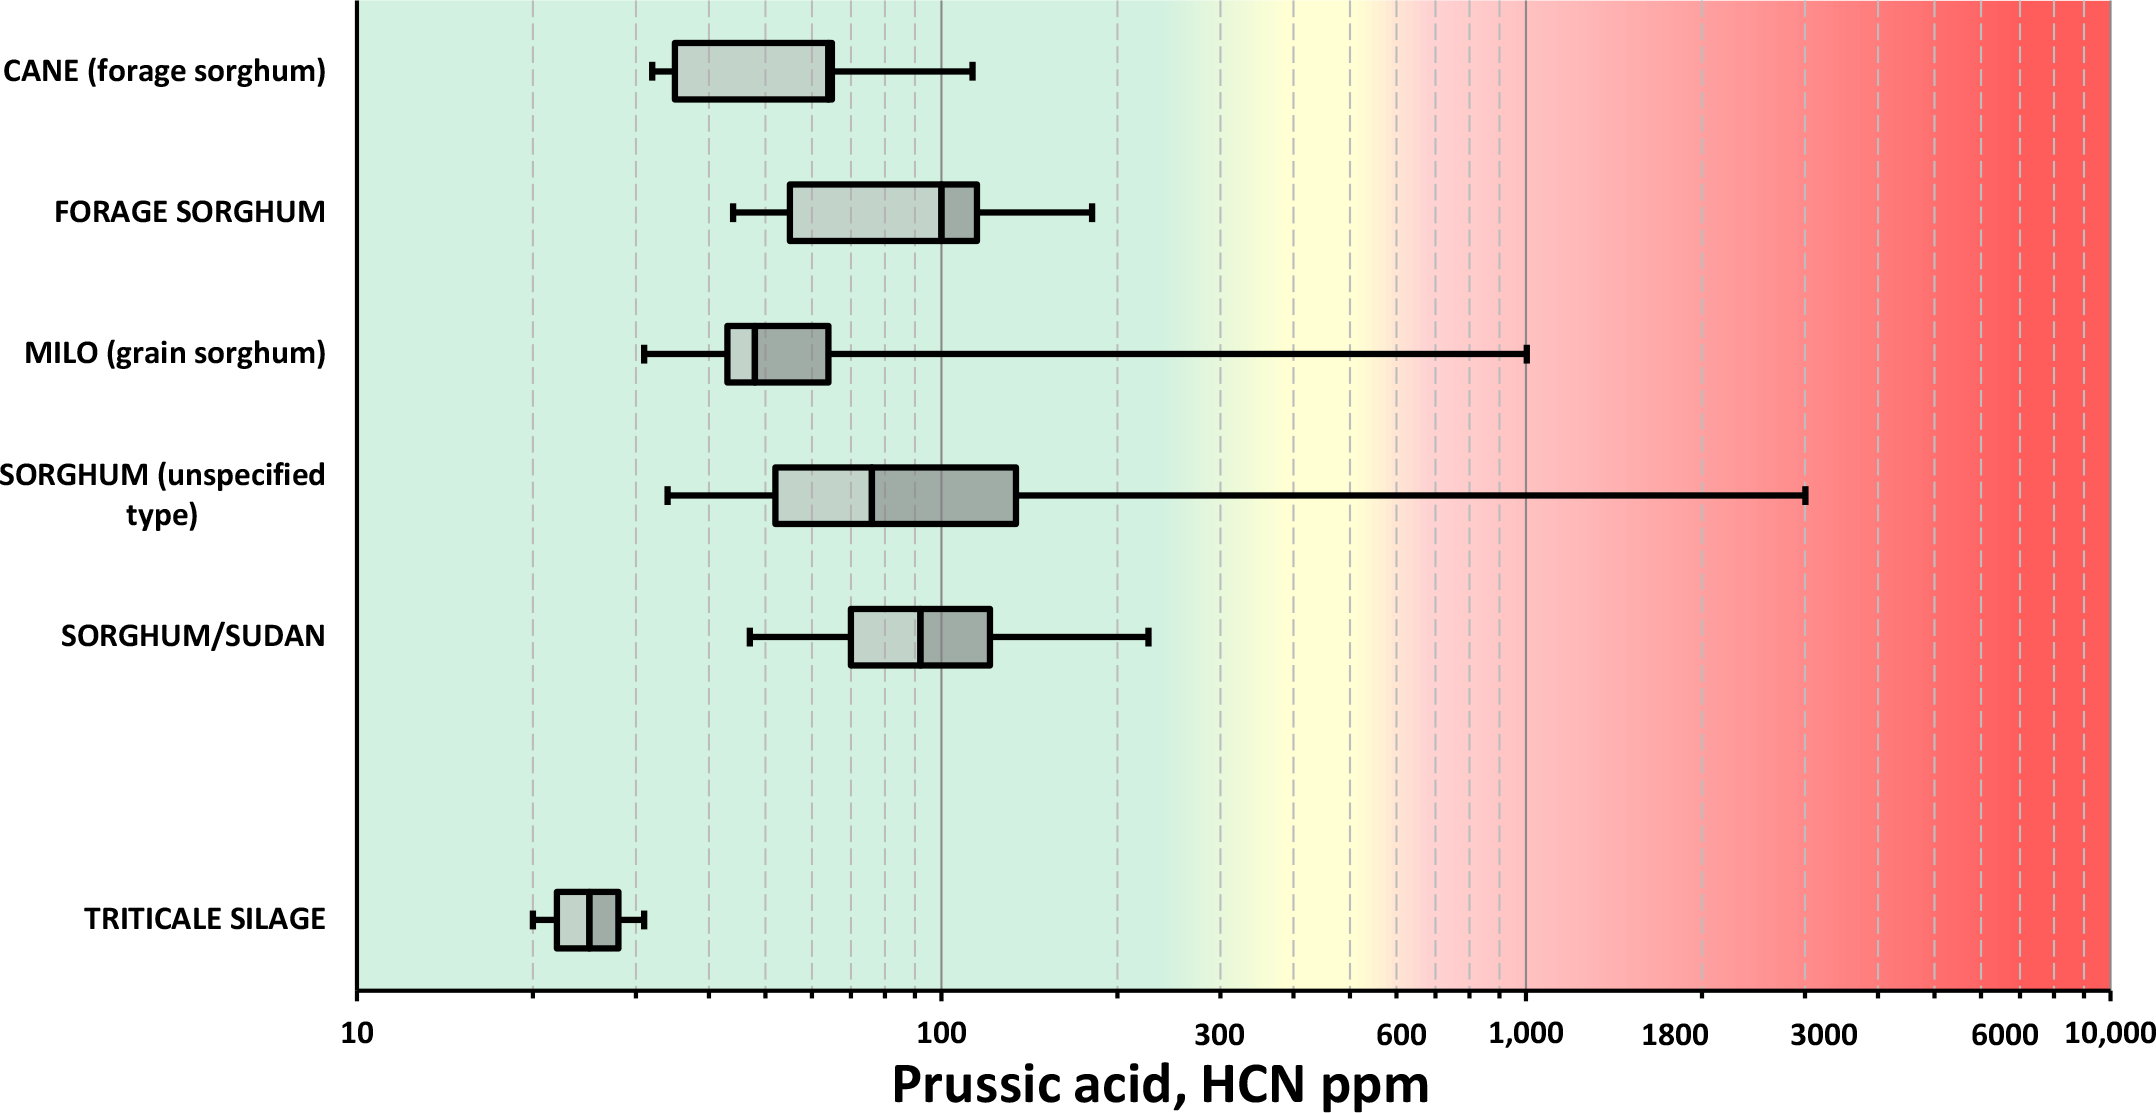
¶ Figure 3. FRESH FORAGES: Sorghums, Corn, Small Grains*
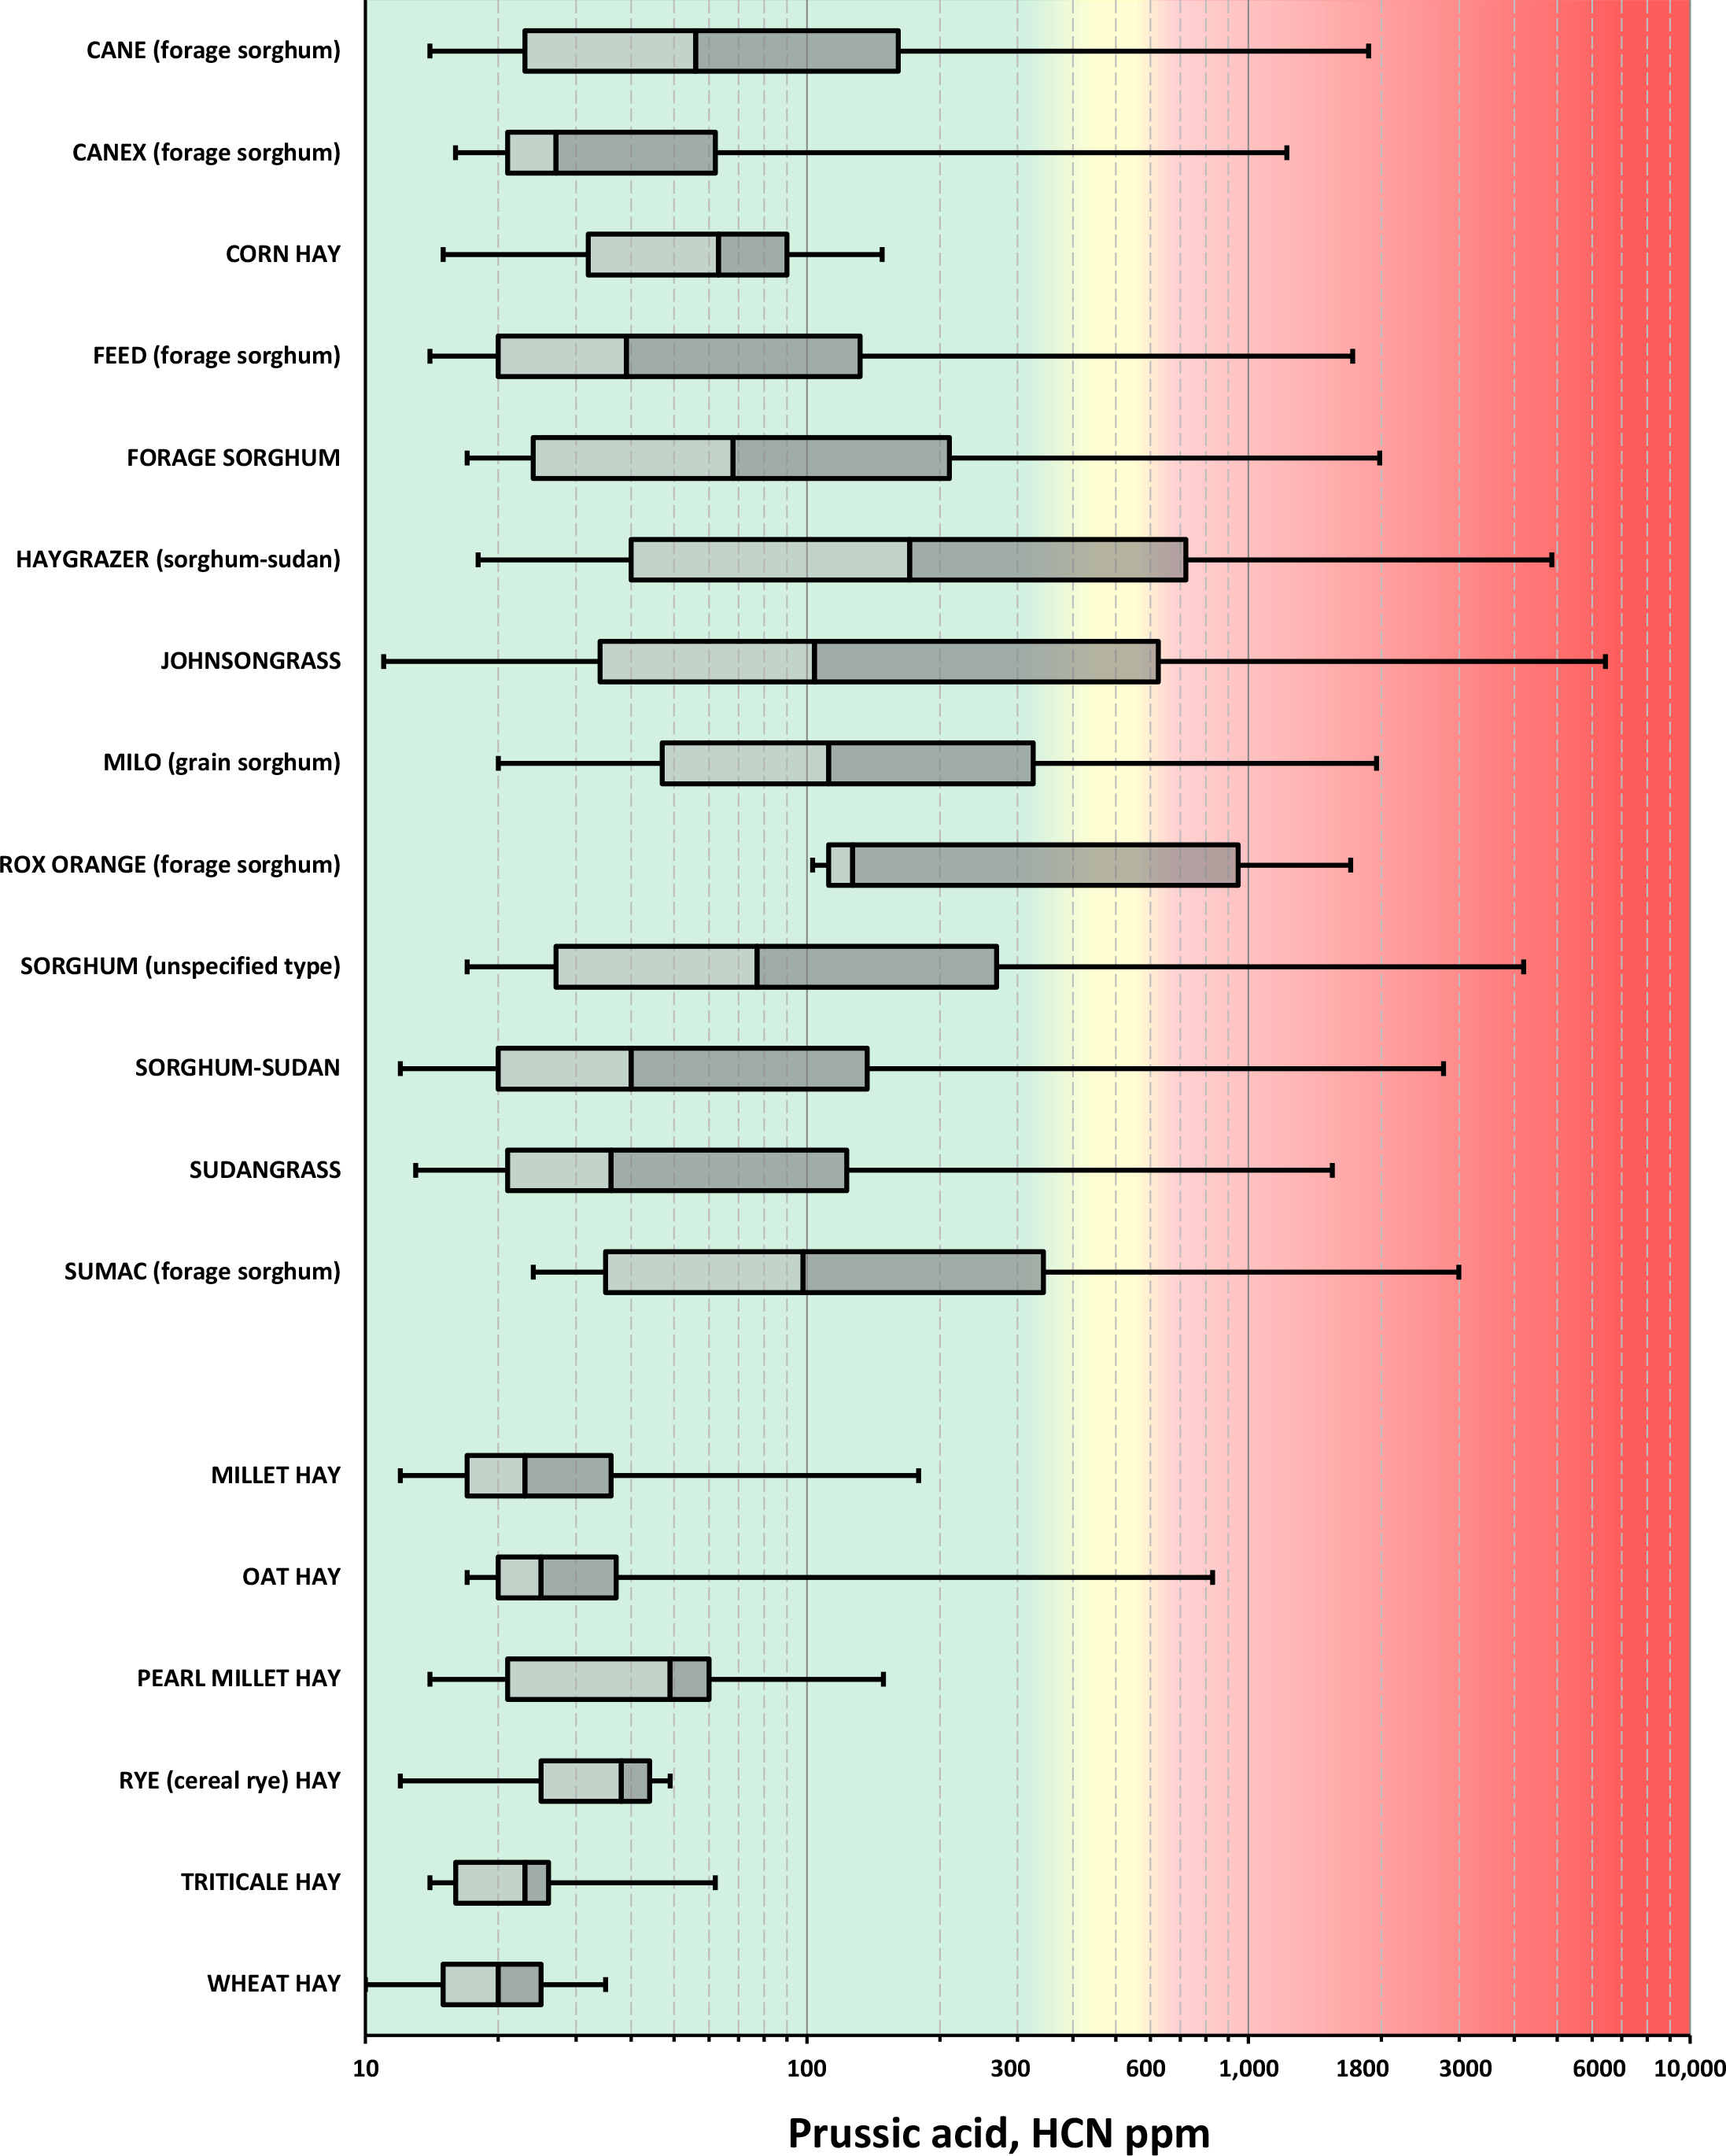
¶ Figure 4. HAYS: Sorghums, Corn, Small Grains*
¶ Figure 5. SILAGES: Sorghums, Corn, Small Grains
¶ Figure 6. FIELD RESIDUES: Sorghums, Corn, Small Grains
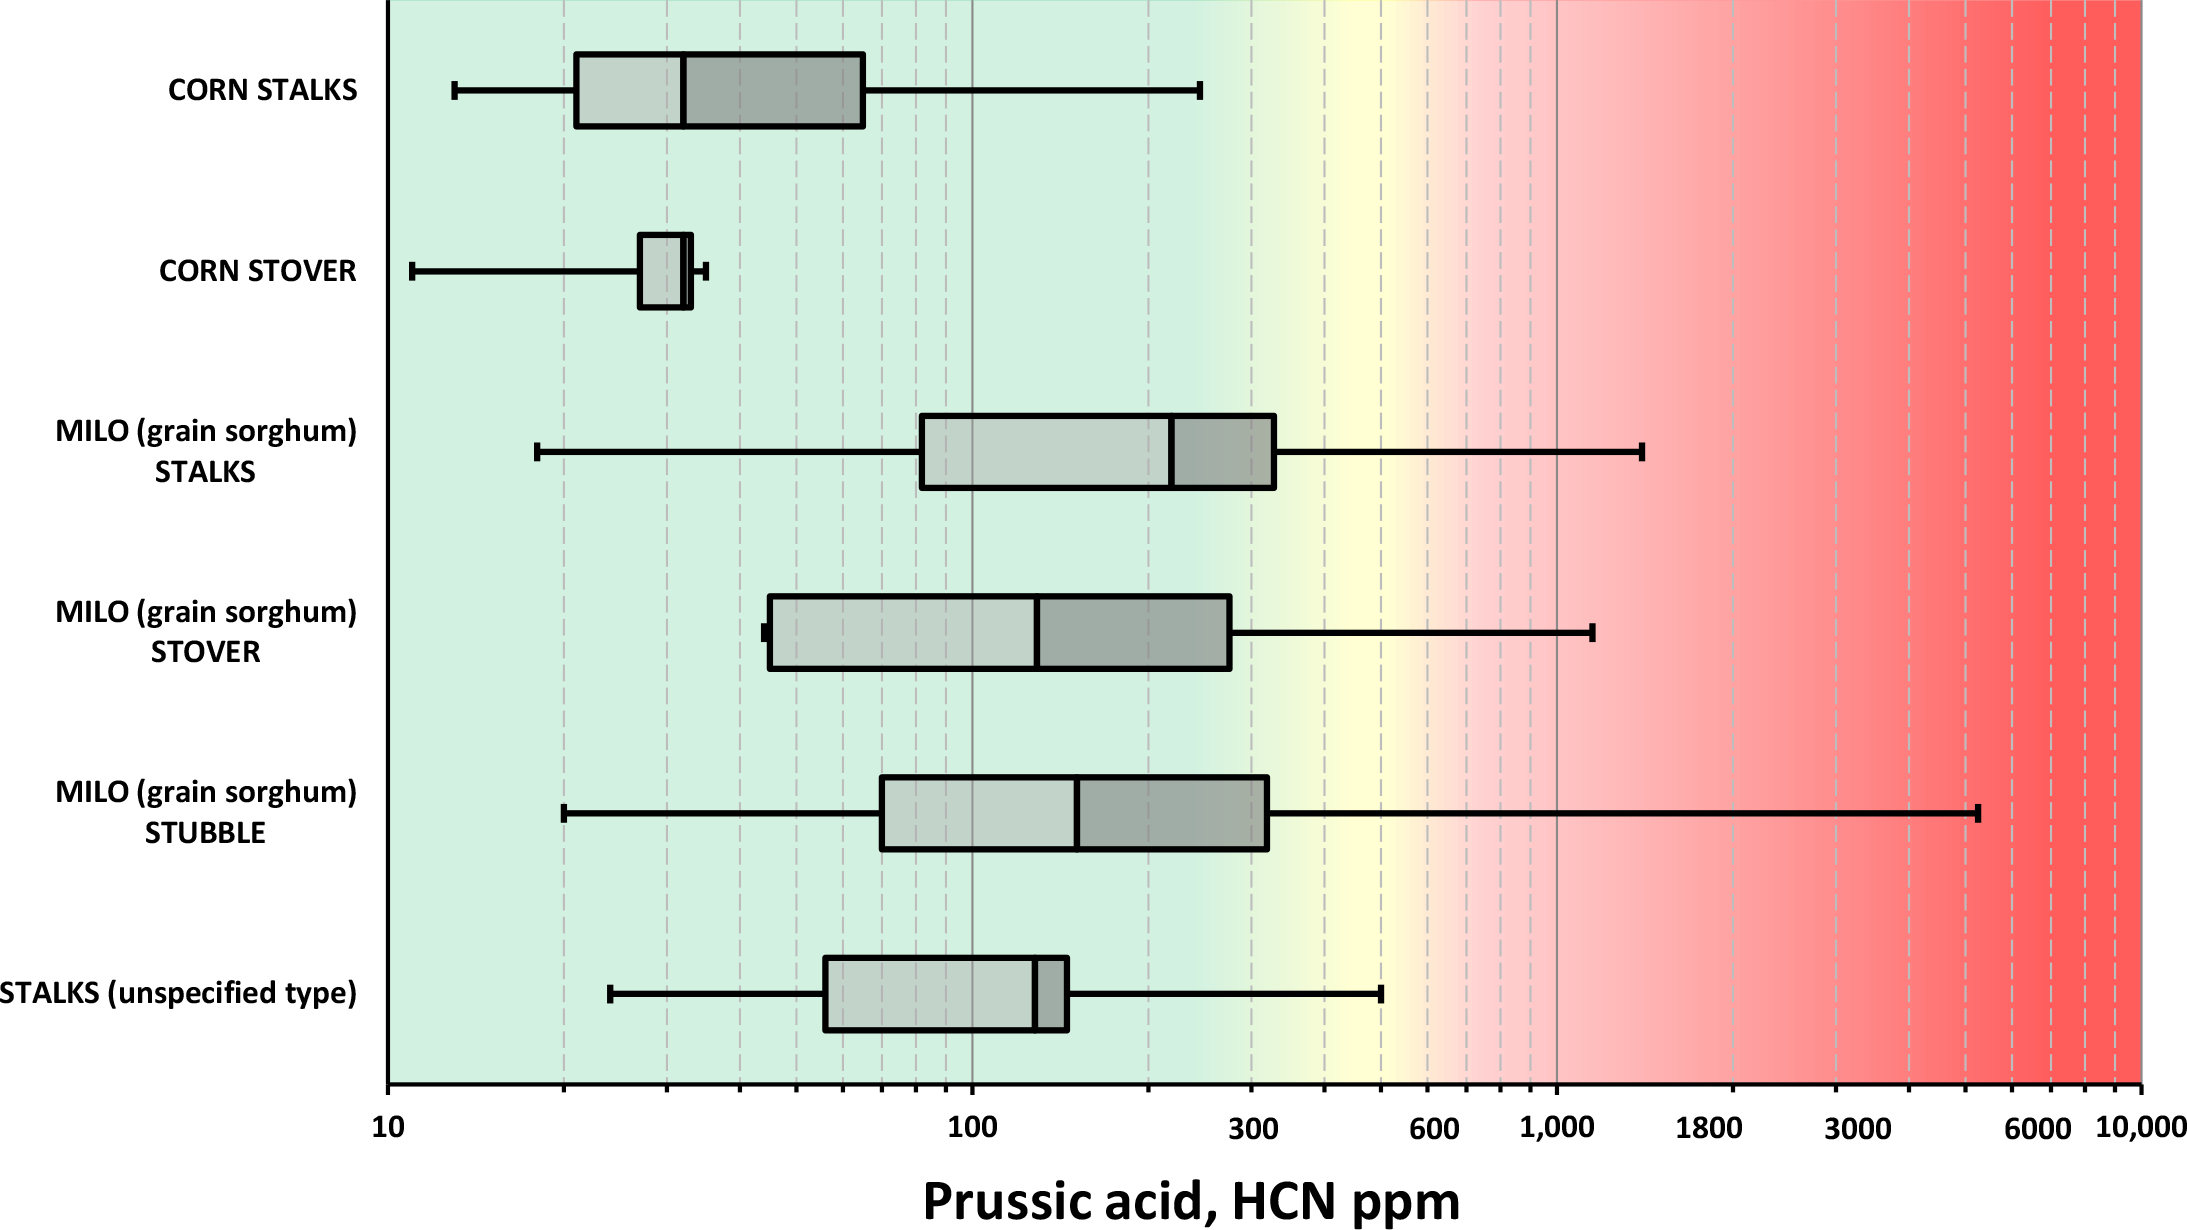
*Uses data from ten-year survey of ServiTech Laboratory feed analysis results)