⇦ Back to Livestock and Feedstuff Management Home
¶ Introduction
Nitrate toxicity is a potential problem in many forages under certain conditions. Toxicity potential is affected by many factors, including forage type, growth stage, harvest method, feedstuff intake rate, animal type, animal age, animal condition, and others. Other Crop Files in this series discuss these factors in more detail.
This Crop File illustrates the results obtained from a tenyear survey of forages analyzed by ServiTech Laboratories. The data covers a wide range of geography, field conditions, and sampling dates. These results are intended to be used as a general guide to compare the relative differences between the various feedstuffs shown in the tables. Results of an individual sample may differ from those shown in the table because of the specific conditions at the time the sample was collected.
¶ Feedstuff Types
The charts compare the nitrate concentrations (as NO3-N) of various feedstuffs that were sampled as fresh forage (green and growing plants that may be harvested by grazing), hay, or silage.
The feedstuff type is usually identified by the customer when submitting samples. In some cases, the feedstuff type is not specified, so is logged in simply as generic “hay” or “silage”. Some forages are not included in the charts due to lack of analysis results.
¶ Using Box-and-Whisker Plots
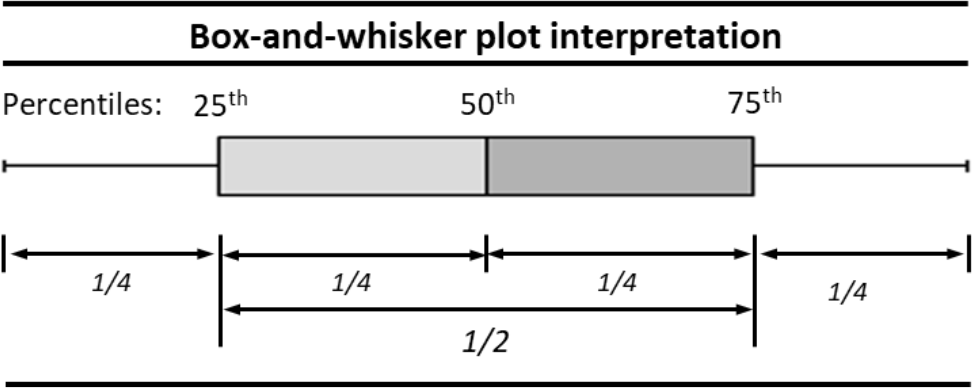
The survey results are charted using “box-and-whisker” plots. The nitrate concentrations are expressed as “nitrate-nitrogen (NO3-N)” on a dry matter basis. The plots illustrate the survey data for each forage type, essentially dividing the data into fourths or quarters using percentiles.
The bar in the middle of the box represents the nitrate concentration at the 50th percentile of the survey results. Thus, the nitrate concentrations of half of the samples in the survey were lower than this concentration and half of the sample results were greater than this concentration.
The left-hand and right-hand ends of the box represent the 25th and 75th percentiles, respectively. Half of the survey results fell within this range of concentration. One-fourth of the survey results were within the range between the 25th and 50th percentiles. One-fourth of the results were within the range between the 50th and 75th percentiles.
The left-hand whisker represents the range of sample results that were less than the nitrate concentration of the 25th percentile. This is the “bottom” quarter (or bottom one-fourth) of the data results.
The right-hand whisker represents the range of samples with concentrations greater than the 75th percentile. This is the “top” quarter of the data results.
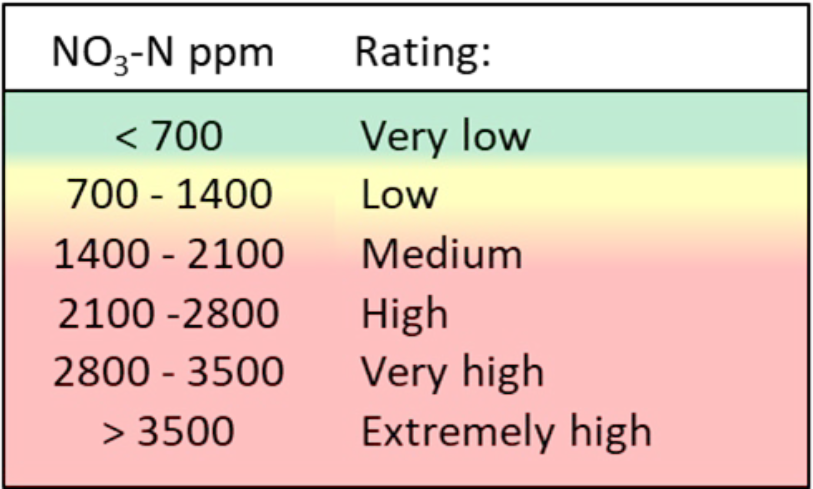
¶ Nitrate Hazard Rating
The charts use a colored background for a quick comparison of potential toxicity hazard. The greenshaded range (less than 700 ppm NO3-N) is considered to be safe for all classes of livestock. The yellow-shaded range (700 to 1400 ppm NO3-N) suggests caution and that changes in feeding management may be needed. The red-shaded range (greater than 1400 ppm NO3-N) suggests that feeding management is important to avoid nitrate toxicity
¶ Figure 1. Box-And-Whisker Plot Interpretation
¶ Figure 2. General Hazard Ratings for Forage Nitrates (Dry Matter Basis)
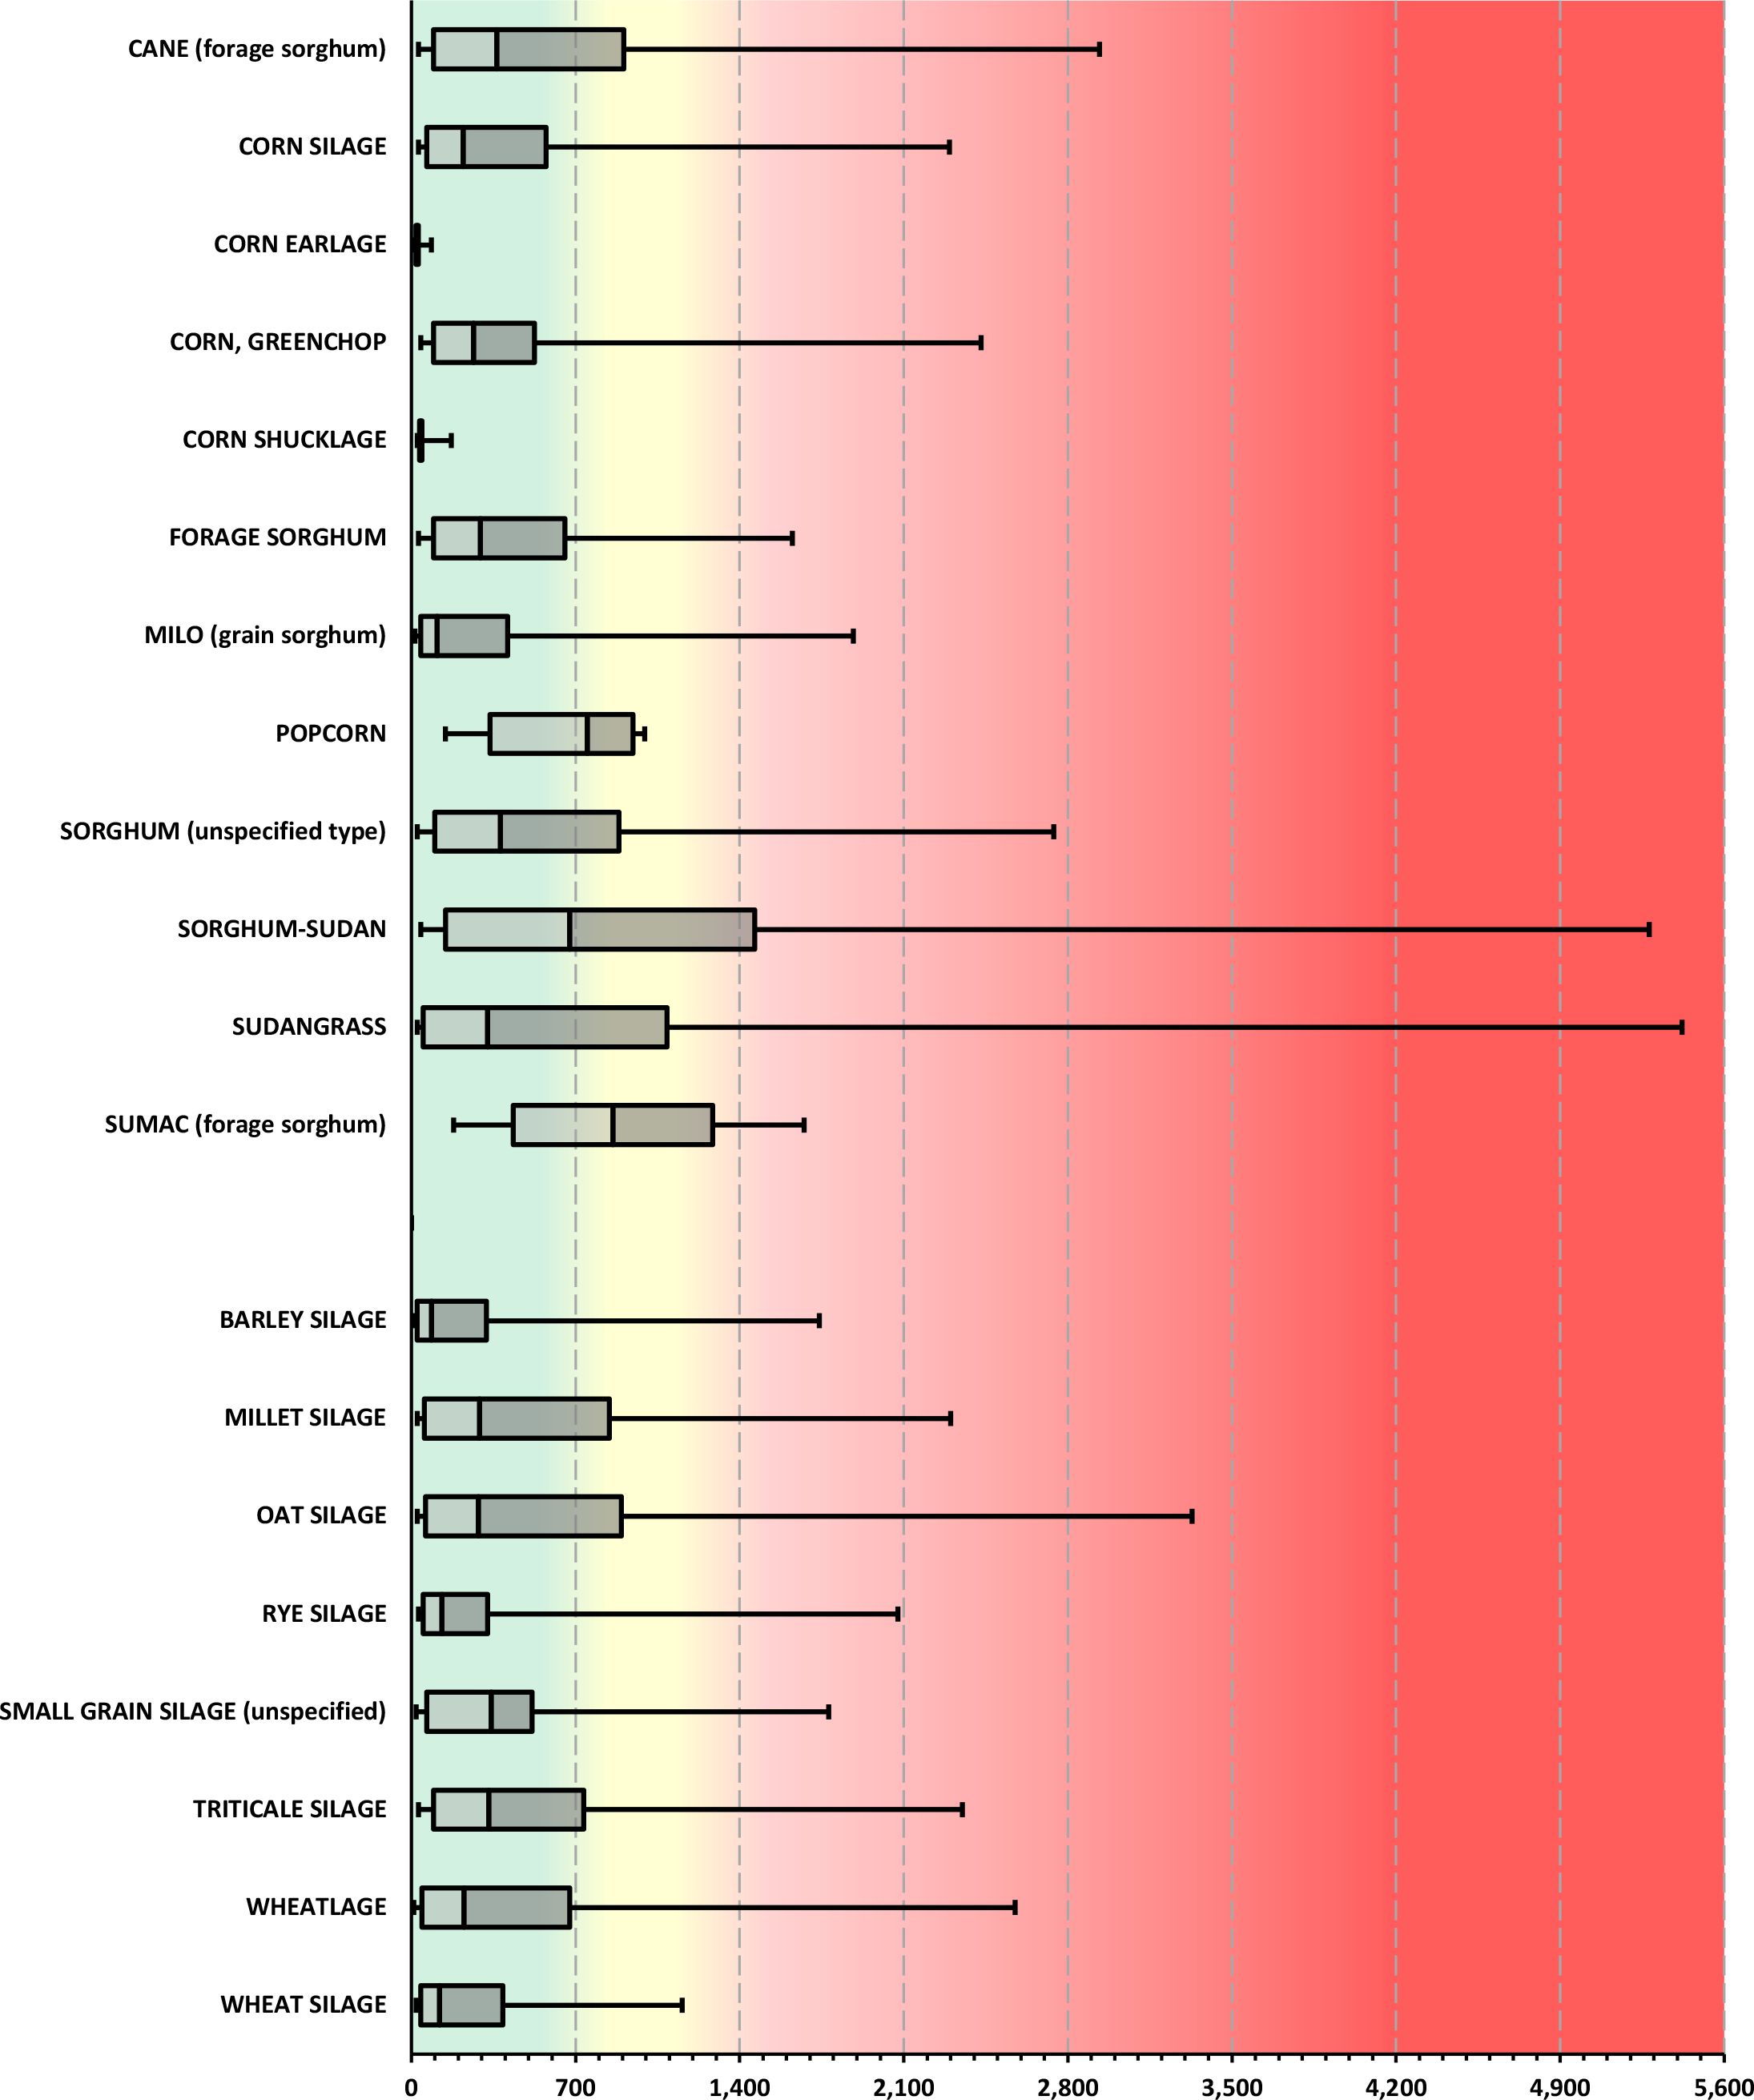
¶ Figure 3a. Forage Nitrate Comparisons (NO3-N ppm)
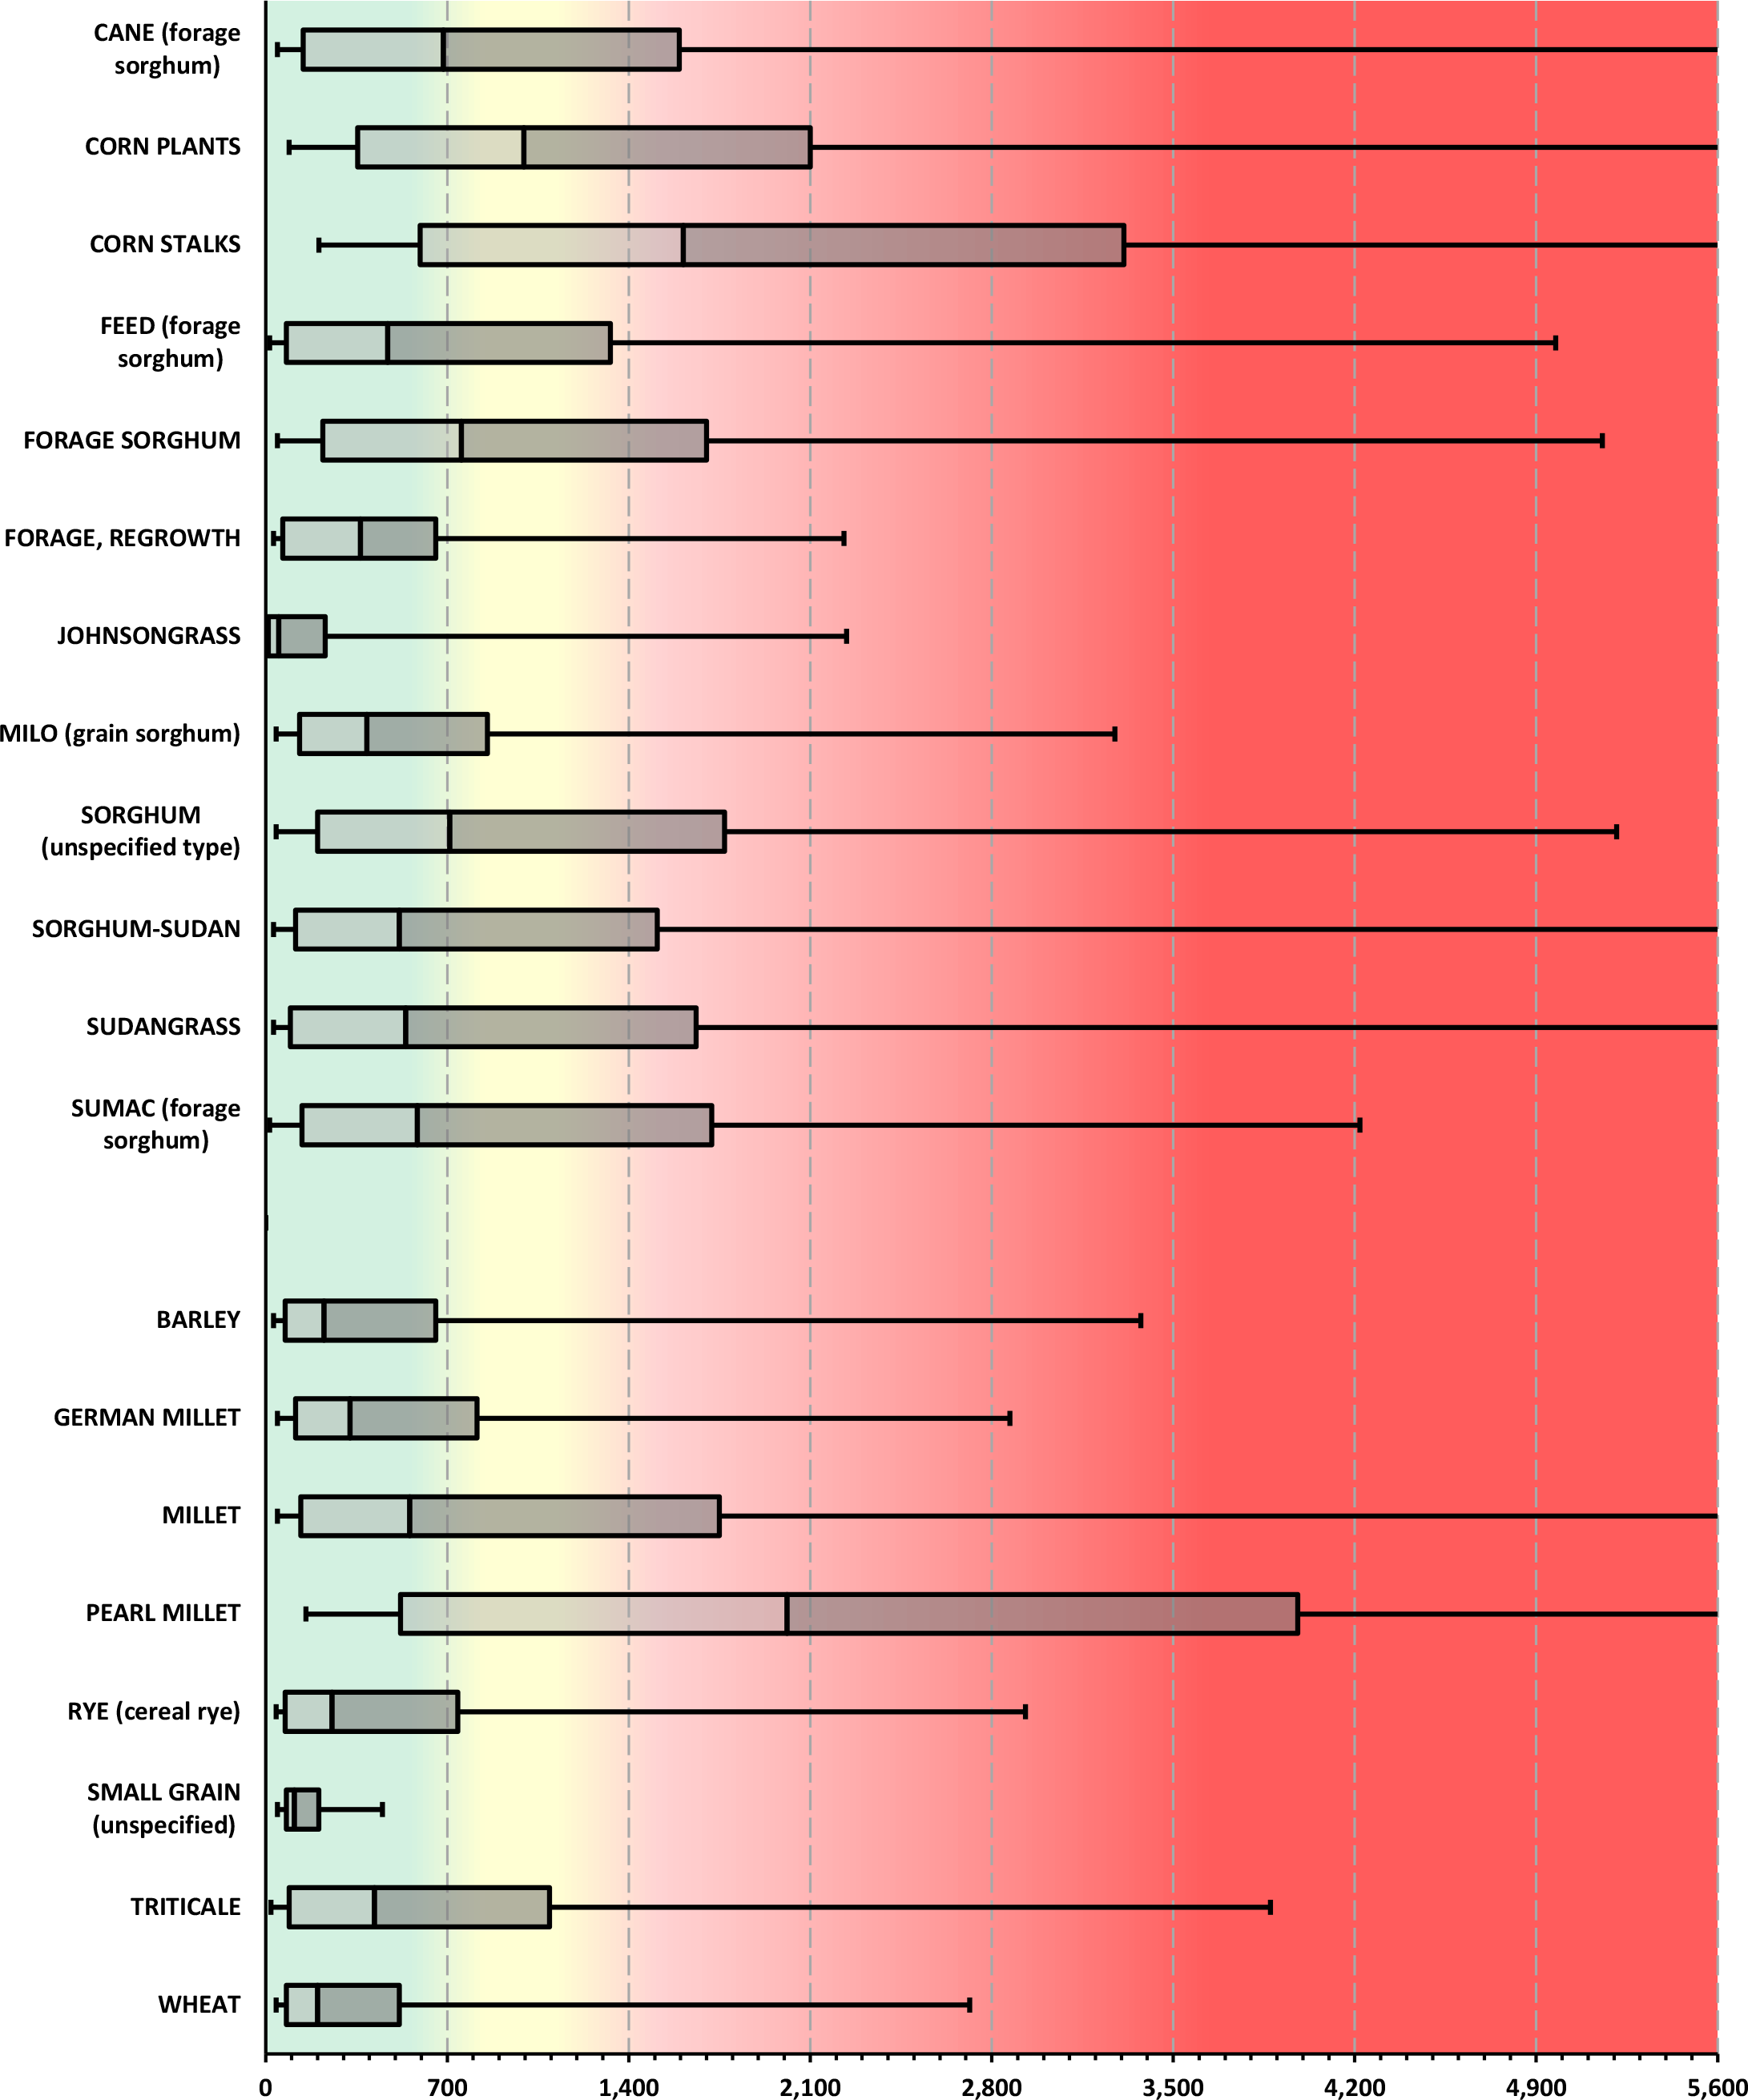
Nitrate-nitrogen, NO3-N ppm
Uses data from ten-year survey of ServiTech Laboratory feed analysis results)
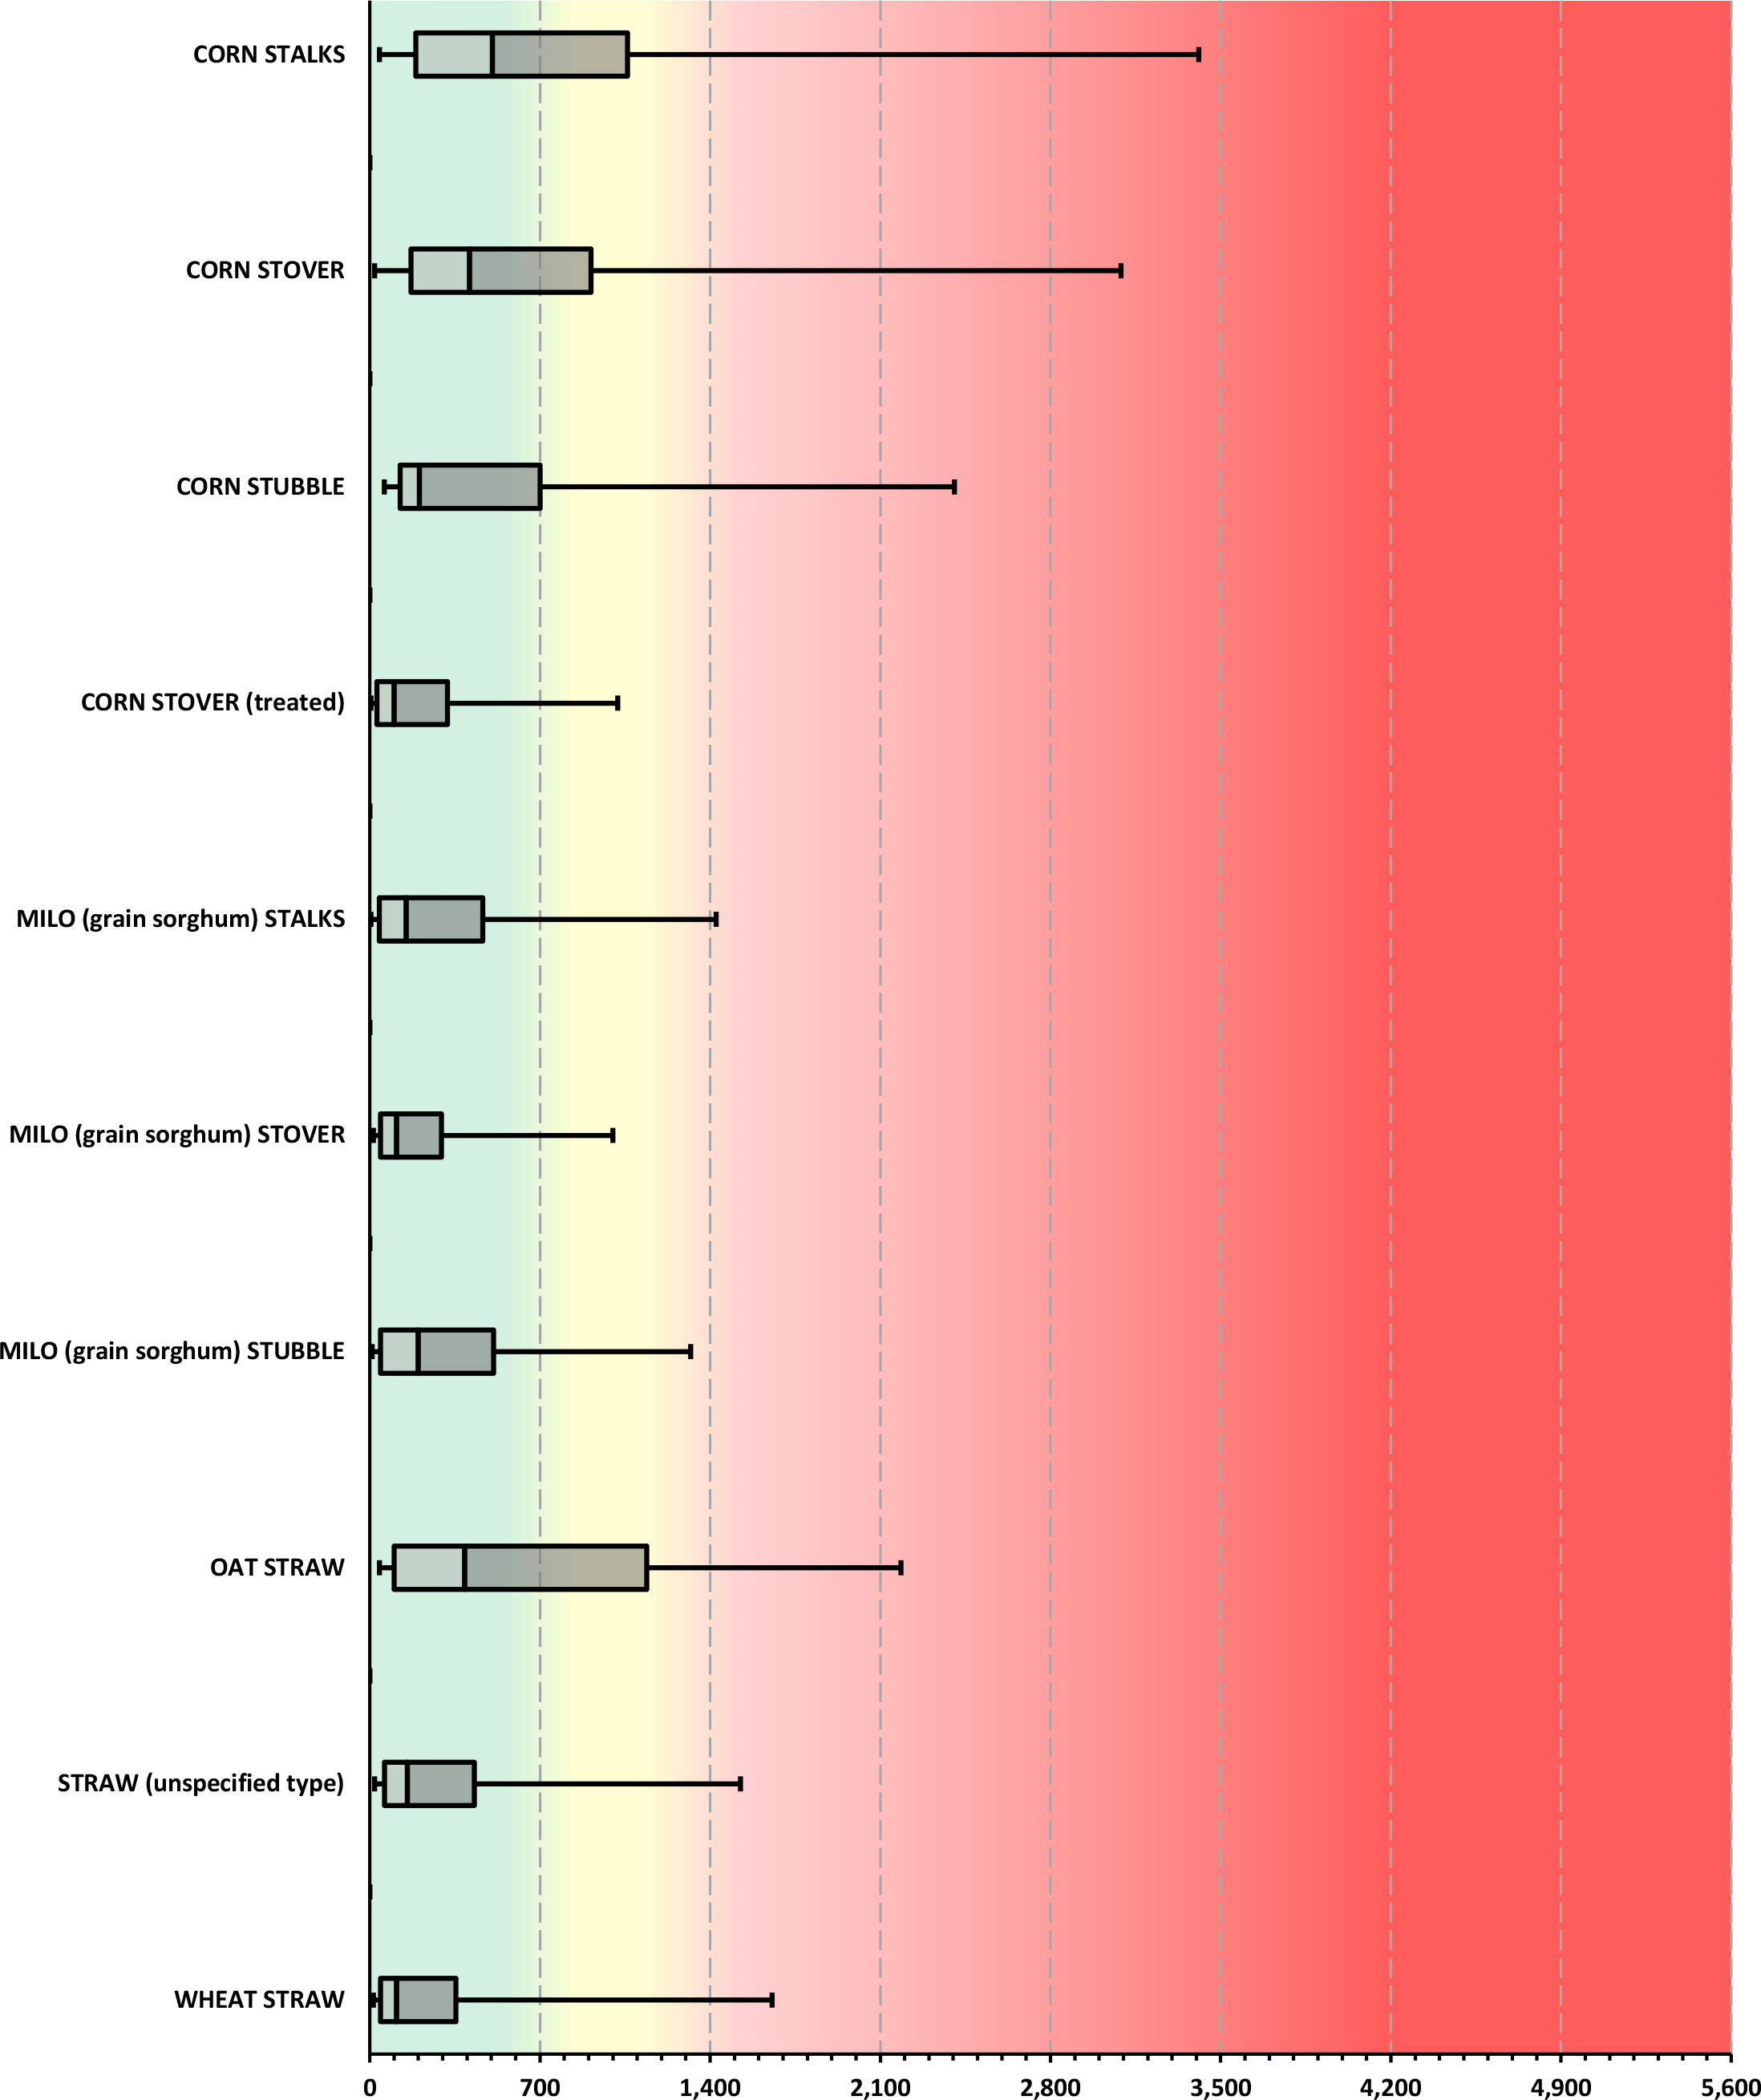
¶ Figure 3b. Forage Nitrate Comparisons (NO3-N ppm)
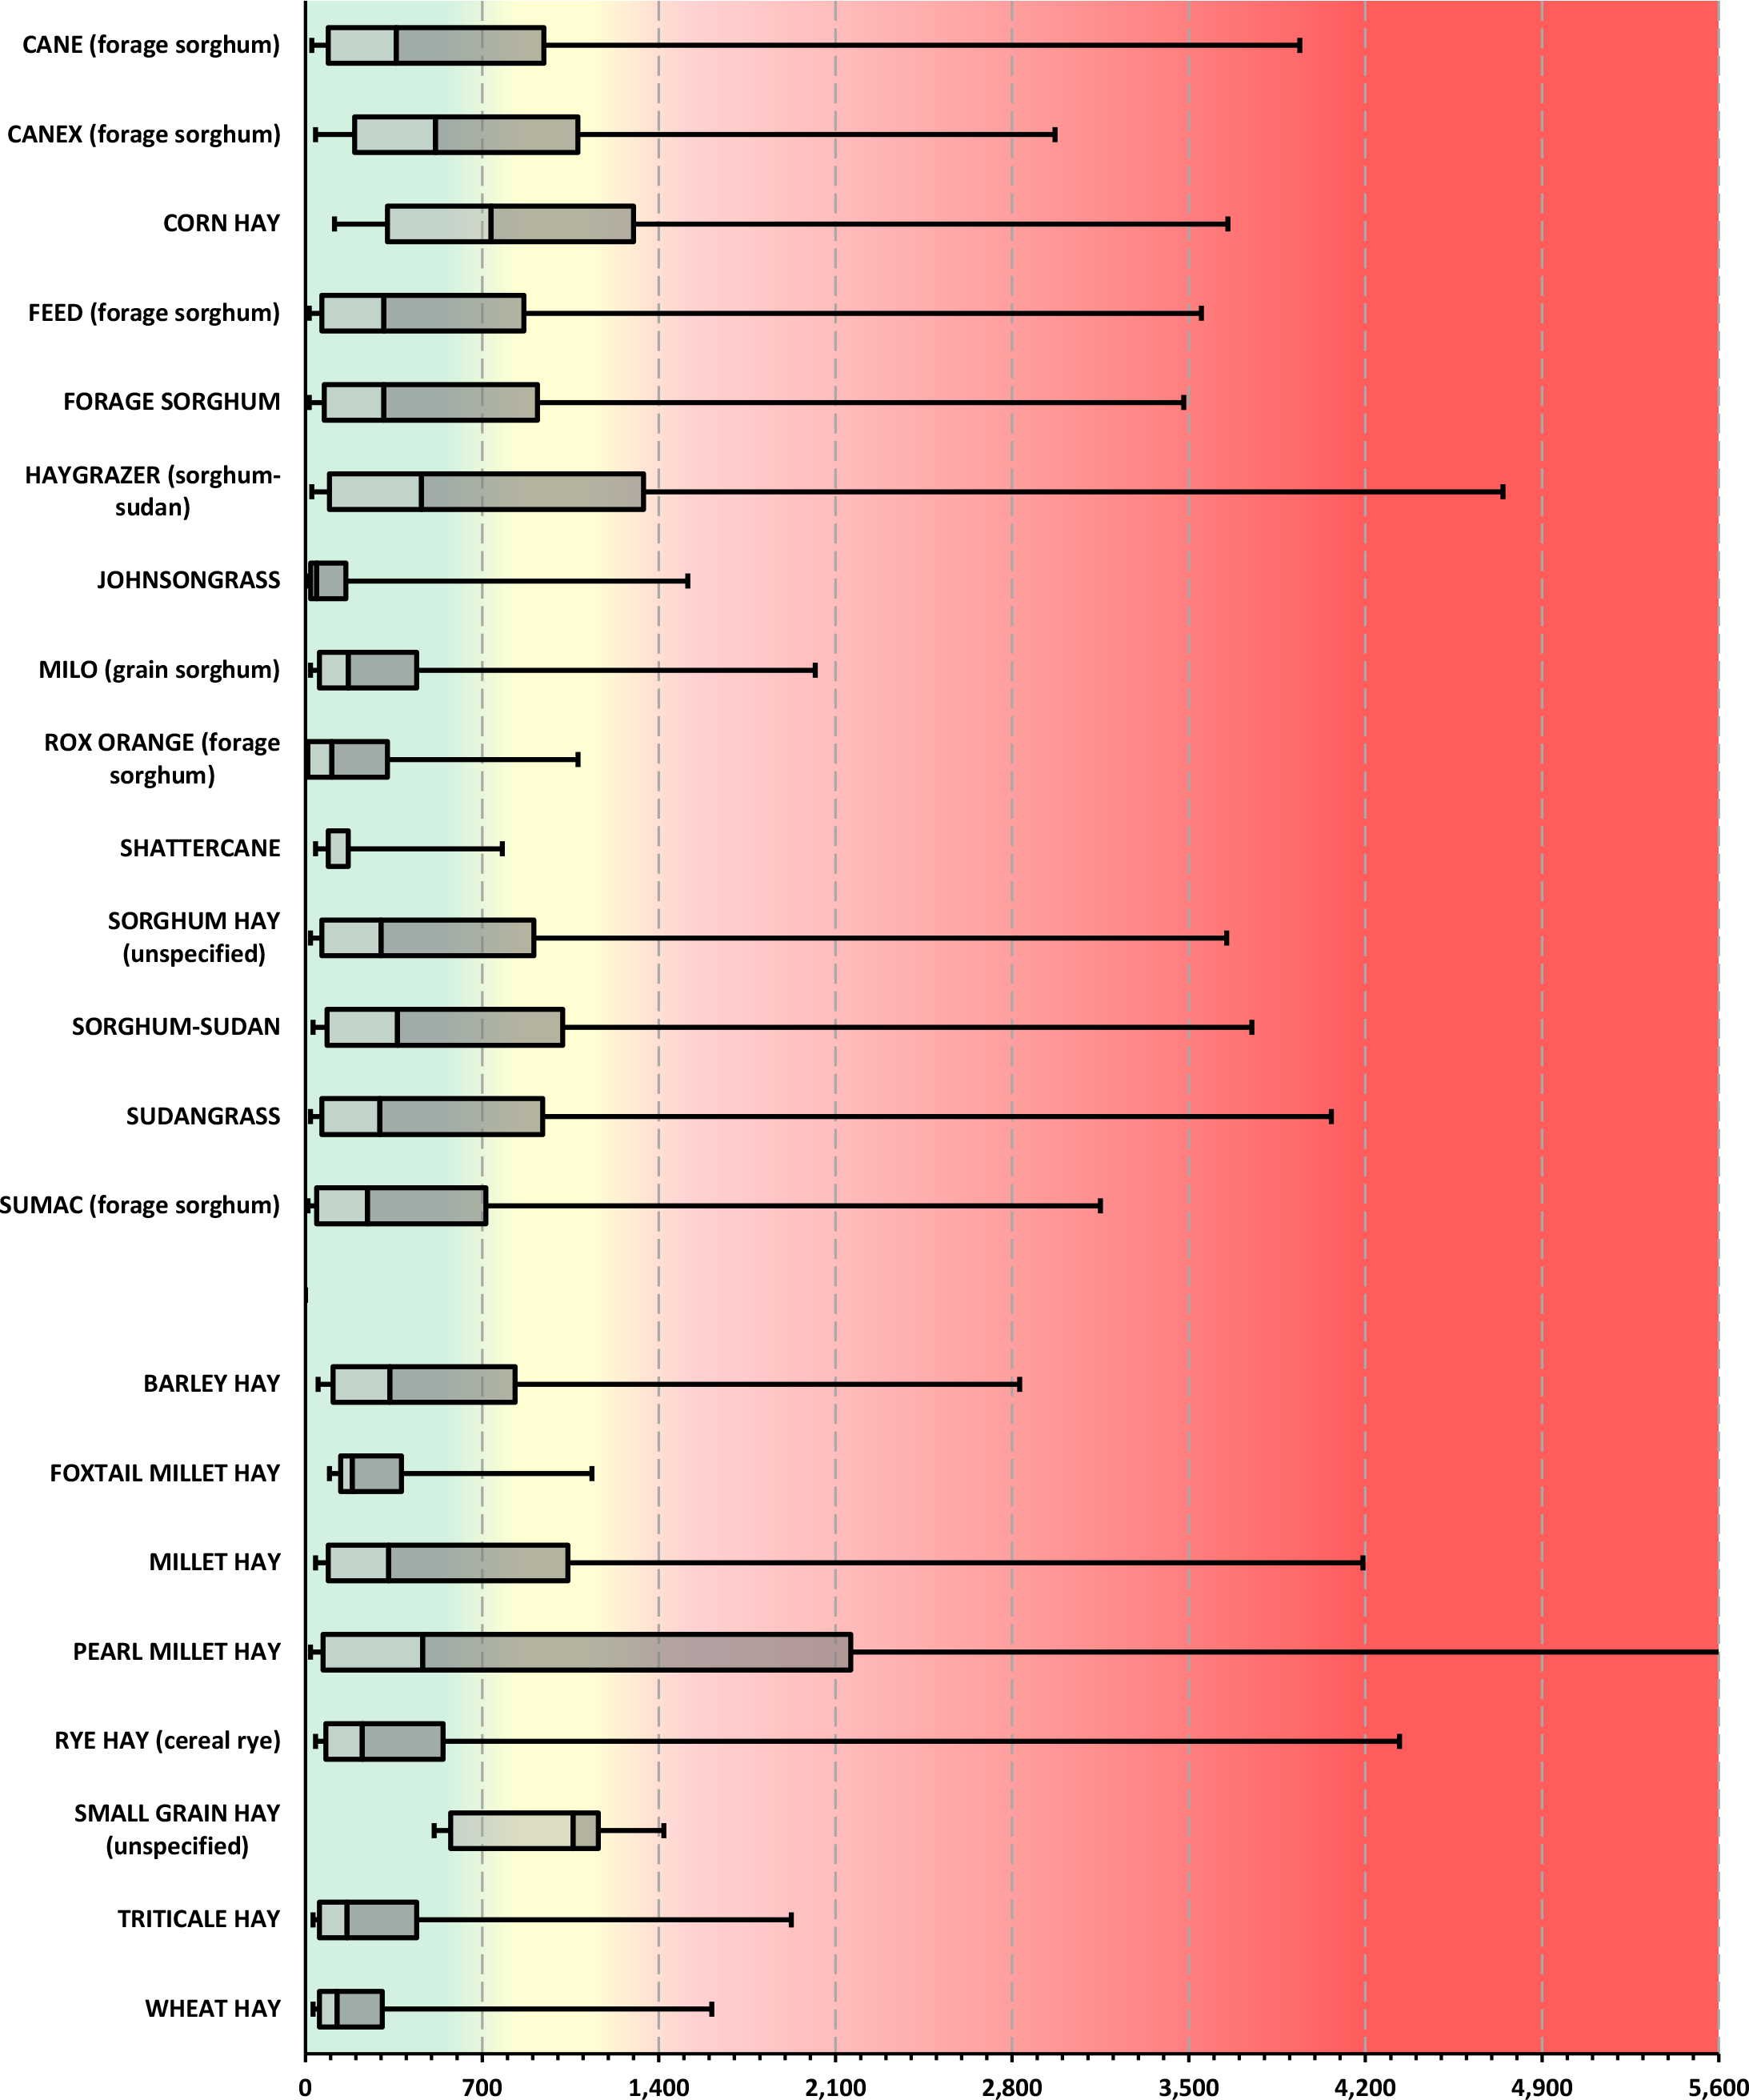
Nitrate-nitrogen, NO3-N ppm
Uses data from ten-year survey of ServiTech Laboratory feed analysis results)
¶ Figure 3c. Forage Nitrate Comparisons (NO3-N ppm)
Nitrate-nitrogen, NO3-N ppm
Uses data from ten-year survey of ServiTech Laboratory feed analysis results)
¶ Figure 3d. Forage Nitrate Comparisons (NO3-N ppm)
Nitrate-nitrogen, NO3-N ppm
Uses data from ten-year survey of ServiTech Laboratory feed analysis results)