⇦ Back to Livestock and Feedstuff Management Home
¶ Introduction
Relative feed value (RFV) is a forage quality index using acid detergent fiber (ADF) and neutral detergent fiber (NDF) to estimate the forage digestibility and the amount of forage a cow can consume based on its bulkiness or “filling” capacity.
Livestock animals can perform differently even when fed forages with identical RFV. These differences are likely due to variations in the digestibility of the NDF fraction.
The fiber fraction digestibility of grasses and legume forages are naturally different and are affected by weather conditions. Growing season temperatures can affect the proportion of lignin, cellulose, and hemicellulose in the harvested forage which then affects digestibility.
For example, the RFV of the first-, second-, and third-cuttings alfalfa could be similar. Since fiber fractions are affected by growing season temperatures, digestibility from each cutting will likely be different. The RFV calculation would not take this into account and livestock may perform differently when fed the same type of forage from different cuttings or harvests.
¶ Relative Forage Quality (RFQ)
The relative forage quality (RFQ) index was developed by Wisconsin researchers. RFV and RFQ both estimate dry matter intake (DMI), but take different approaches. RFQ estimates the total digestible nutrient (TDN) or energy content rather than the digestible dry matter (DDM) content used in the RFV calculation.
RFQ uses NDF digestibility to estimate both dry matter intake and total digestible nutrients. It is a more complicated calculation than RFV, but better reflects the expected livestock performance from the forage. RFQ can also differentiate legume forages from grasses.
¶ RFV vs. RFQ
The RFQ calculation was structured to have the same mean and range as the RFV calculation so that RFQ could be easily substituted for RFV. RFQ values can be applied to all forages (cool-season, warm-season, or tropical), except for corn silage.
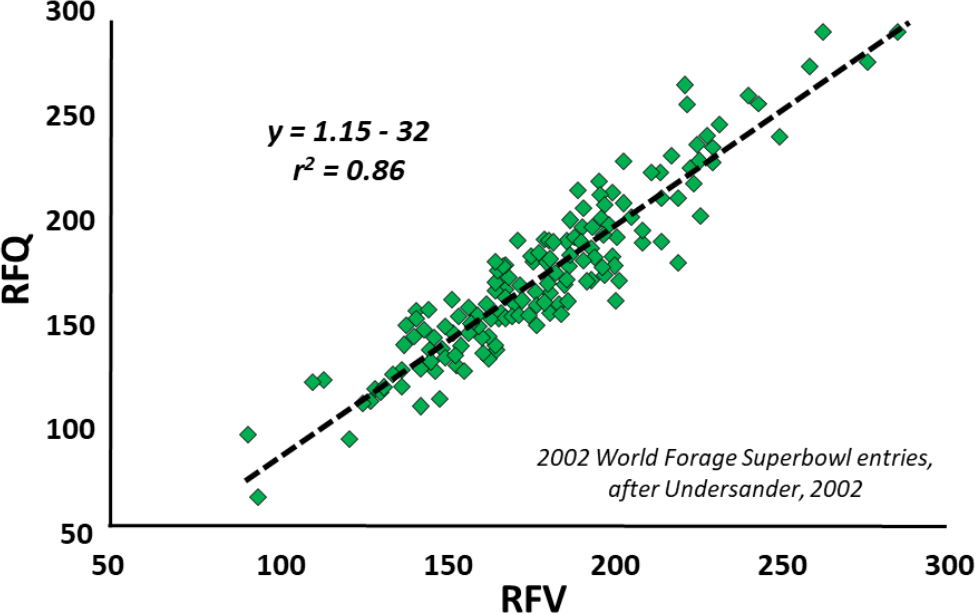
Figure 1 shows the similarity between the two indices using alfalfa entries from the World Forage Superbowl. The average RFV was 179 and the average RFQ was 172. Though similar, the two values are not interchangeable. The RFQ of individual samples varied by as much as 40 points higher or lower than RFV. About one-fifth of the samples varied by 20 points or more.
¶ Figure 1. Comparison of RFV and RFQ for Alfalfa
The RFV and RFQ indices in the range of 75 to 200 are a reasonable approximation of livestock response. Neither index relates well if outside of this range.
RFV and RFQ are essentially the same when alfalfa digestibility is average. RFQ does appear to be a better index whenever fiber digestibility is not average, which occurs 20 to 40% of the time in pure alfalfa.
RFQ is also a better index when grass is present. It can categorize grasses more accurately to better match their forage nutrient content with livestock performance.
The RFV calculation generally penalizes grasses because they have higher fiber fractions (ADF and NDF), but they also have lower lignin content.
The RFQ calculation credits grasses because the higher neutral detergent fiber fraction tends to be more digestible than alfalfa fiber. This means that higher fiber grasses may perform in animal rations as well as lower fiber legumes.
The data example in Table 1 shows the RFV of timothy to be substantially lower than alfalfa, but lignin content is lower and cell wall digestibility is higher. RFQ makes this adjustment for digestibility, while RFV does not. This makes RFQ a much more versatile forage-quality index.
¶ Table 1. Nutrient Composition of Selected Forages |
||||
| Forage type | NDF % | ADF % | Lignin % | Cell wall digestibility* |
| Alfalfa | 49 | 34 | 7 | 46 |
| Corn silage | 51 | 28 | 4 | 68 |
| Timothy | 66 | 34 | 4 | 57 |
| Forage type | RFV | DDM % | DMI% | Crude protein % |
| Alfalfa | 118 | 62.4 | 2.45 | 16 |
| Corn silage | 122 | 67.1 | 2.35 | 10 |
| Timothy | 88 | 62.4 | 1.82 | 10 |
¶ When and How to Use RFQ
RFQ is an estimate of voluntary intake of available energy when a forage is fed as the sole source of energy and protein. It probably reflects forage quality more accurately than other measurements. It should be used for deciding when to harvest, when buying and selling hay based on forage quality, and when contracting for harvest with a quality incentive.
The RFQ index includes fiber digestibility, so is probably more representative of animal performance with a particular forage. It can be used to inventory forage sources and allocate each type to a specific class of livestock (see Table 2). RFQ is generally appropriate for use with all forages, except corn silage, because RFQ does not account for differences in starch availability.
When RFV and RFQ are different, the RFQ value is the better choice for making management decisions. If RFQ is higher than RFV, the forage value is higher than indicated by RFV which is often used to price forages. If RFQ is lower than RFV, animal performance (especially dairy cows) will likely be lower than expected with a ration balanced on ADF alone.
¶ Table 2. Forage Quality Needs of Cattle by RFQ |
|
| Relative Forage Quality Range | Suggested Cattle Type |
| 100-200 | • Heifers, 18 to 24 months • Dry cows |
| 115-130 | • Heifers, 12 to 18 months • Beef cows and calves |
| 125-150 | • Dairy, last 200 days • Heifers, 3 to 12 months • Stocker cattle |
| 140-160 | • Dairy, first 3 months of lactation • Dairy calves |
¶ RFQ Calculations
Relative forage quality is calculated as follows:
RFQ = (DMI, % of BW) x (TDN, % of DM) ÷ 1.23
The various terms and secondary calculations for DMI and TDN are given below. The divisor (1.23) is used to adjust the calculation to have a mean and range similar to RFV. All analytical results and calculations are on a 100% dry matter basis.
¶ For alfalfa, clovers and legume/grass mixtures:
DMIlegume = (120 ÷ NDF) + [(NDFD – 45) x 0.0277]
TDNlegume = (NFC x 0.98) + (CP x 0.93) + (FA x 2.18) + [(NDFn x (NDFD/100)] - 7
¶ For warm and cool season grasses:
DMIgrass = (0.442 x CP) - (0.0100 x CP2) - (0.0638 x TDN) + (0.000922 x TDN2) + (0.180 x ADF) - (0.00196x ADF2) - (0.00529 x CP x ADF) - 2.318
TDNgrass = (NFC x 0.98) + (CP x 0.87) + (FA x 2.18) + [(NDFn x NDFDp) ÷ 100] - 10
¶ Equation terms for DMI and TDN:
- 45 = average value for fiber digestibility of alfalfa or alfalfa/grass mixtures
- ADF = acid detergent fiber %
- ASH = ash %
- CP = crude protein %
- EE = ether extract %
- FA = fatty acid* %
- NDF = neutral detergent fiber
- NDFCP = NDF crude protein %
- NDFD = 48-hour in vitro NDF digestibility
- as % of NDF
- NDFn = nitrogen-free NDF**
- NFC = non-fibrous carbohydrates***
- as % of dry matter
- TDN = total digestible nutrients %
¶ Secondary Calculations:
* estimated FA = EE – 1
** NDFn = NDF – NDFCP
** estimated NDFn = NDF x 0.93 NDFDp = 22.7 + (0.664 x NDFD)
*** NFC = 100 – (NDFn + CP + EE + ASH)
¶ References
Undersander & Moore. 2002. Relative Forage Quality in Focus on Forage. Vol 4: No. 5. Univ. of Wisconsin Extension. 2 pg.
Jeranyama & Garcia. 2004. Understanding Relative Feed Value (RFV) and Relative Forage Quality (RFQ), Extension Extra. Paper 352. South Dakota State Univ. Coop Ext., Brookings SD. 3 pg. http://openprairie.sdstate.edu/extension_extra/352
Moore & Undersander. 2002. Relative Forage Quality: An Alternative to Relative Feed Value and Quality Index in Proceedings of13th Annual Florida Ruminant Nutrition Symposium. Univ of Florida, Gainsville FL. pp. 16-32