⇦ Back to Water Resource Management Home
¶ Introduction
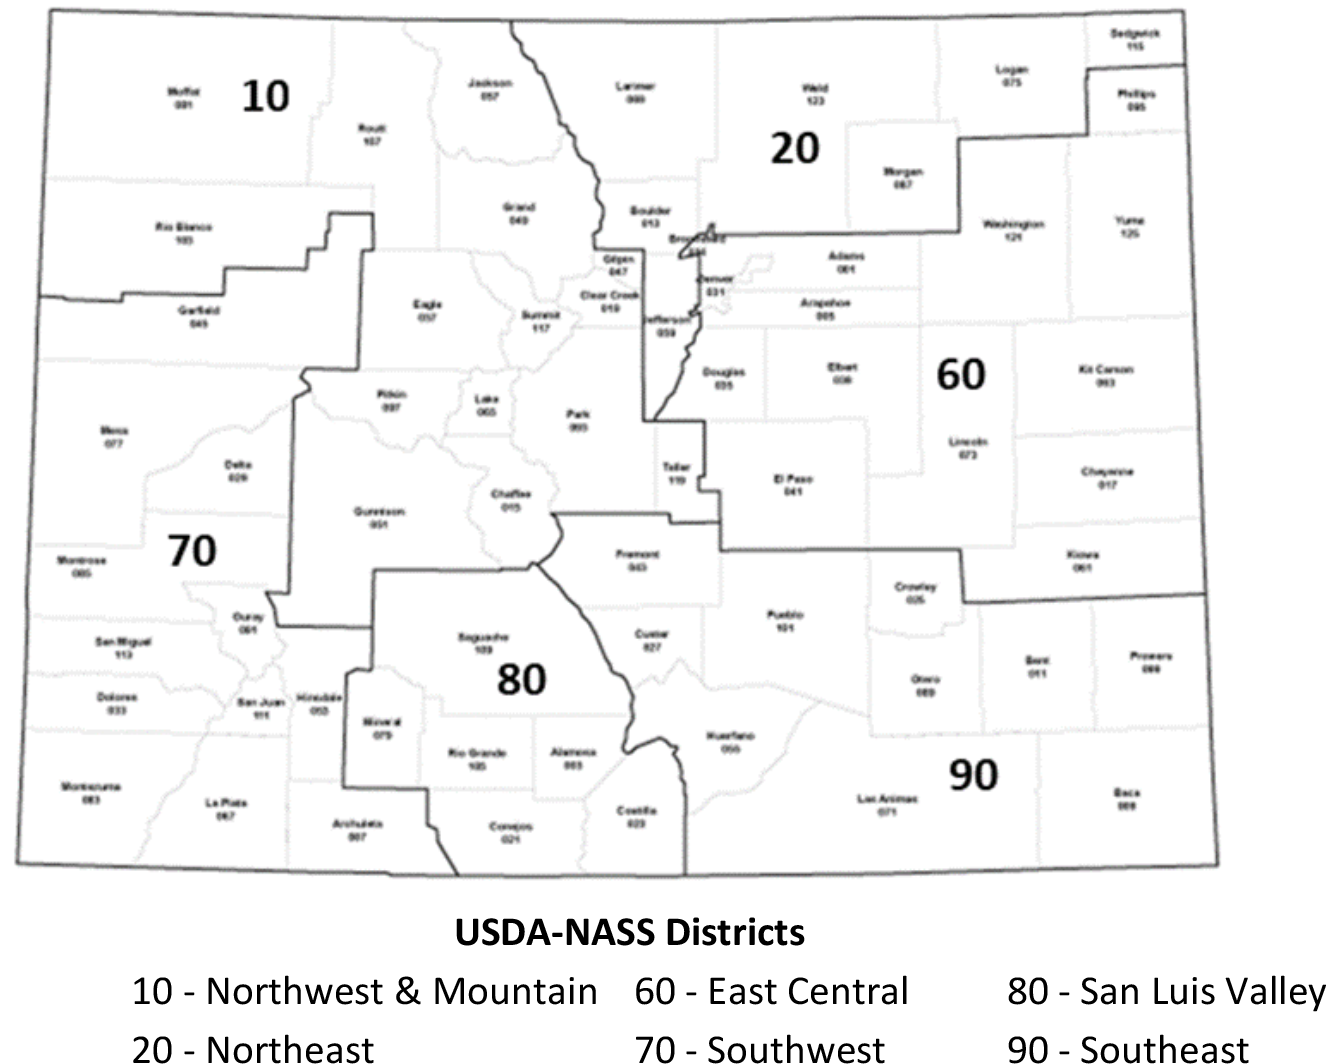
Survey of analysis results from Colorado surface and groundwater samples submitted to ServiTech Laboratories during 2013 to 2022, inclusive, for analysis of Livestock Suitability. The results are grouped by National Agricultural Statistics Service (USDA-NASS) reporting districts.
¶ Figure 1. Colorado USDA-NASS Districts
Interpretation of survey results:
- Median = 50th percentile
- Typical range = 25th and 75th percentiles
- Low - High = 5th and 95th percentiles
¶ Table 1. Total dissolved solids, TDSc mg/L |
|||
| Colorado Districts | Median | Typical range | Low - High |
| Northwest & Mountain | 820 | 57 – 2100 | 2 – 11160 |
| Northeast | 270 | 30 – 775 | 3 – 1355 |
| East Central | 165 | 20 – 1125 | 7 – 3750 |
| Southwest & San Louis Valley | 375 | 58 – 1225 | ---- |
| Southeast | 600 | 298 – 1250 | 110 – 2305 |
| Statewide | 420 | 39 – 1100 | 3 – 2400 |
("Acceptable" = 2000 - 4000 TDS mg/L)
¶ Table 2. Sulfate, SO 4 mg/L |
|||
| Colorado Districts | Median | Typical range | Low - High |
| Northwest & Mountain | 0.2 | 0.2 – 0.3 | 0.1 – 19.9 |
| Northeast | 2.6 | 0.4 – 6.2 | 0.1 – 19.4 |
| East Central | 1.5 | 0.2 – 5.0 | 0.1 – 25.6 |
| Southwest & San Louis Valley | 0.2 | 0.1 – 2.0 | ---- |
| Southeast | 1.5 | 0.4 – 3.7 | 0.1 – 10.6 |
| Statewide | 1.2 | 0.2 – 4.5 | 0.1 – 17.0 |
("Acceptable" = 200 - 500 SO4 mg/L)
¶ Table 3. Nitrate-nitrogen, NO3-N mg/L |
|||
| Colorado Districts | Median | Typical range | Low - High |
| Northwest & Mountain | 0.2 | 0.2 – 0.3 | 0.1 – 19.9 |
| Northeast | 2.6 | 0.4 – 6.2 | 0.1 – 19.4 |
| East Central | 1.5 | 0.2 – 5.0 | 0.1 – 25.6 |
| Southwest & San Louis Valley | 0.2 | 0.1 – 2.0 | ---- |
| Southeast | 1.5 | 0.4 – 3.7 | 0.1 – 10.6 |
| Statewide | 1.2 | 0.2 – 4.5 | 0.1 – 17.0 |
("Acceptable" = 30 - 70 NO3-N mg/L)
¶ Table 4. Calcium, Ca mg/L |
|||
| Colorado Districts | Median | Typical range | Low - High |
| Northwest & Mountain | 129 | 33 – 340 | 5 – 512 |
| Northeast | 83 | 40 – 225 | 3 – 369 |
| East Central | 61 | 39 – 201 | 17 – 495 |
| Southwest & San Louis Valley | 154 | 50 – 370 | ---- |
| Southeast | 125 | 82 – 243 | 17 – 423 |
| Statewide | 101 | 42 – 240 | 5 – 475 |
("Acceptable" = 80 - 120 Ca mg/L)
¶ Table 5. Magnesium, Mg mg/L |
|||
| Colorado Districts | Median | Typical range | Low - High |
| Northwest & Mountain | 63 | 12 – 177 | 1 – 1612 |
| Northeast | 28 | 10 – 75 | 1 – 137 |
| East Central | 23 | 15 – 97 | 3 – 368 |
| Southwest & San Louis Valley | 71 | 12 – 123 | ---- |
| Southeast | 46 | 27 – 105 | 8 – 202 |
| Statewide | 36 | 15 – 96 | 2 – 280 |
("Acceptable" = 50 - 120 Mg mg/L)
¶ Table 6. Potassium, K mg/L |
|||
| Colorado Districts | Median | Typical range | Low - High |
| Northwest & Mountain | 8 | 5 – 16 | 1 – 55 |
| Northeast | 6 | 3 – 15 | 2 – 31 |
| East Central | 8 | 7 – 12 | 1 – 31 |
| Southwest & San Louis Valley | 4 | 2 – 9 | ---- |
| Southeast | 6 | 6 – 8 | 3 – 12 |
| Statewide | 7 | 4 – 12 | 1 – 33 |
("Acceptable" = 80 - 120 K mg/L)
¶ Table 7. Sodium, Na mg/L |
|||
| Colorado Districts | Median | Typical range | Low - High |
| Northwest & Mountain | 204 | 30 – 578 | 2 – 3192 |
| Northeast | 152 | 38 – 267 | 12 – 481 |
| East Central | 54 | 20 – 348 | 5 – 1010 |
| Southwest & San Louis Valley | 72 | 12 – 158 | ---- |
| Southeast | 170 | 70 – 323 | 24 – 598 |
| Statewide | 158 | 34 – 330 | 9 – 910 |
("Acceptable" = Na plus Mg less than 50% of TDS)
¶ Table 8. Chloride, Cl mg/L |
|||
| Colorado Districts | Median | Typical range | Low - High |
| Northwest & Mountain | 45 | 11 – 130 | 1 – 534 |
| Northeast | 51 | 14 – 151 | 4 – 268 |
| East Central | 28 | 6 – 131 | 3 – 504 |
| Southwest & San Louis Valley | 13 | 9 – 80 | ---- |
| Southeast | 50 | 29 – 100 | 9 – 181 |
| Statewide | 45 | 14 – 126 | 4 – 310 |
("Acceptable" = 125 - 250 Cl mg/L)
¶ Table 9. Electrical conductivity, EC μmho/cm |
|||
| Colorado Districts | Median | Typical range | Low - High |
| Northwest & Mountain | 2170 | 1040 – 4090 | 100 – 15520 |
| Northeast | 1455 | 640 – 2335 | 260 – 3255 |
| East Central | 845 | 390 – 2965 | 260 – 7940 |
| Southwest & San Louis Valley | 1440 | 395 – 2525 | ---- |
| Southeast | 1565 | 945 – 2725 | 610 – 4450 |
| Statewide | 1500 | 670 – 2760 | 240 – 5220 |
("Acceptable" = 1300 - 2600 μmho/cm)
¶ Table 10. Iron, Fe mg/L |
|||
| Colorado Districts | Median | Typical range | Low - High |
| Northwest & Mountain | 0.29 | 0.11 – 0.68 | 0.05 – 18.1 |
| Northeast | 0.08 | 0.05 – 0.24 | 0.05 – 2.08 |
| East Central | 0.07 | 0.05 – 0.28 | 0.05 – 3.50 |
| Southwest & San Louis Valley | 0.17 | 0.05 – 2.66 | ---- |
| Southeast | 0.26 | 0.06 – 0.65 | 0.05 – 3.09 |
| Statewide | 0.13 | 0.05 – 0.46 | 0.05 – 3.1 |
("Acceptable" = 0.20 - 0.40 Fe mg/L)
¶ Table 11. Manganese, Mn mg/L |
|||
| Colorado Districts | Median | Typical range | Low - High |
| Northwest & Mountain | 0.104 | 0.023 – 0.406 | 0.005 – 2.582 |
| Northeast | 0.009 | 0.005 – 0.054 | 0.005 – 1.377 |
| East Central | 0.011 | 0.005 – 0.053 | 0.005 – 3.038 |
| Southwest & San Louis Valley | 0.012 | 0.005 – 0.137 | ---- |
| Southeast | 0.020 | 0.005 – 0.068 | 0.005 – 0.171 |
| Statewide | 0.017 | 0.005 – 0.100 | 0.005 – 1.440 |
("Acceptable" = 0.025 - 0.050 Mn mg/L)
¶ Table 12. Hardness, as CaCO3 grains/gallon |
|||
| Colorado Districts | Median | Typical range | Low - High |
| Northwest & Mountain | 45.0 | 7.6 – 100 | 1.0 – 446 |
| Northeast | 19.0 | 9.4 – 52 | 0.6 – 87 |
| East Central | 14.5 | 8.7 – 51 | 3.6 – 160 |
| Southwest & San Louis Valley | 33.5 | 11.0 – 83 | ---- |
| Southeast | 31.5 | 19.0 – 60 | 4.4 – 111 |
| Statewide | 25.0 | 9.8 – 58 | 1.1 – 130 |
("Moderately hard" = 3.5 - 7.0 CaCO3 grains/gallon)
¶ Table 13. Hardness, as CaCO3 mg/L |
|||
| Colorado Districts | Median | Typical range | Low - High |
| Northwest & Mountain | 780 | 130 – 1700 | 15 – 7600 |
| Northeast | 330 | 165 – 890 | 10 – 1455 |
| East Central | 245 | 150 – 875 | 60 – 2775 |
| Southwest & San Louis Valley | 570 | 190 – 1400 | ---- |
| Southeast | 540 | 330 – 1025 | 75 – 1910 |
| Statewide | 430 | 170 – 980 | 20 – 2200 |
("Moderately hard" = 60 to 120 CaCO3 mg/L)
¶ Table 14. Water pH |
|||
| Colorado Districts | Median | Typical range | Low - High |
| Northwest & Mountain | 8.1 | 7.9 – 8.3 | 7.4 – 9.1 |
| Northeast | 8.0 | 7.8 – 8.2 | 7.3 – 8.5 |
| East Central | 8.0 | 7.8 – 8.1 | 7.5 – 9.1 |
| Southwest & San Louis Valley | 7.7 | 7.1 – 8.1 | ---- |
| Southeast | 7.5 | 7.3 – 7.9 | 7.0 – 8.4 |
| Statewide | 8.0 | 7.7 – 8.2 | 7.1 – 8.6 |
("Neutral" pH = 6.5 - 7.5)
¶ Table 15. Conversion Factors |
| 1 mg/L ≈ 1 ppm |
| 1 mg/L = 1,000 µg/L |
| 1% = 10,000 mg/L |
| mmho/cm = µmho/cm x 0.001 |
| TDSc ≈ µmho/cm x 0.64 |
| TDSc ≈ mmho/cm x 640 |
| NO3 = NO3-N x 4.43 |
| SO4 = SO4-S x 3 |
| mg/gallon = mg/L x 3.785 |
| oz/gallon = mg/gal x 0.0000353 |
¶ Table 16. Sample Count |
|
| Northwest & Mountain | 67 |
| Northeast | 148 |
| East Central | 54 |
| Southwest | 11 |
| San Luis Valley | 1 |
| Southeast | 58 |
| Statewide | 339 |