⇦ Back to Water Resource Management Home
¶ Introduction
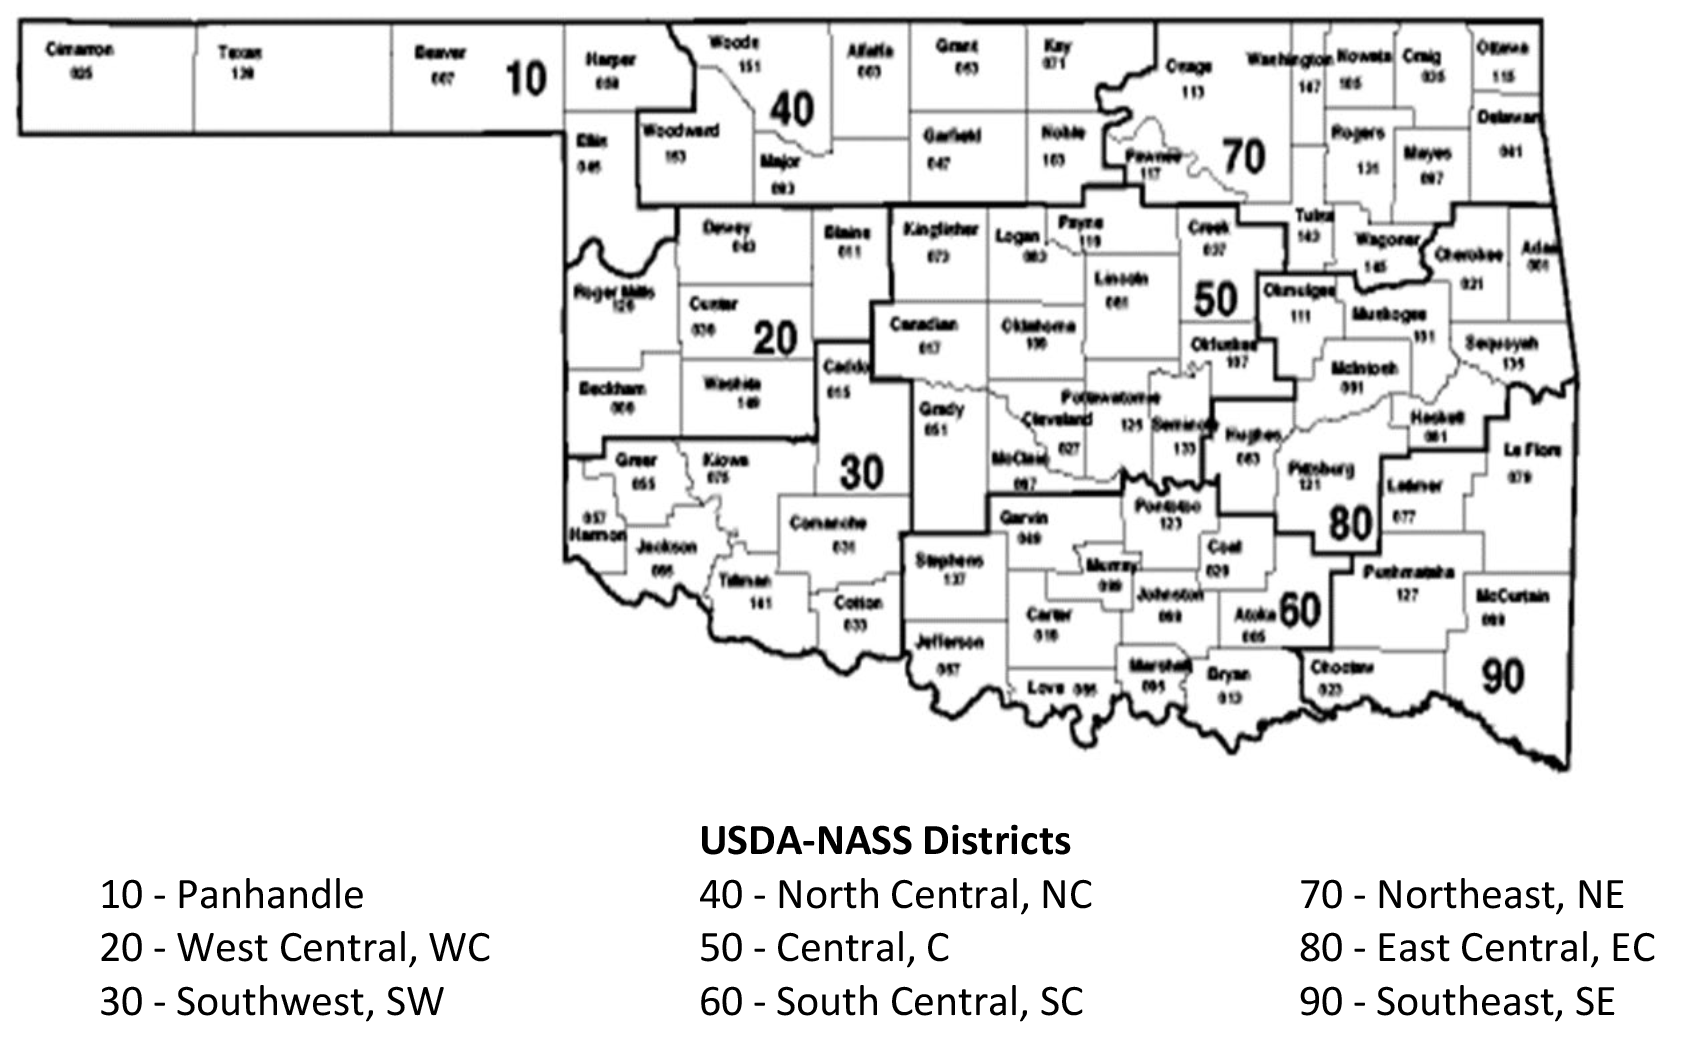
Contains survey statistics of laboratory results from water samples submitted to ServiTech Laboratories during 2011 to 2022, inclusive, for analysis of irrigation water suitability. The results are grouped by National Agricultural Statistics Service (USDA-NASS) reporting districts.
¶ Figure 1. Oklahoma USDA-NASS Districts
Interpretation of survey results:
- Median = 50th percentile
- Typical range = 25th and 75th percentiles
- Low - High = 5th and 95th percentiles
¶ Table 1. Electrical Conductivity, EC mmho/cm |
|||
| Oklahoma Districts | Median | Typical range | Low - High |
| Panhandle | 700 | 540 – 1120 | 390 – 3960 |
| West Central | 2150 | 840 – 2950 | 550 – 4400 |
| Southwest | 3700 | 2840 – 5300 | 490 – 9110 |
| North Central | 610 | 520 – 1590 | 460 – 3130 |
| Central | 1400 | 510 – 3080 | ---- |
| South Central | 660 | 450 – 980 | 140 – 2710 |
| Northeast | 1290 | 640 – 2570 | ---- |
| East Central | ---- | ---- | ---- |
| Southeast | ---- | ---- | ---- |
| Statewide | 960 | 560 – 3110 | 210 – 7560 |
¶ Table 2. Sodium Adsorption Ratio, Adjusted (SARa) |
|||
| Oklahoma Districts | Median | Typical range | Low - High |
| Panhandle | 2.2 | 0.9 – 5.5 | 0.3 – 17.4 |
| West Central | 2.1 | 1.3 – 3.2 | 0.7 – 11.9 |
| Southwest | 5.5 | 2.4 – 13.2 | 1.2 – 30.7 |
| North Central | 1.6 | 1.5 – 2.7 | 0.3 – 6.4 |
| Central | 3.7 | 1.3 – 11.7 | ---- |
| South Central | 2.6 | 0.8 – 18.3 | 0.2 – 40.6 |
| Northeast | 34.0 | 3.0 – 45.9 | ---- |
| East Central | ---- | ---- | ---- |
| Southeast | ---- | ---- | ---- |
| Statewide | 2.9 | 1.3 – 10.3 | 0.3 – 33.1 |
¶ Table 3. Chloride, Cl mg/L |
|||
| Oklahoma Districts | Median | Typical range | Low - High |
| Panhandle | 46 | 18 – 173 | 5 – 1035 |
| West Central | 77 | 21 – 145 | 10 – 1264 |
| Southwest | 345 | 180 – 895 | 8 – 2215 |
| North Central | 35 | 28 – 73 | 12 – 380 |
| Central | 84 | 11 – 430 | ---- |
| South Central | 19 | 10 – 43 | 3 – 492 |
| Northeast | 128 | 60 – 355 | ---- |
| East Central | ---- | ---- | ---- |
| Southeast | ---- | ---- | ---- |
| Statewide | 45 | 16 – 270 | 5 – 1700 |
¶ Table 4. Sodium, Na mg/L |
|||
| Oklahoma Districts | Median | Typical range | Low - High |
| Panhandle | 41 | 20 – 140 | 5 – 564 |
| West Central | 65 | 34 – 110 | 20 – 398 |
| Southwest | 220 | 122 – 548 | 26 – 1300 |
| North Central | 47 | 42 – 58 | 17 – 204 |
| Central | 120 | 34 – 159 | ---- |
| South Central | 50 | 15 – 190 | 4 – 442 |
| Northeast | 295 | 49 – 568 | ---- |
| East Central | ---- | ---- | ---- |
| Southeast | ---- | ---- | ---- |
| Statewide | 85 | 29 – 220 | 7 – 992 |
¶ Table 5. Calcium, Ca mg/L |
|||
| Oklahoma Districts | Median | Typical range | Low - High |
| Panhandle | 59 | 44 – 86 | 33 – 182 |
| West Central | 270 | 118 – 483 | 62 – 637 |
| Southwest | 630 | 305 – 699 | 56 – 802 |
| North Central | 52 | 47 – 110 | 42 – 232 |
| Central | 89 | 63 – 130 | ---- |
| South Central | 36 | 7 – 71 | 1 – 180 |
| Northeast | 8 | 4 – 28 | ---- |
| East Central | ---- | ---- | ---- |
| Southeast | ---- | ---- | ---- |
| Statewide | 75.0 | 43 – 388 | 2 – 738 |
¶ Table 6. Magnesium, Mg lb/ac-ft |
|||
| Oklahoma Districts | Median | Typical range | Low - High |
| Panhandle | 76 | 52 – 95 | 22 – 161 |
| West Central | 215 | 82 – 309 | 25 – 981 |
| Southwest | 381 | 263 – 462 | 40 – 598 |
| North Central | 52 | 44 – 82 | 39 – 240 |
| Central | 101 | 35 – 171 | ---- |
| South Central | 23 | 5 – 61 | 3 – 164 |
| Northeast | 7 | 3 – 32 | ---- |
| East Central | ---- | ---- | ---- |
| Southeast | ---- | ---- | ---- |
| Statewide | 76.0 | 30 – 263 | 3 – 520 |
¶ Table 7. Potassium, K as lb/ac-ft |
|||
| Oklahoma Districts | Median | Typical range | Low - High |
| Panhandle | 12 | 8 – 14 | 4 – 19 |
| West Central | 5 | 5 – 11 | 3 – 38 |
| Southwest | 16 | 14 – 22 | 3 – 46 |
| North Central | 3 | 3 – 5 | 3 – 22 |
| Central | 5 | 3 – 8 | ---- |
| South Central | 5 | 3 – 14 | 3 – 54 |
| Northeast | 7 | 5 – 11 | ---- |
| East Central | ---- | ---- | ---- |
| Southeast | ---- | ---- | ---- |
| Statewide | 8 | 5 – 16 | 3 – 44 |
¶ Table 8. Sulfate-sulfur, SO4-S as lb/ac-ft |
|||
| Oklahoma Districts | Median | Typical range | Low - High |
| Panhandle | 60 | 24 – 103 | 7 – 282 |
| West Central | 435 | 116 – 1360 | 12 – 2133 |
| Southwest | 1632 | 1075 – 1816 | 20 – 2126 |
| North Central | 30 | 25 – 101 | 21 – 372 |
| Central | 63 | 19 – 161 | ---- |
| South Central | 35 | 16 – 85 | 4 – 303 |
| Northeast | 15 | 5 – 129 | ---- |
| East Central | ---- | ---- | ---- |
| Southeast | ---- | ---- | ---- |
| Statewide | 84 | 27 – 1007 | 6 – 1908 |
¶ Table 9. Boron, B as lb/ac-ft |
|||
| Oklahoma Districts | Median | Typical range | Low - High |
| Panhandle | 0.4 | 0.2 – 0.6 | 0.1 – 1.1 |
| West Central | 0.5 | 0.3 – 1.1 | 0.1 – 2.3 |
| Southwest | 2.1 | 1.3 – 3.1 | 0.2 – 6.8 |
| North Central | 0.2 | 0.1 – 0.3 | 0.1 – 0.9 |
| Central | 0.6 | 0.3 – 2.5 | ---- |
| South Central | 0.3 | 0.2 – 1.3 | 0.1 – 6.9 |
| Northeast | 1.0 | 0.4 – 1.5 | ---- |
| East Central | ---- | ---- | ---- |
| Southeast | ---- | ---- | ---- |
| Statewide | 0.5 | 0.2 – 1.9 | 0.1 – 5.4 |
¶ Table 10. Nitrate-nitrogen, NO3-N mg/L |
|||
| Oklahoma Districts | Median | Typical range | Low - High |
| Panhandle | 2.52 | 1.00 – 4.36 | 0.23 – 25.30 |
| West Central | 8.24 | 3.31 – 11.70 | 1.03 – 24.01 |
| Southwest | 9.09 | 4.30 – 12.00 | 0.69 – 20.38 |
| North Central | 7.79 | 5.53 – 13.50 | 1.29 – 236.80 |
| Central | 2.25 | 1.00 – 15.60 | ---- |
| South Central | 1.00 | 0.19 – 1.27 | 0.10 – 10.00 |
| Northeast | 1.00 | 0.15 – 3.25 | ---- |
| East Central | ---- | ---- | ---- |
| Southeast | ---- | ---- | ---- |
| Statewide | 3 | 1 – 10 | 0 – 23 |
¶ Table 11. Bicarbonate, HCO3, lime equivalent as lb/ac-ft |
|||
| Oklahoma Districts | Median | Typical range | Low - High |
| Panhandle | 545 | 515 – 625 | 410 – 850 |
| West Central | 535 | 380 – 715 | 290 – 865 |
| Southwest | 560 | 490 – 600 | 375 – 855 |
| North Central | 535 | 470 – 600 | 250 – 1250 |
| Central | 735 | 625 – 1160 | ---- |
| South Central | 715 | 310 – 935 | 100 – 1275 |
| Northeast | 905 | 615 – 1290 | ---- |
| East Central | ---- | ---- | ---- |
| Southeast | ---- | ---- | ---- |
| Statewide | 560 | 470 – 760 | 170 – 1140 |
¶ Table 12. Iron, Fe mg/L |
|||
| Oklahoma Districts | Median | Typical range | Low - High |
| Panhandle | 0.05 | 0.05 – 0.18 | 0.05 – 1.69 |
| West Central | 0.06 | 0.05 – 0.17 | 0.05 – 1.36 |
| Southwest | 0.05 | 0.05 – 0.34 | 0.05 – 11.30 |
| North Central | 0.98 | 0.05 – 8.37 | 0.05 – 51.62 |
| Central | 0.05 | 0.05 – 0.71 | ---- |
| South Central | 0.09 | 0.05 – 0.41 | 0.05 – 5.86 |
| Northeast | 0.10 | 0.05 – 0.55 | ---- |
| East Central | ---- | ---- | ---- |
| Southeast | ---- | ---- | ---- |
| Statewide | 0.07 | 0.05 – 0.45 | 0.05 – 9.74 |
¶ Table 13. Manganese, Mn mg/L |
|||
| Oklahoma Districts | Median | Typical range | Low - High |
| Panhandle | 0.005 | 0.005 – 0.009 | 0.005 – 0.086 |
| West Central | 0.005 | 0.005 – 0.028 | 0.005 – 0.494 |
| Southwest | 0.005 | 0.005 – 0.038 | 0.005 – 0.575 |
| North Central | 0.043 | 0.005 – 0.170 | 0.005 – 0.879 |
| Central | 0.005 | 0.005 – 0.043 | ---- |
| South Central | 0.017 | 0.005 – 0.152 | 0.005 – 0.822 |
| Northeast | 0.020 | 0.005 – 0.250 | ---- |
| East Central | ---- | ---- | ---- |
| Southeast | ---- | ---- | ---- |
| Statewide | 0.008 | 0.005 – 0.060 | 0.005 – 0.580 |
¶ Table 14. Water pH |
|||
| Oklahoma Districts | Median | Typical range | Low - High |
| Panhandle | 7.8 | 7.6 – 8.0 | 7.3 – 8.4 |
| West Central | 7.8 | 7.6 – 8.1 | 7.2 – 8.4 |
| Southwest | 7.8 | 7.5 – 7.9 | 7.3 – 8.3 |
| North Central | 7.7 | 7.4 – 7.9 | 7.1 – 8.1 |
| Central | 7.8 | 7.5 – 8.1 | ---- |
| South Central | 7.9 | 7.5 – 8.3 | 6.8 – 9.1 |
| Northeast | 8.1 | 7.7 – 8.4 | ---- |
| East Central | ---- | ---- | ---- |
| Southeast | ---- | ---- | ---- |
| Statewide | 7.8 | 7.5 – 8.1 | 7.2 – 8.8 |
¶ Table 15. Conversion Factors |
| 1 mg/L ≈ 1 ppm |
| 1 mg/L = 1,000 µg/L |
| 1 mmho/cm = 1 dS/m |
| 1 mmho/cm = 1,000 µmho/cm lb/ac-in = mg/L x 0.2267 lb/ac-ft = mg/L x 2.7204 |
| lime equivalent, lb/ac-ft = HCO3 mg/L x 2.2304 |
| 1 acre-inch = 27,154 gallons |
| 1 acre-foot = 325,848 gallons |
¶ Table 16. Sample Count |
|
| Panhandle | 72 |
| West Central | 61 |
| Southwest | 156 |
| North Central | 62 |
| Central | 11 |
| South Central | 218 |
| Northeast | ---- |
| East Central | ---- |
| Southeast | ---- |
| Statewide | 595 |