⇦ Back to Soil Resource Management Home
¶ Introduction
“Saline” soils are those with excessive level of dissolved salts which affects the ability of the root system to absorb water.
The electrical conductivity of the soil extract (ECe) or “saturated paste” conductivity is a good early warning signal of potential salinity problems. By the time visual damage symptoms of excess salinity are evident, significant yield loss may have already occurred.
¶ Osmotic Effect
Osmosis is the process by which water will pass through a semipermeable membrane from a less concentrated solution into a more concentrated one. This equalizes the concentrations on each side of the membrane.
Dissolved substances in the interior of plant cells provide a certain salinity level. When the salinity level of the cell contents is higher than the soil water salinity, water is drawn across the cell membranes and cell walls to equalize the concentrations of the interior and the exterior of the root tissue. Figure 1 is a simple illustration of the osmotic effect.
¶ Figure 1. Root and Water Relationships in a Normal, Non-Saline Soil vs. Saline Soil
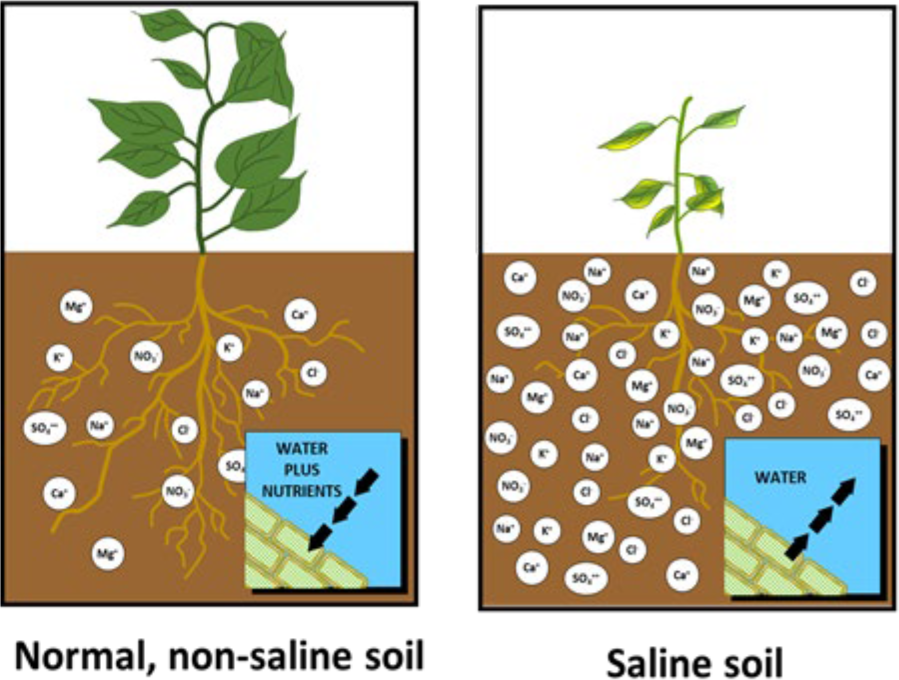
Increased salinity in the soil water increases “osmotic tension” (also “osmotic potential”). Osmotic tension refers to the amount of energy a plant must expend to extract water from the soil through osmosis.
Soil water is held in thin films around soil clay particles and in soil pore spaces. As soil water is gradually depleted, it is held more and more tightly and roots require more energy to extract it. “Centibars” are the units of force required to remove a molecule of water from a soil particle to make it available for uptake by the crop roots.
A soil is considered to be at “field capacity” when the profile is full of water, but not saturated. The osmotic tension at this point is about 33 centibars.
Plants continue to extract water as the soil dries out, but they expend more and more energy to do so. The osmotic tension increases as the soil dries.
Eventually the reaches an osmotic tension of 1500 centibars. This is called the "permanent wilting point", where a plant is expending so much energy to extract water that it cannot maintain its own life processes and dies.
Even though water still remains in the soil past the wilting point, it is unavailable to the plant because of the extremely high osmotic potential. Oven drying would be required to remove the remaining volume of unavailable water.
¶ Available Water Holding Capacity
Total water holding capacity is the entire volume of water that can be held by a given volume of soil. This can range from about 0.6 inches per foot (in/ft) for coarse sands to about 4.5 in/ft for high clay soils.
Available water holding capacity (AWHC) is the volume of water held in the soil between field capacity and the permanent wilting point. This ranges from about 0.4 inches per foot (in/ft) for coarse sands to about 2.5 in/ft for high clay soils.
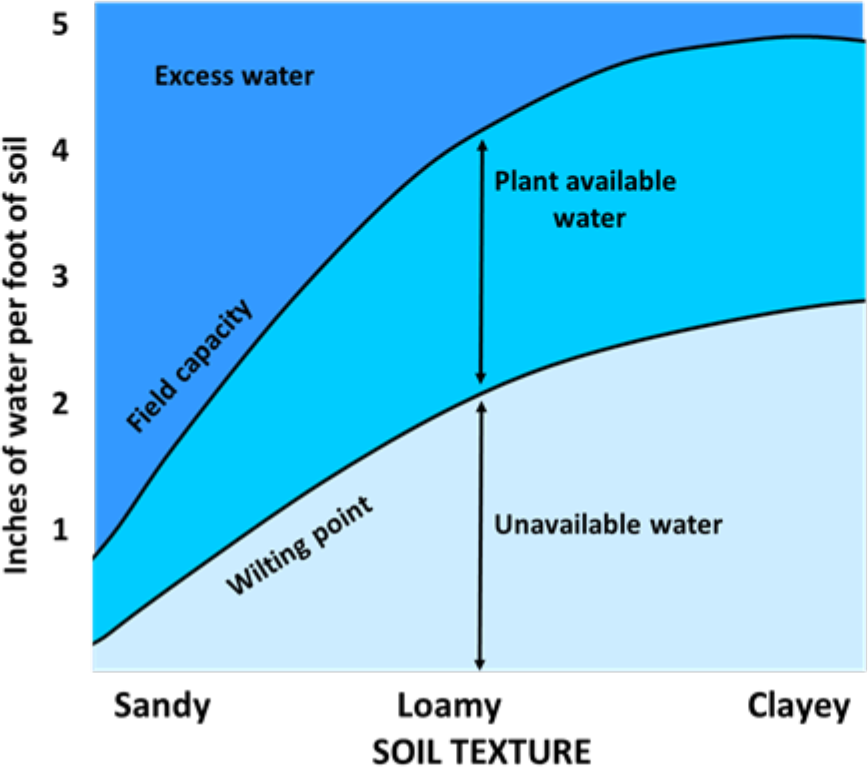
Figure 2 shows the average water holding capacities of various soil textures and the comparative ranges of plant available water. The available water holding capacity increases as clay content increases.
¶ Figure 2. Typical Water Holding Capacity for Normal, Non-Saline Soils
Good irrigation management strategy is to not allow the soil profile moisture to be depleted beyond 50% of the available water holding capacity. This optimizes yields because the crop only expends a minimal amount of energy to extract water. Soils are 50% depleted at about 150 to 200 centibars, depending on the soil texture and condition.
¶ Salinity and AWHC
The soil water and dissolved minerals are referred to as the “soil solution”. Roots require more energy to extract saline water than to extract non-saline water from the soil. This energy requirement increases as soil water salinity increases
Increasing soil salinity has the same effect on plants as if the soil were drying out. Both processes require the crop to expend more energy to extract water, increasing the osmotic tension, and placing the crop under increasing stress.
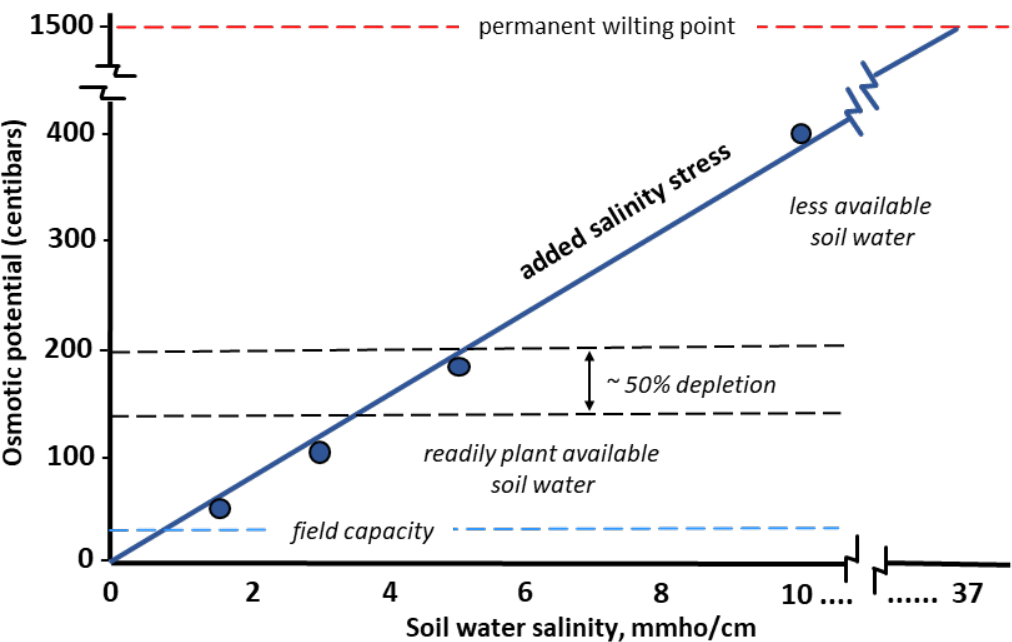
This effect is illustrated by the experimental results in Figure 3. Each 1 mmho/cm change in salinity is equivalent to a 40 centibar change in osmotic tension. As the salinity increases, the crop root system behaves as if the soil was drying out, even though the actual soil water content does not change. If the soil water salinity were high enough, the crop would behave as if it had reached the permanent wilting point and die, even if the soil was at field capacity.
¶ Figure 3. Effective Impact of Increased Soil Salinity on Plant Water Availability
Increased soil salinity effectively raises the wilting point, shown conceptually in Figure 4. The total water content of the saline soil does not change, but the range of plant available water narrows.
¶ Figure 4. Conceptual Water Holding Capacity for Saline Soils
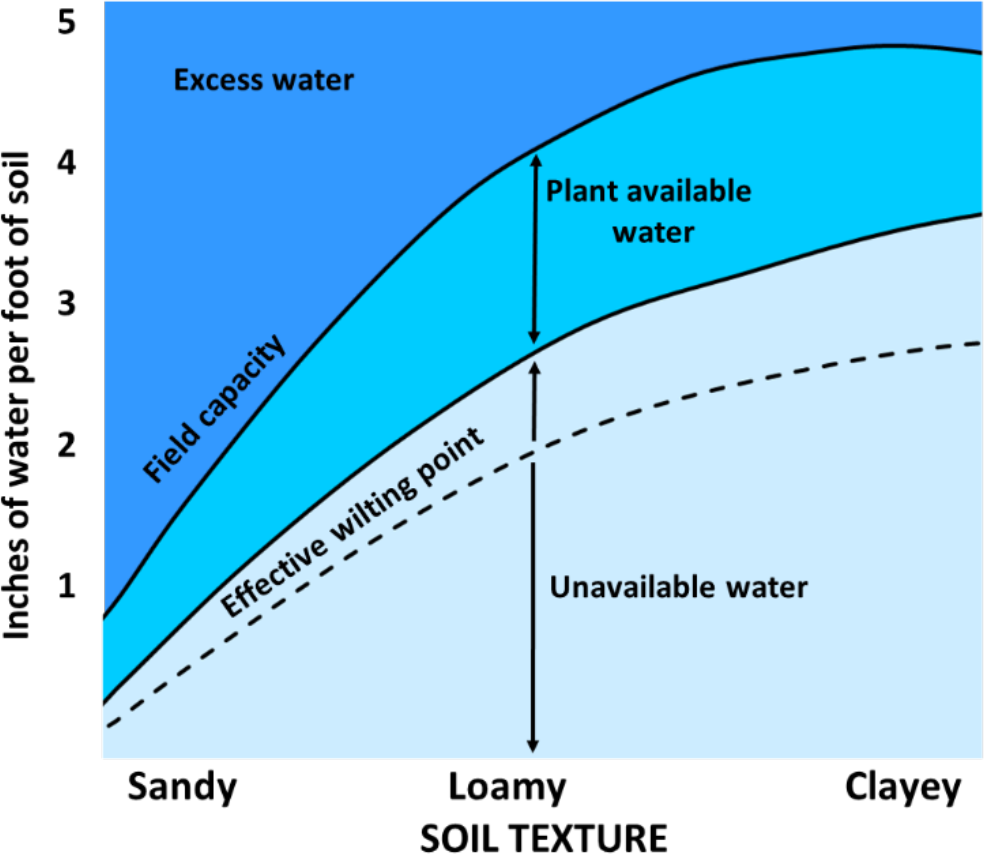
For example, a normal, medium textured soil holds about 2 inches of available water per foot of soil. The same soil with moderate salinity might only have the equivalent of 1.5 inches of plant available water per foot when we consider the increased osmotic tension. The impact of increased salinity becomes especially critical on sandy soils, because the amount of available water is naturally low and is further reduced by the additional salinity.
Saline soils may feel wet by normal standards, but the plants may show drought stress, because that particular soil has reached its “effective wilting point”. Irrigation may be required in saline soils when the soil moisture reaches 20% to 30% depletion of the available water holding capacity, rather than the normal 50% depletion guideline.
¶ Salinity Stress
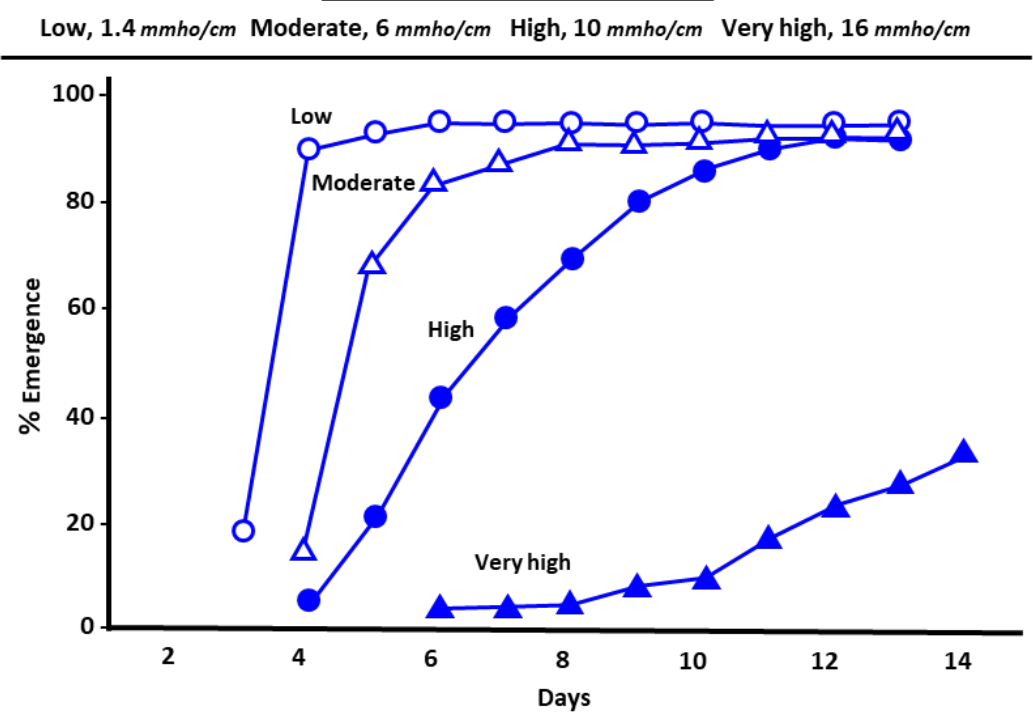
The impact of salinity stress is illustrated in Figure 5. It compares the rate of sorghum emergence as affected by four different soil salinity levels: low (1.4 mmho/cm), moderate (6 mmho/cm), high (10 mho/cm), and very high (16 mmho/cm). Emergence was delayed and damaged as follows:
- Low: emergence began, day 3; maximum emergence, day 6
- High: emergence began, day 4; maximum emergence, day 12
- Very high: emergence began, day 6; maximum emergence, about 30% after day 14
¶ Figure 5. Soil Salinity Effect on Sorghum Emergence Rate
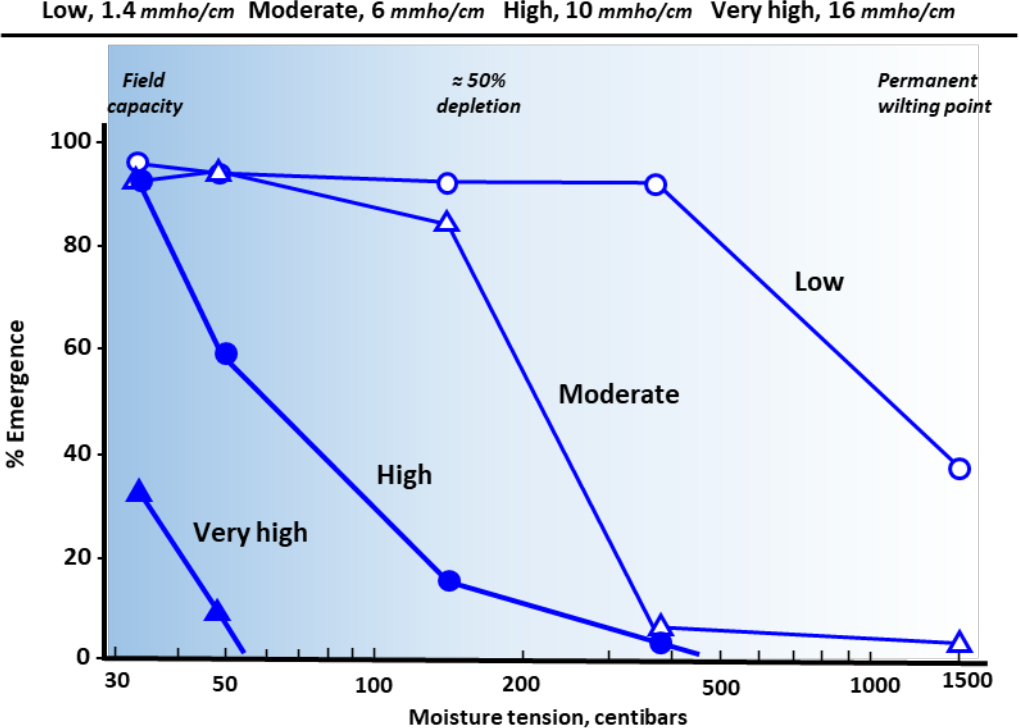
Soil moisture levels can help to moderate salinity stress. Figure 6 compares the effect on sorghum emergence from interaction of the four salinity levels with soil moisture content.
- Low: Salinity level did not affect emergence until the soil was very dry, near the wilting point
- Moderate: Salinity did not affect emergence until soil moisture was depleted beyond 50%
- High: Emergence was significantly reduced at soil moisture levels just under field capacity
- Very high: Emergence was drastically reduced even in “wet” soil
¶ Figure 6. Soil Salinity and Soil Moisture Effect on Sorghum Emergence Rate
The overall impact of salinity on crop growth and yield is summarized in Table 1. Individual crops or varieties may respond differently, but most will respond in this way. Understanding the effects of soil salinity and how salinity is influenced provides perspective to help make sound crop management decisions.
¶ Table 1. Crop Response to Increasing Soil Salinity |
||
| ECe, mmho/cm | Salinity Category | Crop Response |
| 0 – 1 | Non-saline | Salinity effects mostly negligible |
| 1 – 2 | Very slightly saline | Yields of very sensitive crops may be restricted |
| 2 – 4 | Slightly saline | Yields of moderately sensitive crops may be restricted |
| 4 – 8 | Moderately saline | Yields of many crops restricted |
| 8 – 16 | Strongly saline | Only tolerant crops yield satisfactorily |
| > 16 | Very strongly saline | Only a few very tolerant crops yield satisfactorily |
¶ References
Sanden & Sheesley. 2007. Salinity tolerance and management for alfalfa. Proc. of 38th California Alfalfa & Forage Symposium, Dec. 2-4, 2007. San Diego, CA.
Lyles and Fanning. 1964. Effects of presoaking, moisture tension, and soil salinity on the emergence of grain sorghum. Agronomy Journal 56: 518-520.