⇦ Back to Soil Resource Management Home
¶ Introduction
“Texture” refers to the roughness or smoothness of an object. Soils can be classified by their relative texture. Soil texture is often considered to be the single most important soil property.
¶ A. “Soil texture” = “how soil feels”
- Texture is result of rock and mineral “weathering”.
- Larger particles weathered into smaller particles by physical and chemical processes.
- Are different rates of weathering that are affected by long-term conditions.
- Annual temperature (freezing/thawing (northern vs. southern regions)
- Annual precipitation (desert vs. tropical)
- Primary vegetation (grass prairie vs. forest)
- Other factors.
- Affected by differences in mineral composition and structure.
- shale: easily weathered rock; forms clay-rich soils
- granite: slowly weathered rock; forms sandy, coarse soils.
- Texture remains fairly constant.
- Is not altered by management practices.
- Cannot be changed without great cost and effort.
- Texture can affect crop and soil management (see Table 1).
- Affects chemical, physical, and biological soil processes.
- e.g., natural soil fertility, soil pH, nutrient mobility
- Affects soil physical properties and structure.
- e.g., available water-holding capacity, soil water movement, soil strength.
- Affects chemical, physical, and biological soil processes.
¶ B. Is defined by proportion of mineral particles with diameter of 2.0 mm or smaller
- Particles are differentiated into three classes by size.
- Sizes or diameters measured in millimeters (mm) or micrometers (microns, µm) i. 1 mm = 1,000 µm
- Smaller particle sizes have greater surface area (see Table 2).
- Surface area and particle volume affect soil properties shown in Table 1
- Sand
- Largest particle sizes; visible to the eye
- 0.05 to 2.0 mm diameter (50 to 2000 µm
- ≈ 1/500th to 1/13th inch diameter
- Is gritty when wet or dry,
- Is not slick or sticky when wet
- Holds little water
- Silt
- Medium-sized particles
- 0.002 to 0.05 mm diameter (2 to 50 µm)
- ≈ 1/12,000th to 1/500th inch diameter
- Dry silt particles feel like flour or baby powder.
- Has smooth or slick feel when wet; may have slightly sticky feel in certain cases.
- Holds moderate amounts of water
- Clay
- Smallest soil particles; require microscope.
- Less than 0.002 mm diameter (< 2 µm).
- Less than 1/12,000th inch diameter.
- Is hard when dry
- Feels sticky when wet
- Holds large amounts of water.
- Is more chemically active than sand or silt
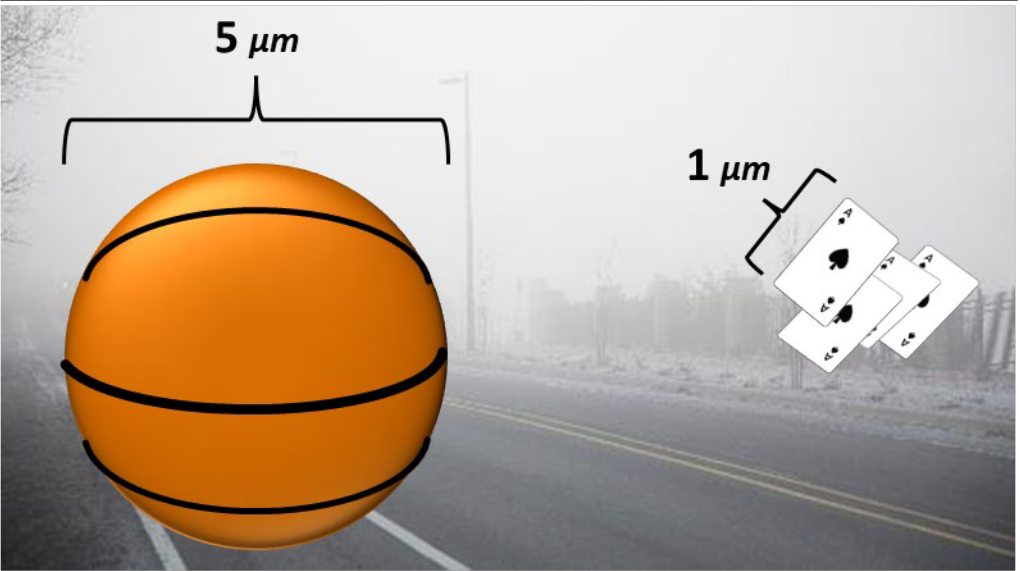
- Equivalent sizes
- Typical land-based fog droplet diameters range from 0.003 to 0.006 mm, with median size at about 0.005 mm (≈ 5 µm)
- Assume median-size fog droplet diameter equivalent to average regulation basketball diameter (24.1 cm or 9.4 inches), then:
- medium-sized clay particle (≈ 1 µm) is equivalent to length of playing card (2½ x3½ inches)
- medium-sized silt particle (≈ 26 µm) is equivalent to 8-foot stack of California-king mattresses
- medium-sized, medium sand particle (≈ 375 µm) is equivalent to 110-foot diameter boulder
- medium-sized, very coarse sand particle (≈ 1500 µm) is equivalent to 450-foot diameter boulder
¶ C. Textural classes
- USDA system used to classify agricultural soil texture.
- Particle size distribution is determined by lab analysis or estimated by hand.
- Laboratory analysis includes “hydrometer” method or “pipette” method.
- For hand method see Crop File 4.01.006, “Soil Texture by Feel”.
- Texture classes defined in “soil textural triangle” using % sand and % clay by weight.
- AASHTO or Unified system used for construction purposes.
- Both AASHTO and Unified systems use sieve size ranges, plasticity index, particle uniformity, potential shrinkage, and/or liquid limits to classify soil textures and types.
- AASHTO: American Association of State Highway and Transportation Officials.
- Unified system classifies soil texture characteristics for construction purposes other than highway construction
¶ D. Soil textural triangle
- Laboratory tests for “particle size analysis”
- Analysis determines percentages of sand and clay by weight in soil sample.
- % sand plus % silt plus % clay will always equal 100%.
- Recognizes three primary textural groups.
- Sands (coarse-textured)
- Have 70% to 100% sand sized particles by weight
- Clays (fine-textured)
- Have at least 35% to 40% clay-sized particles by weight
- Loams (medium-textured
- Have more uniform proportions of sand and clay than coarse-textured or fine-textured soils
- Sands (coarse-textured)
- Twelve texture classes are defined by proportion of particle sizes.
- Sand, silt, clay, or loam characteristics dominate primary classes.
- Primary classification may be modified by proportion of particle size within primary group.
- e.g., 45% clay + 50% sand + 5% silt = sandy clay
- e.g., 45% clay + 5% sand + 50% silt = silty clay
- Texture can be further defined by sand grain size
- i. e.g., “fine sandy loam” or “very fine sandy loam”
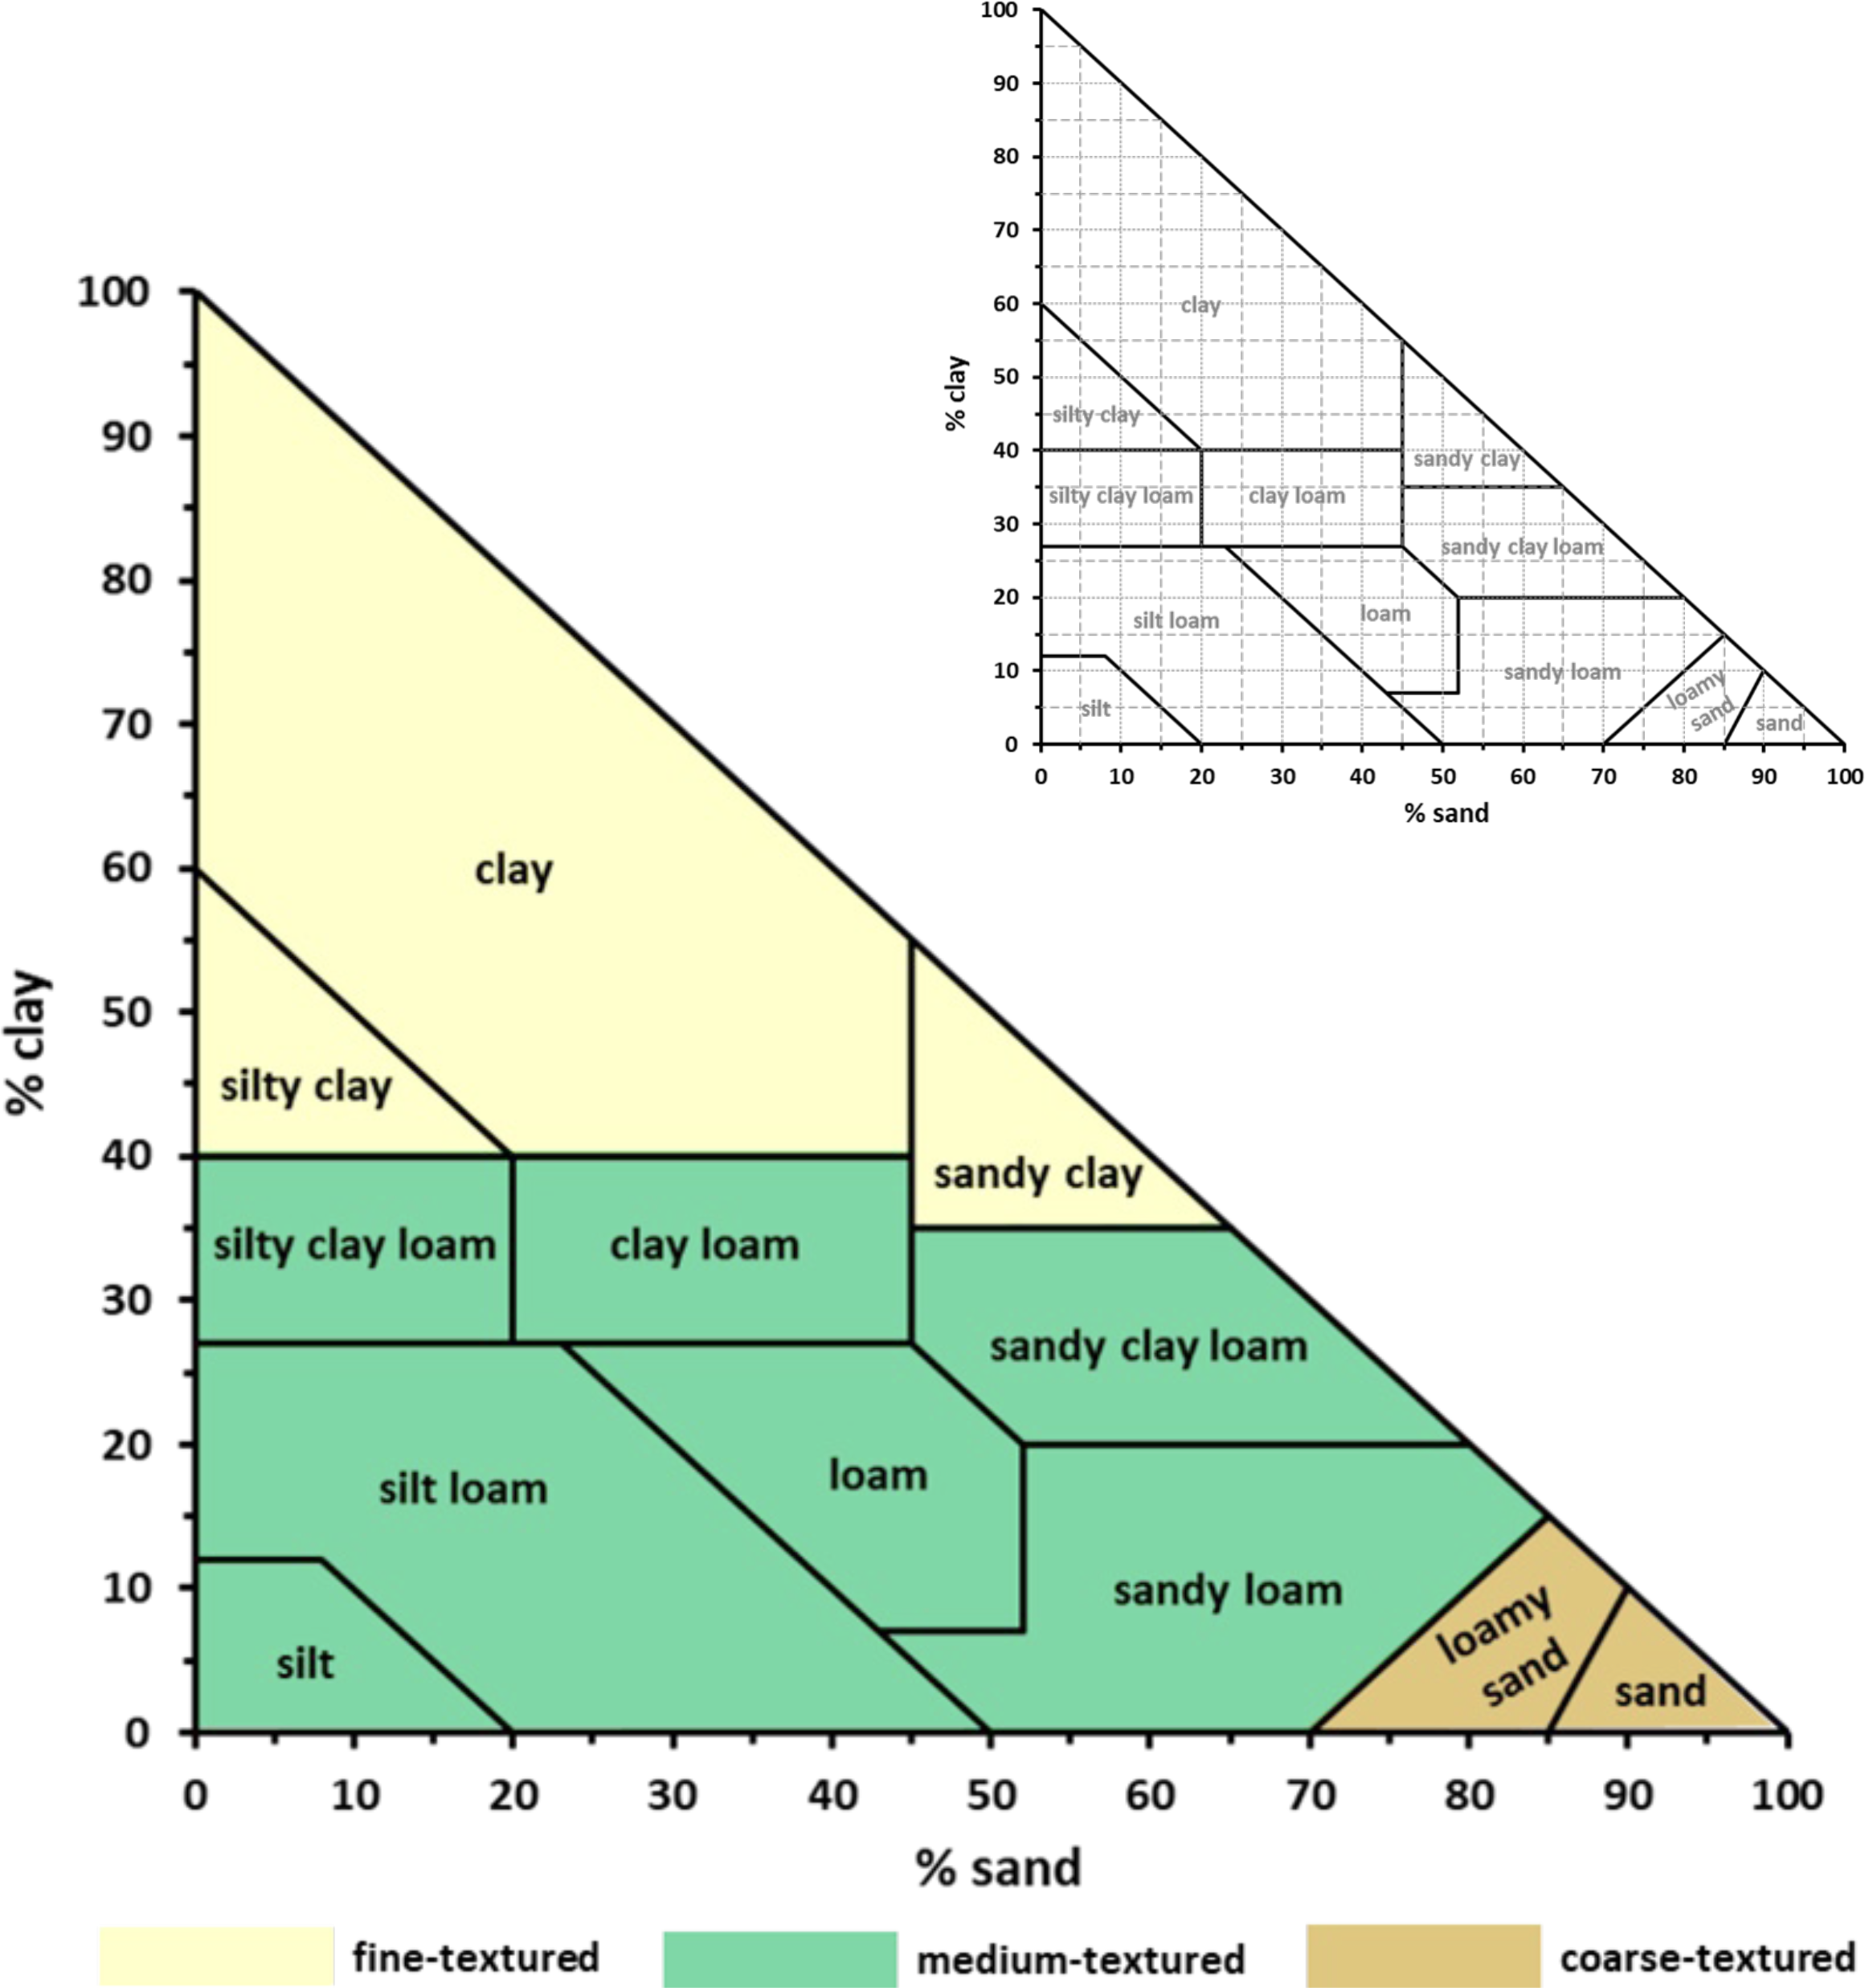
- Using the textural triangle (see Figure 2).
- Determine % sand and % clay from lab analysis.
- Silt content not required because: 100% - (% sand + % clay) = % silt
- Locate % sand on bottom side of triangle (“X axis”).
- Locate % clay on left-hand side of triangle (“Y axis”).
- Follow % sand content vertically upward and % clay content horizontally to left.
- Intersection of % sand and % clay will fall within specified soil textural class.
- Examples:
- 40% sand, 20% clay = loam texture (40% silt)
- 15% sand, 65% clay = clay texture (20% silt)
- 20% sand, 15% clay = silt loam texture (65% silt)
- 65% sand, 15% clay = sandy loam texture (20% silt)
- Determine % sand and % clay from lab analysis.
¶ Table 1. Soil Properties Related to Texture |
|||
| Soil properties: | Relative effect on soil property: | ||
| --------- Texture ---------- | |||
| Coarse | Medium | Fine | |
| Water storage | low | moderate | high |
| Water movement | low | moderate | high |
| Power needed for digging/tillage Wind or water erosion |
low | moderate | high |
| (Ease of particle detachment) |
high | moderate | low |
| Wind or water erosion (Ease of transport) | low | moderate | high |
| Plant nutrient storage | low | moderate | high |
| Contaminant movement | high | moderate | low |
¶ Table 2. Characteristics of Soil Particles |
|||||||
| Particle type | Diameter mm | Volume mm3 | Number of particles: | Surface area in 1 grama | |||
| per gram | per ounce | cm2 | inches2 | ft2 | |||
| Sand | 2.00 - 0.05 | ||||||
| • Very coarse sand | 2.00-1.00 | 4.18 | 90 | 2,550 | 11 | 1.7 | --- |
| • Coarse sand | 1.00-0.50 | 0.524 | 720 | 20,410 | 23 | 3.6 | --- |
| • Medium sand | 0.50-0.25 | 0.0655 | 5,700 | 161,595 | 45 | 7 | --- |
| • Fine sand | 0.25-0.10 | 0.00818 | 46,000 | 1,304,100 | 91 | 14.1 | 0.1 |
| • Very fine sand | 0.10-0.05 | 0.000524 | 722,000 | 20,468,700 | 227 | 35.2 | 0.25 |
| Silt | 0.05-0.002 | 0.000065 | 5,776,000 | 163,749,600 | 454 | 70.4 | 0.5 |
| Clay | < 0.002 | 0.0000000042 | 90,260,853,000 | 2,558,895,182,550 | 8,000,000 | 1,240,000 | 8,611b |
| a Surface area of platy montmorillonite determined by analysis, all other surface areas calculated for spheres of largest particle size permissible by class b 8,611 ft2 = 0.2 acre |
|||||||
¶ Table 3. Soil Texture Terms and Classes |
||
| Common name | Texture | Textural class name |
| Sandy soils | Coarse | Sand |
| Loamy sand | ||
| Loamy soils | Moderately coarse | Sandy loam |
| Fine sandy loam | ||
| Medium | Very fine sandy loam | |
| Loam | ||
| Silt loam | ||
| Silt | ||
| Moderately fine | Clay loam | |
| Sandy clay loam | ||
| Silty clay loam | ||
| Clayey soils | Fine | Sandy clay |
| Silty clay | ||
| Clay | ||
¶ Figure 1. Size Comparisons
¶ Figure 2. USDA Textural Triangle
¶ References
Presley & Thien. 2008. Pub. No. MF-2852, Estimating Soil Texture By Feel. Kansas State Univ Coop. Ext.Serv., Manhattan KS. 4 pg.
McClauly, Jones, & Jacobsen. 2005. Soil & Water Mgmt. Module 1, Basic Soil Properties. Montana State Univ. Ext. Serv., Bozeman MT. 12 pg.
Brady. 1974. Nature and Properties of Soil, 8th Ed. McMillan Publ., New York. pg. 45-49, 285-288.
Gee & Bauder. 1986. “Particle Size Analysis” in Methods of Soil Analysis, Part 1, Physical and Mineralogical Methods, 2nd Ed. Soil Sci. Soc. of America, Madison WI. pg. 383-386.
Foth. 1984. Fundamentals of Soil Science, 7th. Ed. John Wiley & Sons. pg. 22-28.
Muhammad, Flecker, Leitgeb, & Gebhart. 200). Characterization of fog attenuation in terrestrial free space links. Optical Engineering - OPT ENG. 46. 10.1117/1.2749502. access
Unknown. 2017. Basic Civil Engineering: Classification of soil – USDA, AASHTO, Unified classification methods. accessed 30Aug2022