⇦ Back to Soil Fertility and Plant Nutrition Home
¶ Phosphorus, Phosphate, or Phosphate?
Elemental phosphorus, “P”, is highly reactive and is never found in nature as a free element. It occurs in nature as an inorganic mineral phosphate, “PO4”, combined with calcium, aluminum, iron, magnesium, and other elements. In common fertilizer terminology, “phosphate” refers to the regulatory expression as “phosphorus pentoxide” or “P2O5”. (P x 2.28 = P2O5, P2O5 x 0.44 = P)
¶ A. Phosphorus in the plant
- Phosphorus required by plants in relatively large amounts
- Requirements much lower than nitrogen and potassium
- Requirement similar to sulfur, calcium, or magnesium
- Total content in mature leaves ranges from 0.2% to 0.5% P
- Found in various compounds
- ATP (adenosine triphosphate): energy transfer
- NADP (nicotinamide adenine dicucleotide phosphate): photosynthesis and respiration
- Nucleic acids: DNA, RNA
- Phospholipids: cell and organelle membranes
- Mobile in plant
- Most phosphorus taken up by roots as inorganic orthophosphate ions (HPO42- or H2PO4-)
- Translocated from older leaves to young growing points
- Phosphorus concentration in root cells and xylem sap 100 to 1000 times higher than soil concentration
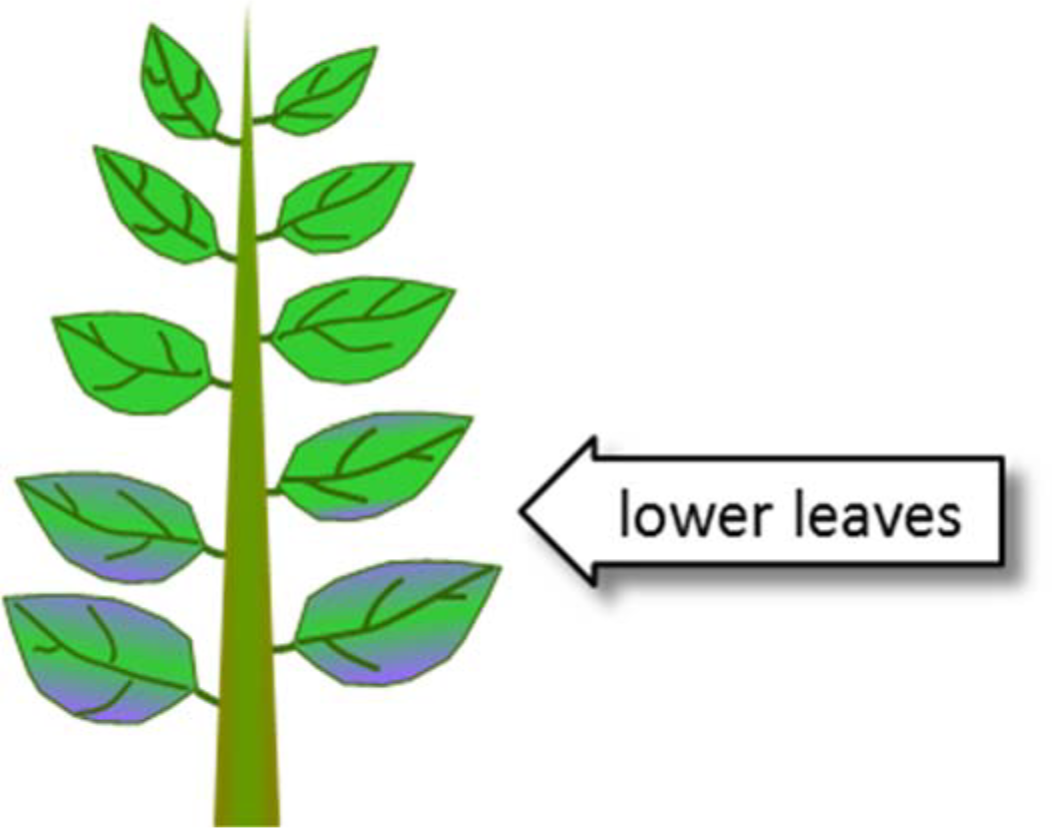
- Deficiency symptoms
- Generally occurs when plant content is below 0.20% P
- Stunted plants, poor root growth
- Leaf discoloration
- Darkish-green color in older leaves
- Reddish-purple color with necrosis of leaf margins
- Delayed maturity; reduced yield, quality
- Purpling can be genetic response to stresses not related to soil phosphorus deficiency
- Restricted or slow root growth is factor
- Cold soils; wet, poorly drained or excessively dry soils
- Damaged from herbicide, fertilizer, pests
- Compaction, shallow rooting
- Cool, night-time temperatures (≈ 40 to 45°F) with sunny, warm days (≈ 60 to 70°F )
- Unmetabolized sugars accumulate in leaf and stem tissues of young plants
- Triggers production of anthocyanins (red pigments) in some species and varieties
- Symptoms often disappear when rapid growth resumes under more favorable conditions
- Restricted or slow root growth is factor
¶ Figure 1. Phosphorus Deficiency Symptoms
¶ B. Phosphorus excess
- Not directly toxic to plants or other organisms
- Environmental problems with excess phosphorus
- Stimulates growth of aquatic organisms, like algae
- Accelerates eutrophication of surface waters
- Excess soil phosphorus increases potential for offsite transport and loss
- Particulate phosphorus contained in sediment that is transported off-sit by storm-water or irrigation runoff
- Storm-water runoff also contains high concentrations of soluble phosphorus
- Leaching can occur if preferential flow pathways are present in soil and subsoil
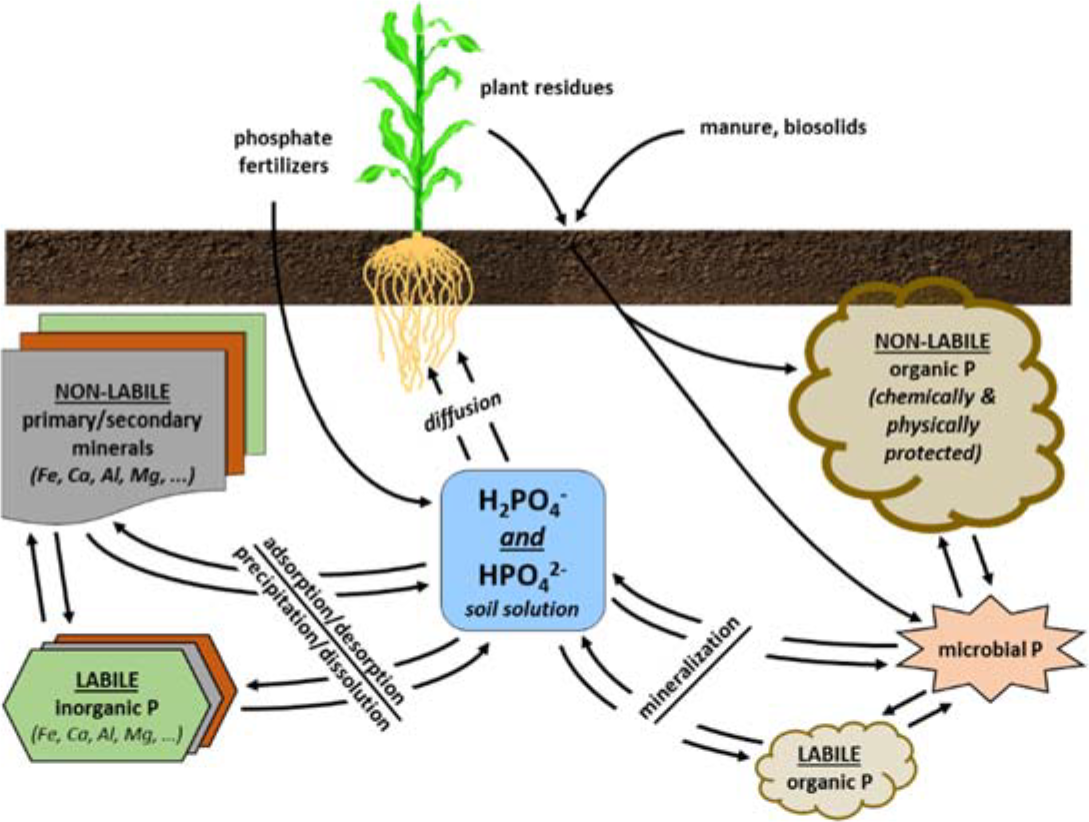
¶ Figure 2. Phosphorus Sources
¶ C. Phosphorus in the soil
- Common total phosphorus concentration in surface soil about 200 to 1000 ppm P
- May range from 50 to 2500 ppm total P
- Soil test phosphorus is poor predictor of total phosphorus
- Phosphorus sources
- Mineralization of organic matter
- Organic matter can contain from 20% to 80% of total soil phosphorus
- Weathering (dissolution) of primary soil minerals
- Phosphorus widely distributed in many minerals
- Apatite (an impure tri-calcium phosphate) is common mineral
- Primary minerals are very slowly available, long-term phosphorus source
- Dissolution of secondary soil minerals
- Solubility of individual secondary minerals varies greatly and change with changes in soil pH
- Predominantly iron and aluminum phosphates in acid soils
- Predominantly calcium and magnesium phosphates in alkaline soils
- Applications of manure, compost, biosolids, or commercial fertilizers
- Mineralization of organic matter
- Phosphorus uptake
- Most phosphorus taken up by roots as inorganic orthophosphate ion (HPO42- or H2PO4-)
- H2PO4- uptake is more rapid than uptake of HPO42-
- Related to divalent vs. monovalent charge
- Roots absorb some organic phosphates (nucleic acids, phytin), but of minor importance to overall phosphorus nutrition
- H2PO4- uptake is more rapid than uptake of HPO42-
- Phosphorus moves to plant roots primarily by diffusion
- HPO42-, H2PO4- concentrations are low in solution
- About 0.05 ppm P in agricultural soils
- HPO42-, H2PO4- concentrations are low in solution
- Relative amounts of HPO42- and H2PO4- depend upon soil solution pH
- Present in equal amounts at pH 7.2
- HPO42- concentrations higher in alkaline conditions
- H2PO4- concentrations higher in acidic conditions
- Cation/anion balance
- Phosphate uptake increases Ca2+, Mg2+, K+ uptake
- Charge balance, co-transport
- Phosphate anion uptake can inhibit or compete with NO3- and SO42- anion uptake
- Phosphate uptake increases Ca2+, Mg2+, K+ uptake
- Rhizosphere pH helps control uptake
- Roots release bicarbonate anion (HCO3-) and in turn absorb phosphate anion (H2PO4-)
- For each phosphate anion (H2PO4-) absorbed, one hydroxide ion (OH-) is released into soil
- Most phosphorus taken up by roots as inorganic orthophosphate ion (HPO42- or H2PO4-)
- Size and density of plant root systems very important for phosphorus uptake
- Individual phosphate ion moves less than 1 mm (0.04 inch) in a growing season
- Low phosphate concentrations in soil solution, so fewer ions than some other nutrients
- Many adsorption, precipitation reactions in soil that “compete” with root uptake
- Mycorrhizal infection of roots important for phosphorus uptake in some species
- Mycorrhizae can serve as “surrogate root system”
- Soil temperature important
- Affects speed of root growth and of soil reactions that make phosphorus available
- e.g., soil temperature reduced from 70°F to 58°F
- Corn root growth decreased 5-fold
- Phosphorus uptake by corn roots decreased 4-fold
- Phosphorus transformations in soil (for further details, see Crop File 1.04.311 Phosphorus Transformations in the Soil)
- Weathering down and formation of various “non-labile” primary and secondary soil minerals
- Consists mainly of insoluble or sparingly soluble mineral phosphates
- Mineralization
- Organic phosphorus released as plant available inorganic phosphate
- Immobilization
- Microbial uptake of inorganic phosphate from the soil and incorporation into organic forms
- Adsorption/desorption
- Ionic exchange with sites on various mineral surfaces
- Includes surfaces of clays, iron oxides, aluminum oxides, and carbonates
- Precipitation/dissolution of “labile” secondary minerals
- Consists mainly of highly to moderately soluble calcium, aluminum, and iron phosphates
- Weathering down and formation of various “non-labile” primary and secondary soil minerals
¶ D. Phosphorus “availability”
- Availability differs among various phosphorus fractions
- Soil solution phosphorus
- Considered “immediately available” for root uptake
- About 0.01% of total soil phosphorus
- Labile phosphorus
- Labile: readily reactive (“changeable”) fractions
- Rapidly replenishes solution phosphorus
- About 10% to 20% of total soil phosphorus
- Portion of adsorbed phosphorus that dissociates easily
- Rapidly decomposed organic matter fractions
- Readily soluble to moderately soluble phosphorus minerals
- Non-labile phosphorus
- Non-labile: slowly reactive or unreactive fractions
- Slowly replenishes solution phosphorus or labile phosphorus fractions
- About 80% to 90% of total soil phosphorus
- Strongly adsorbed phosphorus
- Stable organic compounds; not readily decomposed
- Slowly soluble or insoluble phosphorus minerals
- Soil solution phosphorus
- Phosphorus “intensity”
- Intensity: soil solution phosphorus
- Fixation: removal of inorganic phosphorus from soil solution
- Assimilation as organic phosphorus by plants or microbes
- Adsorption on mineral and clay surfaces
- Precipitation of various minerals
- Fixation reactions reduce solution phosphorus (reduces intensity)
- Reactions also provide reservoir to replenish solution phosphorus (maintains intensity)
- Phosphorus “capacity”
- Quantity of solid soil fractions available to replenish solution phosphorus that is taken up by plant roots
- Includes labile and non-labile fractions that are reserves for replenishing solution phosphorus
- Adsorbed phosphate
- Organic phosphorus fractions
- Mineral phosphorus fractions
- Relative amount and proportion of labile and non-labile fractions affect quantity
- Phosphorus buffering
- Buffering capacity: ability of soil to maintain phosphorus concentrations (intensity) in soil solution
- Poorly buffered soil: Phosphorus reserves unable to sustain required intensity
- Well buffered soil: Phosphorus reserves meet or exceed required intensity
- Buffering capacity: ability of soil to maintain phosphorus concentrations (intensity) in soil solution
¶ E. Soil testing for phosphorus
- Soil test provides relative index of buffering ability
- Extracting solution and soil are in contact for only short time (e.g., five minutes)
- Amount of extracted phosphorus indicates relative ability of soil to resupply soil solution phosphorus
- Short-duration test methods intended to provide estimate of potential, season-long “availability”
- Soil test must be calibrated to growth response or yield response by field research
- Modes of action
- Acidic solvent
- Extracting solution with pH of 2 to
- Mainly dissolves calcium phosphate, some iron and aluminum phosphates
- Anion replacement
- Targets phosphate adsorbed to surfaces of carbonates, iron oxides, and aluminum oxides
- Adsorbed anion (HPO42-, H2PO4-) is replaced by another anion, including:
- Bicarbonate, HCO3-
- Sulfate, SO42-
- Acetate, C2H3O2−
- Citrate, C6H5O73−
- Cation complexation
- Fluoride ion (F-) is effective at complexing aluminum ions (Al3+)
- Reduces Al3+ concentration in solution
- Aluminum phosphates dissolve to maintain Al3+ concentration in solution
- Fluoride ion (F-) reacts with calcium phosphates
- Forms insoluble calcium fluoride (CaF2)
- Calcium phosphates dissolve to maintain Ca2+ concentration in solution
- Bicarbonate (HCO3-) causes solution calcium to precipitate as calcium carbonate
- Reduces Ca2+ concentration in solution
- Calcium phosphates dissolve to maintain Ca2+ concentration in solution
- Fluoride ion (F-) is effective at complexing aluminum ions (Al3+)
- Acidic solvent
- Phosphorus determination
- Extracting solution is separated from soil by filtering
- Concentration of phosphate ions released to extracting solution measured by colorimetry or spectrometry
- Soil analysis methods (See Crop File 1.01.231, Soil Test Phosphorus Methods)
¶ F. Phosphorus nutrient sources
- Fertilizer phosphorus content expressed as “percent phosphate” or “% P2O5”
- Phosphorus not actually present in fertilizers as P2O5
- Holdover from 1800’s when chemists expressed elemental concentrations in “oxide” form
- Many laws governing fertilizer guarantees originally written during this time; maintains expression today
- Organic, biological sources
- Manure
- Ranges from 5 to 60 lb P2O5/ton depending on animal species and storage/handling methods
- Biosolids
- Typical range: freshly digested biosolids range about 3.5% to 8.0% P2O5
- Phosphorus content often elevated due to use of household and commercial detergents
- Bone meal
- Common analysis: 10% to 20% P2O5
- Manure
- Common inorganic fertilizer materials
- Rock phosphate
- Base product for manufactured fertilizers
- Total content about 20% to 36% P2O5
- Zero water soluble phosphorus
- Ineffective if applied to soil with pH above 7
- Normal superphosphate, Ca(H2PO4)2•CaSO4
- Common analysis: 0-20-0-12sul
- Dry prilled product
- Triple superphosphate (TSP), Ca(H2PO4)2
- Common analysis: 0-45-0
- Dry prilled product
- Diammonium phosphate (DAP), (NH4)2HPO4
- Common analysis: 18-46-0
- Dry prilled product
- Monoammonium phosphate (MAP), NH4H2PO4
- Common analysis: 11-52-0
- Dry prilled product
- Used to produce suspension-grade fertilizers
- Ammonium polyphosphate (APP), (NH4)3HP2O7 + (NH4)2HPO4
- Common analysis: 10-34-0, 11-37-0
- Liquid solution
- Able to “sequester” micronutrient in solution
- Rock phosphate
¶ G. Phosphorus nutrient management
- Fertilizer placement
- Topdress (surface broadcast, no incorporation)
- Phosphorus has limited soil mobility
- Surface-applied phosphorus will move to roots very slowly
- Often ineffective for annual crops or newly planted perennial crops
- Acceptable method for established perennial forages
- Surface broadcast with soil incorporation
- Places immobile phosphorus in root zone
- Exposes phosphorus to large amount of soil surface area
- Highest potential for phosphorus fixation under proper conditions
- Placed in subsoil band or strip
- Minimizes contact between soil and fertilizer
- Less fixation potential compared to same amount of phosphorus broadcast and incorporated
- Roots will proliferate in high phosphorus zone
- Topdress (surface broadcast, no incorporation)
- Application method (See Crop File 2.01.120, Phosphorus Fertilizer Placement: General Overview)
- Depends upon:
- Soil test phosphorus
- Soil characteristics (texture, excess lime, etc.)
- Crop root system characteristics
- Soil conditions (temperature, moisture, etc.)
- Banding generally most effective on low phosphorus soils with high fixation capacity
- Broadcast/incorporate or banding generally have similar efficacy in high phosphorus soils or soils with low fixation capacity
- Foliar or fertigation applications generally not effective
- Depends upon:
- Application frequency
- May be affected by soil’s phosphorus fixation capacity
- Better to use smaller, more frequent applications or banding if fixation potential is high
- Single broadcast applications every three to four years are effective if fixation potential is low
- Application rates
- Affected by:
- Soil test value; soil type characteristics
- Crop requirement, productivity
- Land tenure (rent, own, lease)
- Product cost, application cost, equipment availability
- Return from yield over fertilizer cost
- Sufficiency rate approach
- Intended to optimize economic return during current year (e.g., single-year lease or rent)
- Achieve 90% to 95% of maximum yield
- Requires annual soil test to adjust rate
- Build rate approach
- Choose target soil test range to maximize yield
- Target range should remove phosphorus as factor that limits yield (100% of maximum)
- Not intended to optimize annual economic return; considers long-term view, future returns (e.g., land is owned)
- Plan time frame for fertilizer applications, typically four to eight years
- Calculate application rates from difference between current soil test level and target range
- e.g., Apply 18 to 20 lb P2O5 /ac for each 1 ppm soil test P
- Divide total application required by time frame in years to calculate annual rate
- Monitor by soil test every three to four years
- When target range is reached, cease applications to build soil test
- Lower rate maintenance applications or “starter” applications are optional
- Choose target soil test range to maximize yield
- Maintenance rate approach
- Rate based on phosphorus removed by annual grain or forage harvest
- Does not require soil sampling; assumes no change in soil test from year-to-year
- Combination approach
- May utilizes different approaches, depending on soil test category or other factors
- Sufficiency plus build in “low” category
- Build plus maintenance in “medium” category
- Maintenance in “high” category
- Starter from “low” to “very high” category
- Adjust rates based on economic return or on acceptable risk
- May utilizes different approaches, depending on soil test category or other factors
- Affected by: