⇦ Back to Soil Fertility and Plant Nutrition Home
¶ Introduction
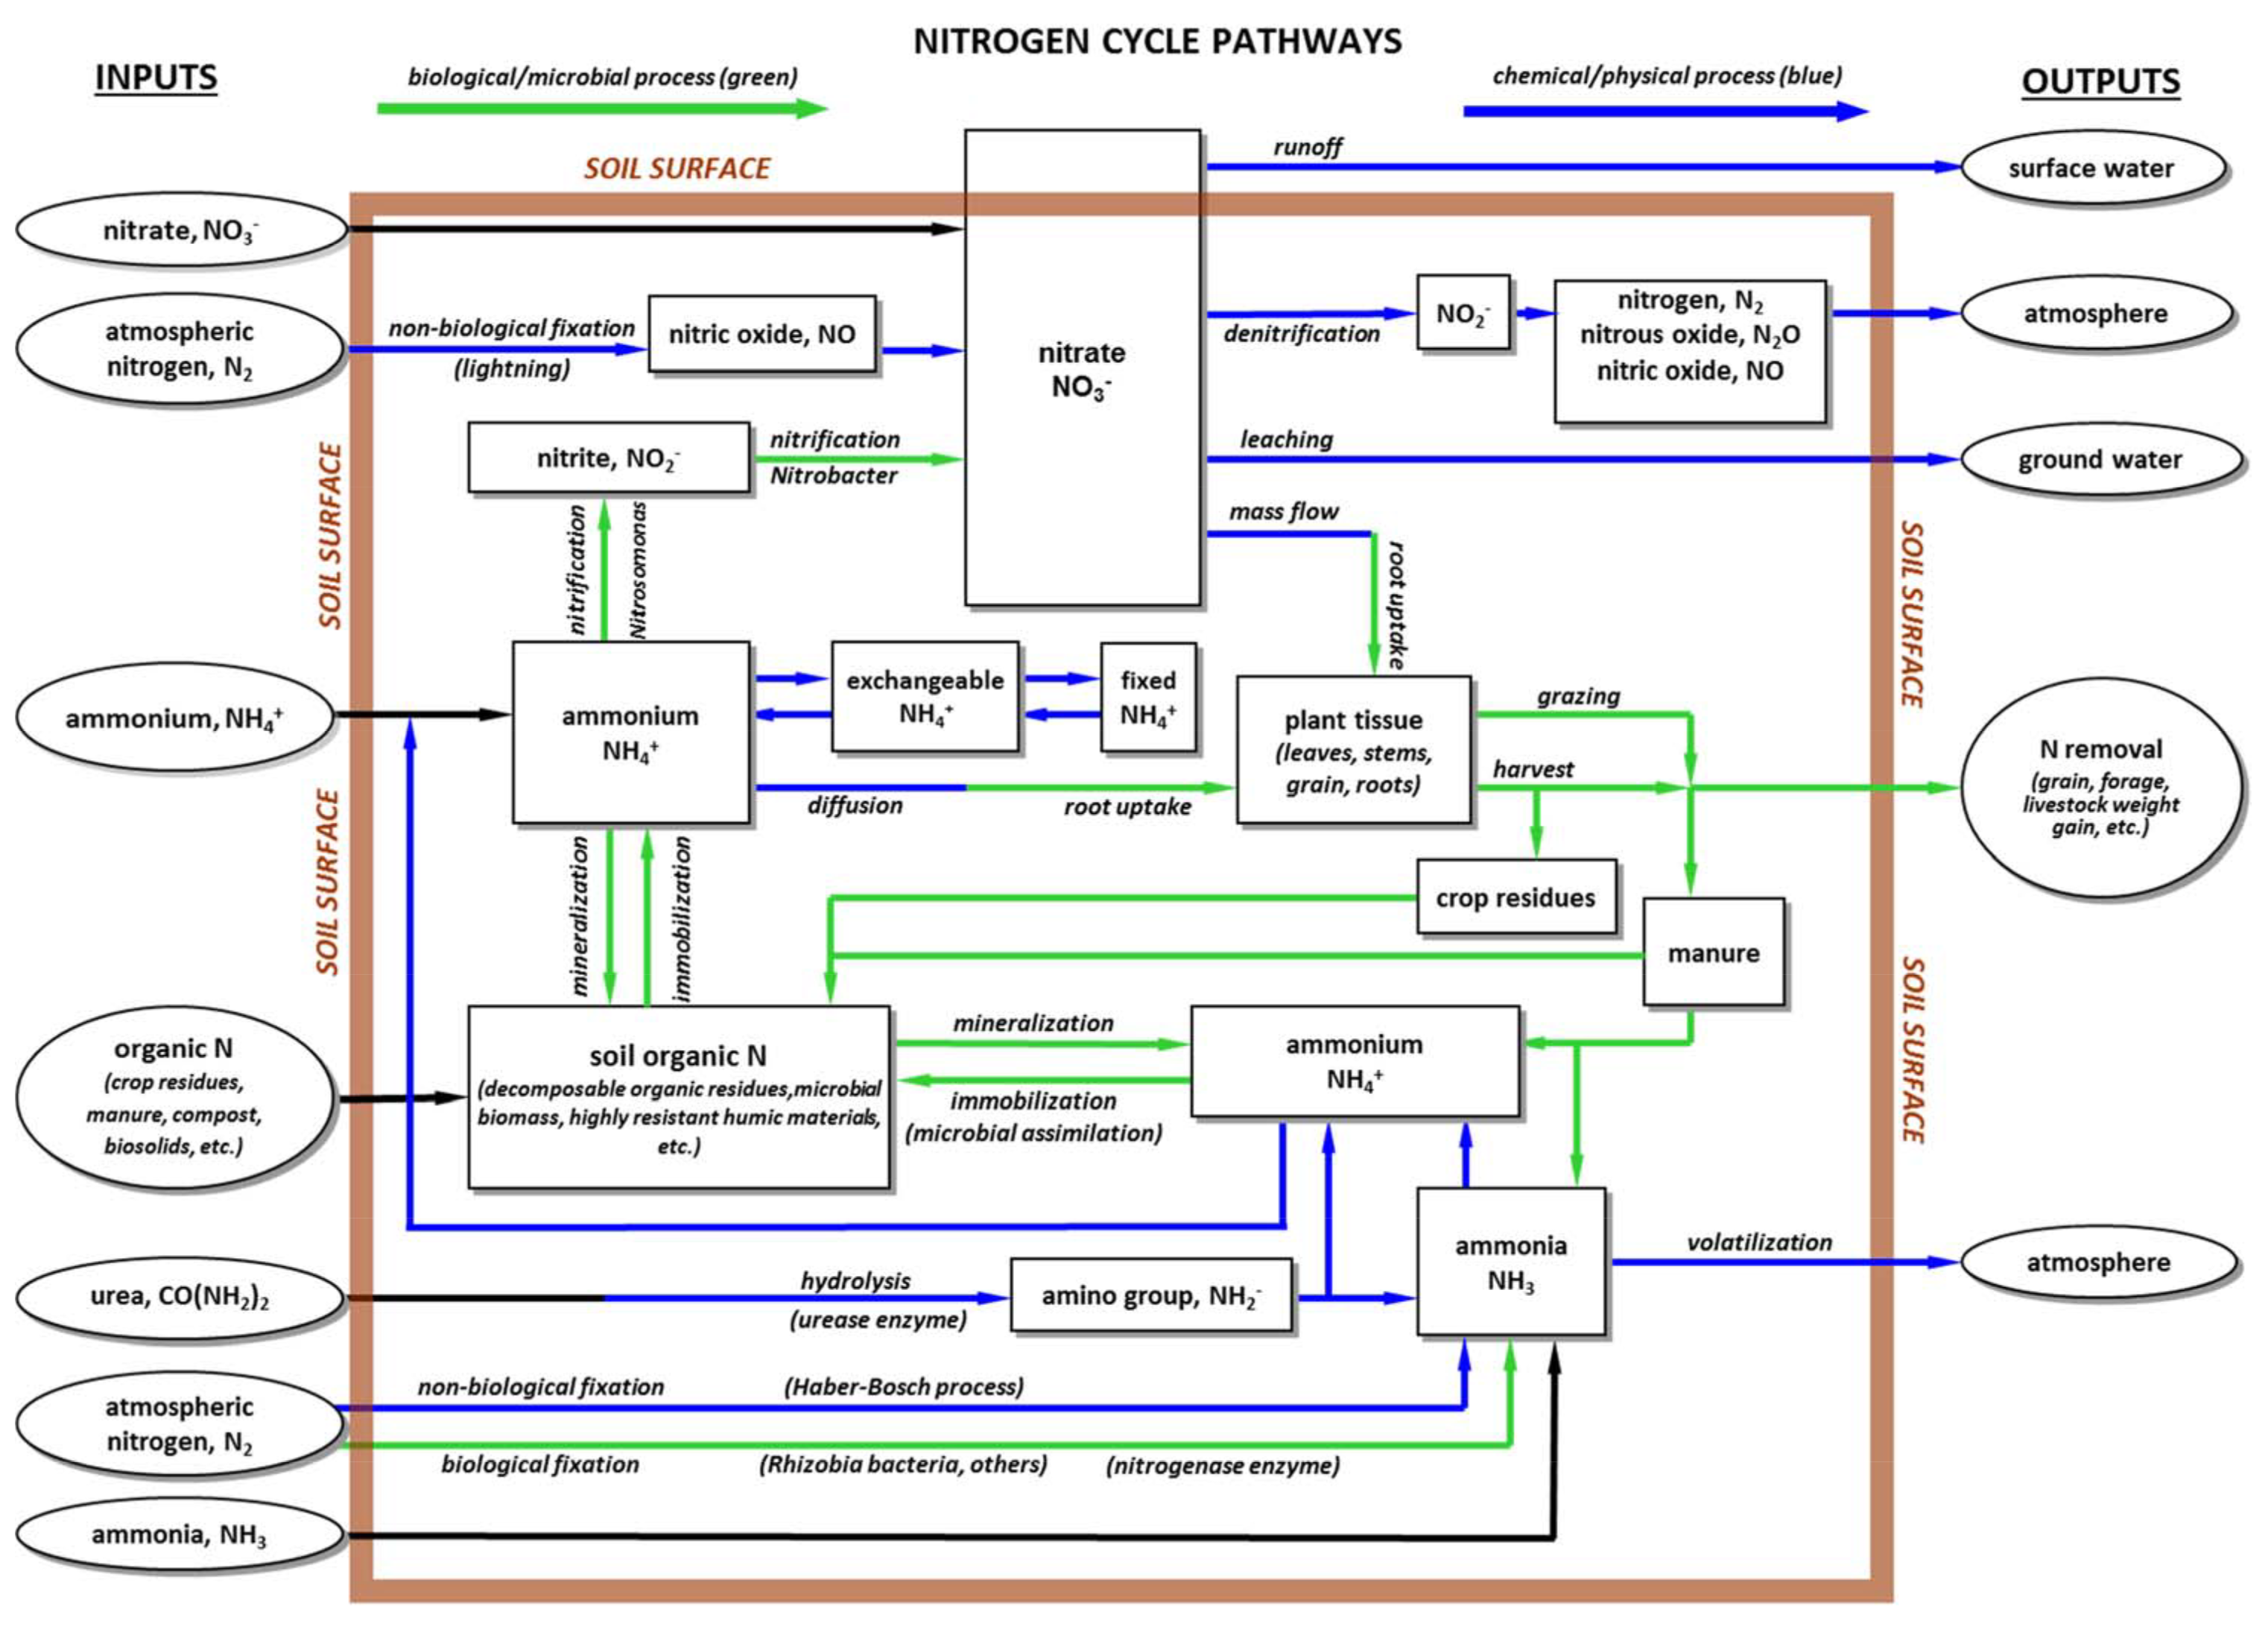
A single nitrogen atom undergoes many transformations and reactions as it cycles through the environment. The schematic diagram on the next page illustrates many of the potential pathways that make up what we call the “nitrogen cycle”.
¶ Nitrogen transformations
The nitrogen transformations of primary interest in managing agronomic and horticultural crops are:
Mineralization: release of organic nitrogen as plant available NH4 –N;
Immobilization: uptake of inorganic nitrogen from the soil and incorporation into organic nitrogen forms by microbes;
Nitrification: conversion (biological oxidation) of NH4+ to NO3-;
Denitrification: conversion of NO3- in soil solution to gaseous N2 and N2O;
Volatilization: gaseous losses of NH3 from organic materials, ammonium-based fertilizers, or urea; and
Nitrogen fixation: conversion of atmospheric N2 into plant-available forms
These transformations occur in the soil and are individually affected by different process and properties that are fall into chemical, biological, and physical categories. The following three factors are the primary drivers of the primary nitrogen transformations.
- Temperature (of the air and/or soil)
- Moisture (soil water and air content), and
- Soil pH (acidity/alkalinity of the soil water).
Details of the transformations and how they can be affected are discussed in other Crop Files. The schematic diagram is intended to illustrate just how the processes can be interconnected in the soil environment.
¶ Diagram details
The rectangle outlined by the brown-colored line represents the soil system, including the soil environment and the soil itself. The inputs and outputs that we are able to measure are shown outside of the soil rectangle. The various processes that make up the nitrogen cycle are shown inside of the soil system rectangle.
Individual processes in the nitrogen cycle are represented by the labeled arrows. Arrows represent the direction that an individual nitrogen atom might follow as it enters the nitrogen cycle as an input and moves through the cycle to one of the outputs.
Green arrows represent processes that are biological or microbial in nature. Blue arrows represent processes that are chemical or physical in nature. Black arrows simply represent movement of inputs into or out of the soil system.
The forms of nitrogen that can be input into the nitrogen cycle are to the left. They are:
- Nitrate, NO3;
- Ammonium, NH4;
- Ammonia, NH3;
- Urea, CO(NH2)2;
- Atmospheric nitrogen, N2; and
- Organic nitrogen (including crop residues, manure, compost, biosolids, etc.).
The right side of the diagram has the most common locations where the potentially measurable outputs of the nitrogen cycle may be found. They include the
- Earth’s atmosphere,
- Surface water,
- Ground water,
- Nitrogen in the harvested grain,
- Nitrogen in the harvested and grazed forage, and
- Nitrogen in the bodies of the animals that consume the forage or grain.
The organic nitrogen content of plant tissues used as feedstuffs or body tissues of livestock animals can be expressed as “crude protein”. We report percent crude protein (% C.P.) by multiplying the total nitrogen percentage by a factor of “6.25”. For example a total nitrogen content of 1.6% N would be reported as 10% crude protein (1.6% x 6.25 = 10.0%)
Keep in mind that several of the nitrogen cycle processes can be operating simultaneously in the soil at any given moment. One of these processes may largely dominate the system due to the particular combination of temperature, moisture, and soil pH. Even though the other processes are active, the activity may be at very low levels and will not be apparent from the final soil system outputs.
For example, mineralization, nitrification, and denitrification may all be occurring in a warm, moist, and generally well-aerated soil. The mineralization and nitrification processes would produce relatively large amounts of nitrate. Denitrification may be occurring in very small and limited zones in the soil where oxygen is limiting. A very small amount of nitrate might be lost by denitrification, but the net effect of all the processes would be a measurable increase in soil nitrate.
¶ Figure 1. Nitrogen Cycle Pathways