⇦ Back to Soil Fertility and Plant Nutrition Home
¶ Introduction
This Crop File discusses various factors that can affect the cation exchange capacity (CEC) or anion exchange capacity (AEC) of a particular soil. These factors include clay content, clay type, organic matter, cation characteristics, solution composition, and soil pH. Other Crop Files in this series have additional information on this topic.[1]
¶ A. Sources of CEC
- Clay particles
- Sands, silts, and clays formed from weathered rocks.
- Larger particles gradually weathered and broken down into smaller particles.
- Smaller particles have greater surface area.
- Smaller particle edges are ragged or imperfect.
- Negative charges develop from broken chemical bonds as particles are broken apart.
- Charges develop on particle surfaces and edges.
- Serve as cation exchange sites.
- Soil organic matter (SOM)
- SOM formed after decomposition and weathering of plant materials.
- Plant materials are primarily cellulose and hemicellulose.
- Decomposed materials used to synthesize humus and humic compounds.
- “Humification” process converts cellulose and hemicellulose-type materials to lignin-type materials and complex proteins.
- Results in large, complex, very stable organic compounds (i.e., humus, humic materials).
- Humification alters chemical composition and produces numerous potential cation exchange sites.
- SOM has particular affinity to adsorb herbicides due to high CEC.
- Herbicide rates usually higher on soils with higher organic matter levels and greater clay content.
- Soil applied herbicide will have adjusted rates in product label.
- SOM formed after decomposition and weathering of plant materials.
- CEC does not change readily.
- Final result of climate and weathering ultimately affects soil exchange capacity.
- Weathering of mineral and organic parent materials determines texture, clay mineral type, organic matter content, and soil pH.
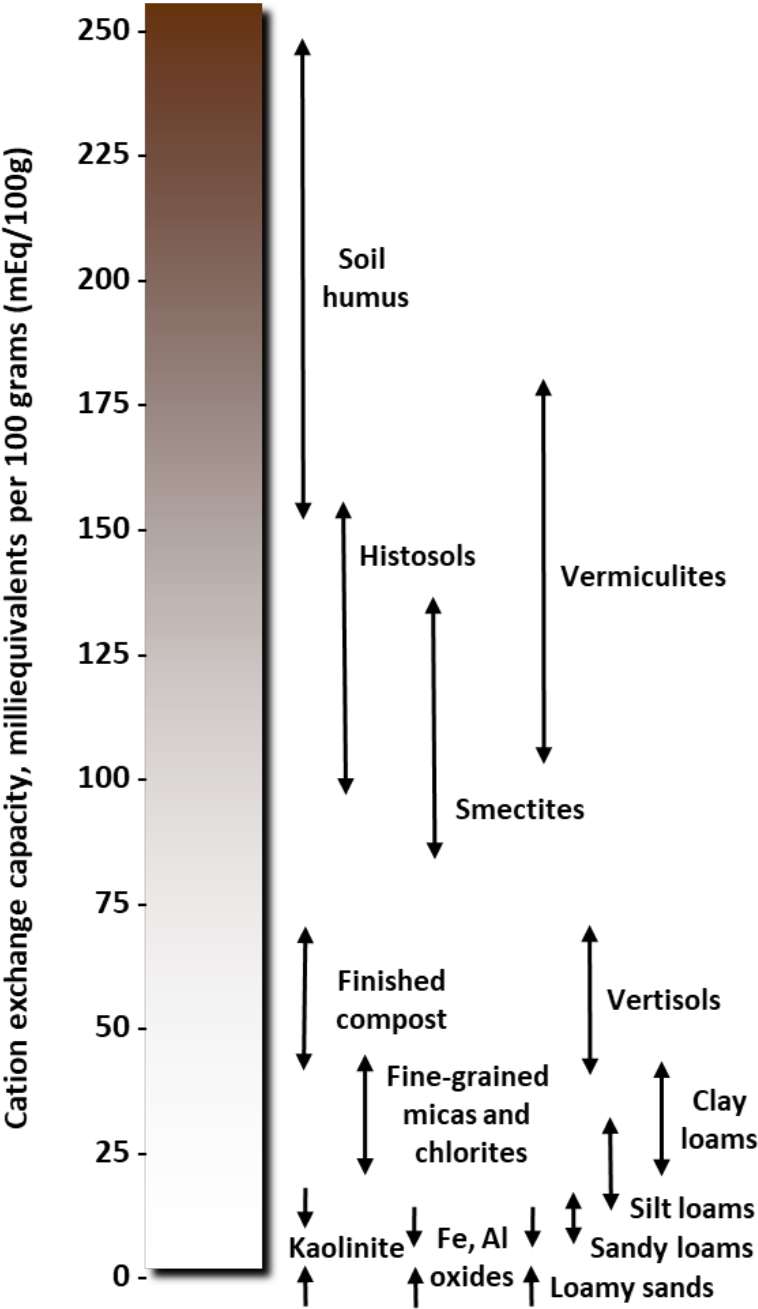
¶ Table 1. Typical range of CEC values for: |
|
|---|---|
| Soil materials (meq/100g): | |
| sand | 1 – 2 |
| silt | 4 – 10 |
| clays | |
| kaolinite | 3 – 15 |
| Illite, mica | 15 – 40 |
| chlorite | 20 – 40 |
| montmorillonite, smectite | 80 – 120 |
| vermiculite | 120 – 150 |
| soil organic matter | 150 – 400 |
| Textures (mEq/100g soil): | |
| sands | 3 – 5 |
| loamy sand | 4 – 8 |
| sandy loams | 6 –12 |
| loams | 15 – 20 |
| silt loams | 15 – 25 |
| clay loams | 15 – 25 |
| sandy clays | 15 – 30 |
| sandy clay loams | 15 – 30 |
| silty clay loams | 20 – 35 |
| clays | 25 – 50 |
| organic soils, mucks ((OM > 20%) | 50 – 100 |
| Plant roots (mEq/100 g of dry tissue): | |
| wheat | 23 |
| corn | 29 |
| bean | 54 |
| tomato | 62 |
¶ B. Clay content (soil texture)
- Soils with higher clay content have higher CEC (see Table 1 and Figure 1).
- Clay particles have high negative charge.
- Is due to many broken edges and large surface area.
- Clay particles have diameter of 2 microns (0.002 mm) or smaller[2].
- Are over 90 billion clay particles per gram.
- Have surface area of 8,611 square feet per gram.
- Clay particles have high negative charge.
- Sandy soils have lower CEC.
- Sand particles are larger with fewer negative charges.
- Fewer broken edges and small surface area.
- Range of sand particle diameter from 50 to 2,000 microns (0.05 to 2.00 mm).
- Are 90 to 722,000 sand particles per gram.Have surface area ranging from 2 to 35 square inches per gram.
- Sand particles are larger with fewer negative charges.
¶ C. Clay type and mineralogy
- Clay content is major factor determining CEC, but clay mineralogy has important role.
- Clay particles consist of sheets of atoms consisting of silicon, aluminum, potassium, etc.
- Arrangement of atomic sheets affects clay characteristics.
- Chemical conditions present when clay was crystallizing determines amount of negative charge locked in particles.
- Isomorphous substitution: cation replacement in minerals during mineral formation affects negative charges.
- Clay particles consist of sheets of atoms consisting of silicon, aluminum, potassium, etc.
- Particles have both external and internal surfaces
- Internal layers are two planes of atoms.
- Layer on “bottom” side and layer on “top” side of each clay sheet.
- External surfaces are outside surfaces and edges of the clay sheet
- Both external and internal surfaces generally have negative charges and retain cations.
- Internal layers are two planes of atoms.
- Clay minerals have different characteristics and different cation exchange capacities (see Table 1, Figures 1 and 3).
- Kaolinite; 1:1 non-swelling clay
- Vermiculite; 2:1 moderately swelling clay
- Can store or “fix” potassium ions in interlayer surfaces
- Illite, mica; 2:1 non-swelling clay
- Montmorillonite, smectite; 2:1 high swelling clay
- Chlorite; 2:1 non-swelling clay
¶ Figure 1. Range of Cation Exchange Capacity (CEC)
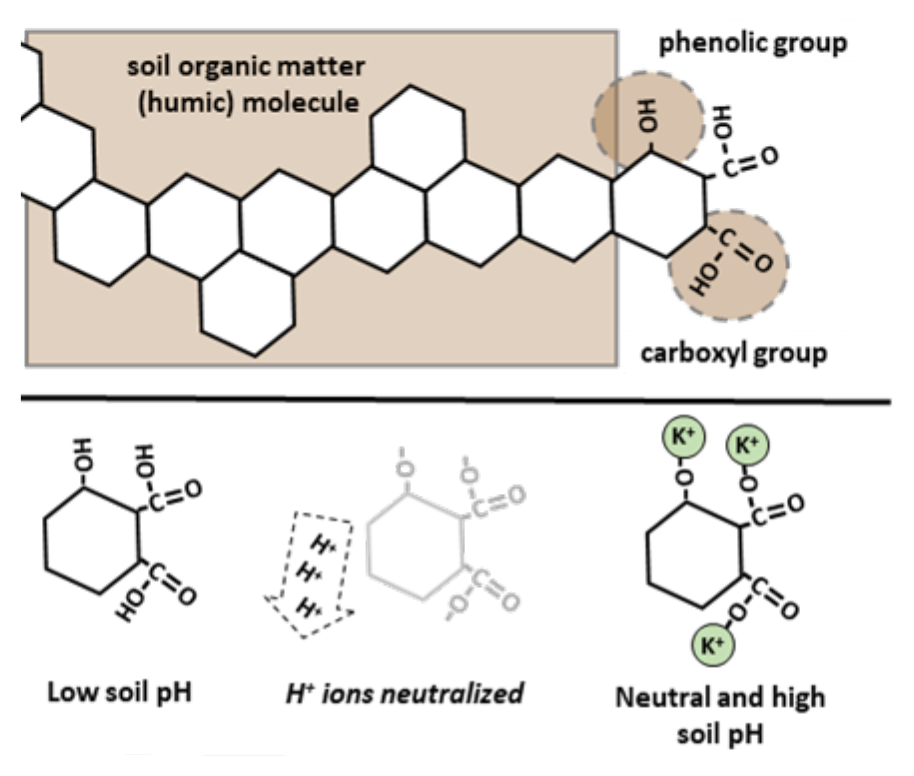
¶ Figure 2. Phenolic and Carboxylic Functional Groups
¶ D. Organic matter, roots
- CEC of organic matter depends on soil conditions.
- Soil OM has CEC typically ranging from 150 to 400 mEq/100g.
- OM has no permanent negative charge.
- During humification, lignin is chemically altered.
- Result is increase of phenolic and carboxyl groups in resulting humus molecules.
- Up to 90% of OM cation exchange sites due to these functional groups.
- Net negative charge is “pH dependent”.
- Hydrogen ions (H+) are stripped from hydroxyls (OH-) as soil pH increases.
- Hydroxyls are component of phenolic and carboxyl groups.
- Removing hydrogen ions leave negative charges (-O-) that can retain cations (see Figure 2).
- Organic matter CEC increases as pH increases.
- Averages from Wisconsin study with 60 soils.
- At pH 2.5
- CEC = 36 mEq/100g, 19% of CEC from SOM
- At pH 8.0
- CEC = 215 mEq/100g, 45% of CEC from SOM
- At pH 2.5
- Hydrogen ions (H+) are stripped from hydroxyls (OH-) as soil pH increases.
- Root surfaces have cation exchange sites.
- Root CEC mainly from carboxyl groups.
- Account for 70% to 90% of total root CEC.
- Monocotyledons ≈ 10 to 30 mEq/100g
- Monocots tend to absorb monovalent cations (e.g., K+) preferentially over divalent cations.
- Dicotyledon roots ≈ 40 to 100 mEq/100g
- Dicots tend to absorb divalent cations (e.g., Ca2+) preferentially over monovalent cations.
- Root CEC mainly from carboxyl groups.
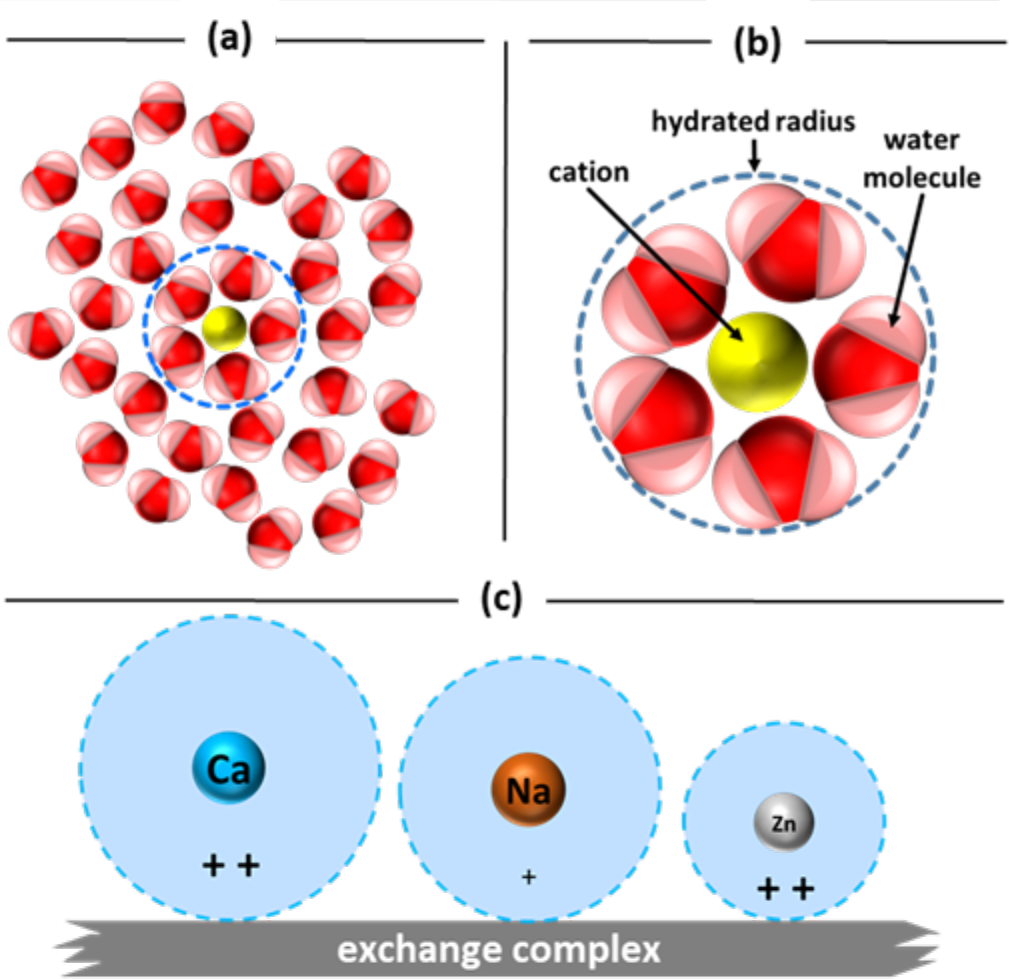
¶ Figure 3. Exchange Complex
¶ E. Cation valence, hydrated radius
- Cations adsorbed onto colloids can be replaced by other, competing cations.
- Cations maintain state of equilibrium between solution and exchange surfaces.
- Cations on exchange complex (sum of exchange surface charges) reflect soil solution composition.
- Cation valence affects ability to exchange.
- Valence: Number representing ability of atom or group of atoms to combine with other atoms or groups of atoms.
- Valence of common soil cations ranges from +1 to +3.
- Highly charged cations (higher valence) tend to be held more tightly than cations with less charge (lower valence).
- Valence: Number representing ability of atom or group of atoms to combine with other atoms or groups of atoms.
- Hydrated radius size affects ability to exchange.
- Ions in water attract water molecules because of their charge (see Figure 3a).
- Ion become “hydrated” as whole water molecules bond to it forming spherical shell.
- Hydrated radius: radius of actual ion and closely bound water molecules (see Figure 3b).
- Ionic radius: term used to describe size of ion.
- Hydrated radius is larger than ionic radius, but size of hydrated radius varies between cations.
- Cations with a small hydrated radius are bound more tightly to exchange complex.
- Are less likely to be removed from exchange complex than cations with large radius.
- Ions in water attract water molecules because of their charge (see Figure 3a).
- Monovalent cations are not necessarily easier to displace then divalent cations.
- Combined influence of cation charge and hydrated cation size affect equilibrium of exchange reactions.
- This influence can be summarized generally by “lysotropic series”.
- Relative strength of adsorption:
- Combined influence of cation charge and hydrated cation size affect equilibrium of exchange reactions.
Al3+ > H+ > Ca2+ > Mg2+ > K+ = NH4+ > Na+
- Adsorption strength decreases from left to right.
- Cations with greater charge are more strongly adsorbed.
- Hydrogen is unique because of size and charge density.
- Smaller hydration radius size decreases distance between ion and exchange surface (see Figure 3c).
- Adsorption strength increases.
- More tightly held cations are located closest to colloid surface.
- Less likely to be leached away or be moved further downward through soil profile.
- Smaller hydration radius size decreases distance between ion and exchange surface (see Figure 3c).
- Hydrogen is unique because of size and charge density.
¶ F. Concentration in soil solution
- Proportion and kinds of cations adsorbed on exchange sites is function of cation concentration in soil solution.
- Large quantity of one cation in solution can displace different cations from surface exchange sites.
- If cation concentration in solution is high, there is increased chance or tendency for that cation to be adsorbed.
- Soil-solution system equilibrium changes if soil solution composition changes.
- System will adapt to develop new equilibrium between soil solution and exchange complex.
- Altering equilibrium is management strategy used in soil remediation.
- Sodic soil: sodium ions occupy 15% or more of exchange sites.
- Solution Na+ ions supplied from irrigation water or very shallow ground water with elevated sodium content.
- Results in high proportion of adsorbed Na+ ions relative to adsorbed Ca2+ ions.
- Large amounts of gypsum (Ca2SO4) are applied to remedy sodic soil condition.
- Gypsum gradually dissolves in soil solution, providing source of Ca2+ ions.
- Results in high concentration of solution Ca2+ ions relative to solution Na+ ions.
- Solution Ca2+ ions begin to exchange with adsorbed Na+ ions to restore equilibrium between soil solution and soil exchange sites.
- Displaced Na+ ions in solution are removed by leaching (“rinsing”) of soil solution with low sodium water.
- Reduces concentration of Na+ ions relative to Ca2+ ions in soil solution.
- Eventually results in establishing new equilibrium between soil solution and exchange complex.
- Soil gradually becomes non-sodic.
- Excess gypsum or excess limestone may inflate summation CEC value beyond normal range for soil texture.
- Routine soil analysis with ammonium acetate or Mehlich extractant uses NH4+ ion to replace adsorbed cations in soil sample.
- Soil filtrate is analyzed to determine exchangeable cation concentrations.
- Extractant can dissolved solid minerals (lime, gypsum, etc.) from soil sample.
- Dissolved mineral cations in filtrate are included with exchangeable cations.
- Excess cation inflates calculated value for CEC by summation.
- AGVISE Laboratories experiment
- Applied gypsum at rates from 300, to 36,000 lb/ac.
- Essentially no change in K, Mg, or Na concentrations.
- Calcium concentration increased from 2460 ppm Ca to 6000 ppm Ca.
- No change in soil texture or number of exchange sites.
- Resulted in summation CEC increasing from 17 mEq/100g (0 gypsum) to 35 mEq/100g (36,000 lb/ac).
¶ Table 2. Effect of Gypsum on Soil Test Levels and Summation CEC.
|
||||||
|---|---|---|---|---|---|---|
| Gypsum Rate, lb/ac |
pH | Soluble Salts, mmho/cm |
Ca ppm | Mg ppm | K ppm | Na ppm |
| 0 | 7.50 | 0.24 | 2460 | 390 | 551 | 20 |
| 300 | 7.53 | 0.32 | 2570 | 400 | 573 | 20 |
| 6,000 | 7.30 | 0.92 | 3040 | 390 | 557 | 20 |
| 18,000 | 7.30 | 1.17 | 4290 | 400 | 563 | 25 |
| 36,000 | 7.37 | 1.31 | 6000 | 440 | 550 | 20 |
| Gypsum Rate, lb/ac |
CEC, mEq/100g |
Ca % | Mg % | K % | Na % | |
| 0 | 17 ⇩ | 73 | 19 | 8 | 0 | |
| 300 | 18 ⇩ | 73 | 19 | 8 | 0 | |
| 6,000 | 20 ⇩ | 77 | 16 | 7 | 0 | |
| 18,000 | 26 ⇩ | 82 | 13 | 6 | 0 | |
| 36,000 | 35 | 86 | 11 | 4 | 0 | |
¶ G. Soil pH
- CEC provided by OM entirely determined by soil pH.
- OM loses ability to hold cations as soil becomes more acidic.
- Clay has pH dependent charge, but to lesser degree.
- About 5% to 10% of negative charge for 2:1 clays depends on pH.
- For kaolinite clays, 50% or more of the CEC can be pH dependent.
¶ H. Anion Exchange Capacity (AEC)
- Majority of the world’s soils have cation exchange capacity.
- Less weathered soils under neutral and alkaline conditions have CEC with small amount of AEC,
- Example, at pH 8.2:
- AEC of montmorillonite ≈ 1 mEq/100g, where CEC ≈ 118 mEq/100g.
- AEC of kaolinite clay ≈ 2 mEq/100g, where CEC ≈ 4 mEq/100g.
- Example, at pH 8.2:
- Highly weathered, tropical soils have CEC, but also have anion exchange capacity (AEC).
- 1:1 clays more prone to generate AEC than 2:1 clays.
- Less weathered soils under neutral and alkaline conditions have CEC with small amount of AEC,
- Highly weathered soil generates AEC under acidic conditions.
- Soil becomes positively charged.
- Hydroxyls take on hydrogen ions or become protonated.
- AEC attracts, retains, and supplies negatively charged anions.
- e.g., sulfate (SO42-), phosphate (HPO42- or H2PO4-), nitrate (NO3-), chloride (Cl-)
- Cations are leached from soils with high AEC.
- e.g., calcium (Ca2+), magnesium (Mg2+), ammonium (NH4+), potassium (K+)
- Fertility management needed to prevent cation nutrient deficiencies.
- Soil becomes positively charged.
- Mineral types affect pH at which soils develop AEC.
- Highly weathered kaolinite (1:1 clay)
- AEC may be as high as 43 mEq/100g at pH 4.7.
- Aluminum and iron oxides
- Allophanes and imogolites of volcanic soils.
- Highly weathered kaolinite (1:1 clay)
- Organic matter only generates AEC at very low pH.
- Still good source of CEC.
- Certain soils all have AEC under acidic conditions.
- Highly weathered Ultisols and Oxisols.
- Volcanic Andisols
- Organic Histosols
¶ Figure 4. Scanning Electron Microscope Image of Clay Particles
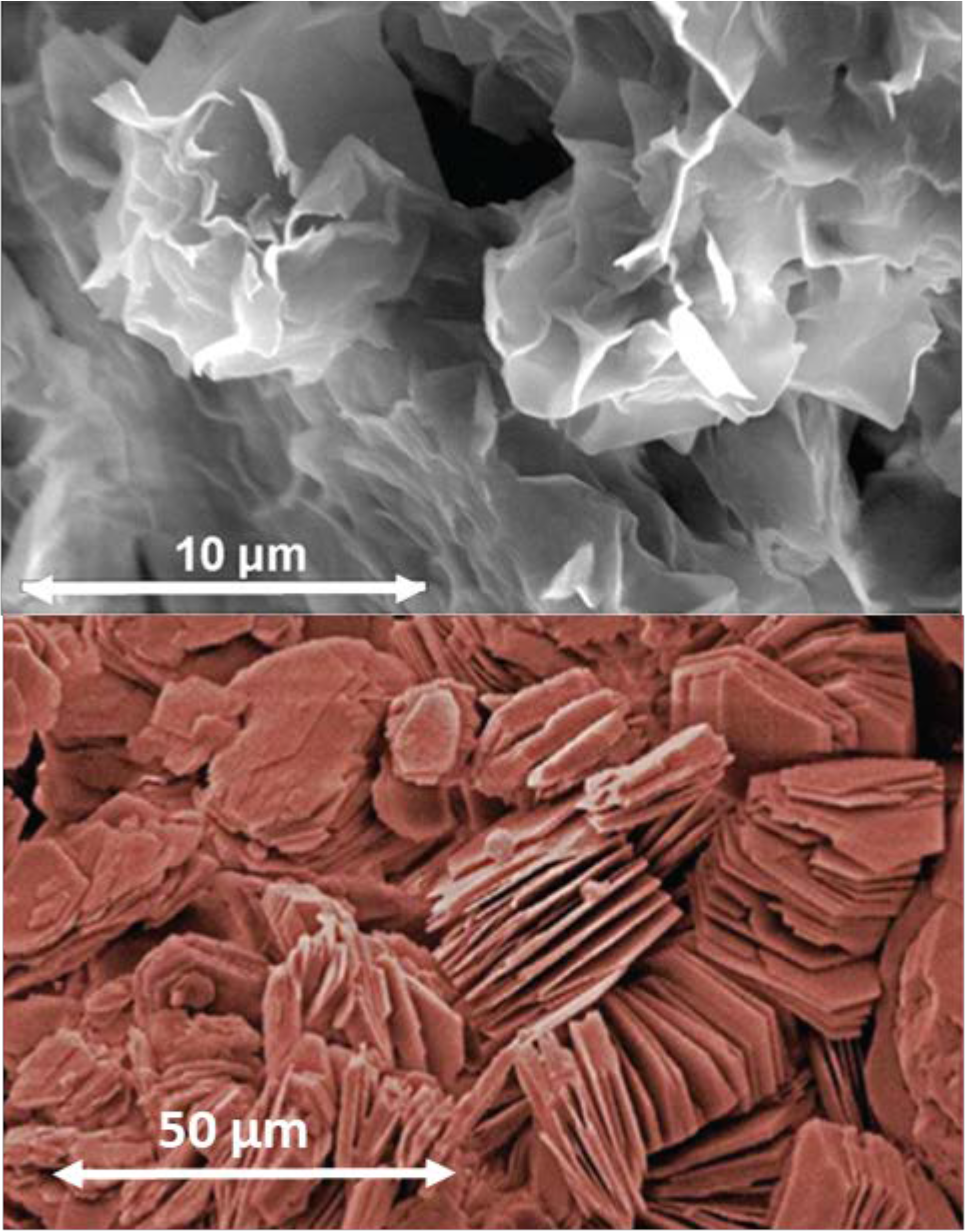
10 um = 1/2500th inch, 50 um 1/500th inch.
¶ References:
Tisdale, S.L., et. al. 1993. "Basic Soil-Plant Relationships" in Soil Fertility and Fertilizers. MacMillan Pub. Co., New York. pp. 80-94.
Mickkelsen, R. 2011. Cation Exchange: A Review. Insights, Nov. 2011. Intl Plant Nutrition Institute, Merced CA. 3 pg.
McClellan, T. Soil Nutrient Management for Maui County: Cation exchange. College of Tropical Agriculture and Human Resources. Univ. of Hawaii. http://www.ctahr.hawaii.edu/mauisoil/c_relationship.aspx accessed 14 June 2016
Sparks, D.L. 2003. Chemistry of Soil Organic Matter in Environmental Soil Chemistry (Second Edition). Pg. 75-113.
Foth, H.D. 1984. “Soil Chemistry” in Fundamentals of Soil Science, 7th ed. John Wiley & Sons, New York. pp. 191-197.
Grain SA . Soil: The Producer’s Most Important Asset, Part 4: The clay minerals. Grain SA, Pretoria South Africa. https://www.grainsa.co.za/soil-the-producers-most-important-asset--part-4-the-clay-minerals accessed 08 Dec 2020.
AGVISE Laboratories. Gypsum Magic: Part 3. Changing Cation Ratios, Soil pH and CEC. https://www.agvise.com/tech_art/gypsum3.php accessed 28 Mar 2008.
¶ Footnotes:
[1] (Refer to Crop File 1.04.133 “Cation-Anion Exchange” and 1.04.130 “Cation Exchange Capacity (CEC) basics” for background information related to this Crop File.)
[2] 1 micron = 0.001 millimeter ≈ 1/25,000th inch