⇦ Back to Soil Fertility and Plant Nutrition Home
¶ Winter wheat (Triticum aestivum)
| Table No: | Growth stage: | Plant part: |
| Table A | Emergence to tillering (Feekes 1 to 4) | Whole plant |
| Table B | Stem extension, jointing (Feekes 5 to 7) | Whole tillers |
| Table C | Pre-boot (Feekes stage 8 to 9) | Whole stems |
| Table D | Pre-boot (Feekes stage 8 to 9) | Flag leaves |
| Table E | Boot to head emergence (Feekes stage 10 to 10.1) | Whole stems |
| Table F | Boot to head emergence (Feekes stage 10 to 10.1) | Flag leaves |
| Table G | Flowering (Feekes stage 10.5.1 to 10.5.4) | Whole stems |
| Table H | Flowering (Feekes stage 10.5.1 to 10.5.4) | Flag leaves |
| Table I | Dough (Feekes stage 11.2) | Whole stems |
| Table J | Dough (Feekes stage 11.2) | Flag leaves |
| Table K | Wheat nutrient uptake: N, P, K |
¶ A: Emergence to tillering (Feekes 1 to 4)
Plant Part: Whole plants
Sampling Procedure: Collect leaves and tillers from 20 to 25 plants, cutting off about ½ inch above ground level. Submit at least a pint of loosely packed tissue (a ball about 4 to 5 inches in diameter) for analysis. Place sample in a paper bag, not a plastic bag, for shipment to the laboratory.
| Analysis | Tissue Concentration Guidelines | ||||||||
| Very Low to Low | Typical Range | High to Very High | |||||||
| Nitrogen, % N | 2.95 | - | 3.60 | 3.60 | - | 4.85 | 4.85 | - | 5.67 |
| Phosphorus, %P | 0.22 | - | 0.26 | 0.26 | - | 0.40 | 0.40 | - | 0.54 |
| Potassium, % K | 2.12 | - | 2.55 | 2.55 | - | 3.55 | 3.55 | - | 4.40 |
| Calcium, % Ca | 0.29 | - | 0.33 | 0.33 | - | 0.48 | 0.48 | - | 0.65 |
| Magnesium, % Mg | 0.11 | - | 0.13 | 0.13 | - | 0.19 | 0.19 | - | 0.26 |
| Sulfur, % S | 0.22 | - | 0.25 | 0.25 | - | 0.35 | 0.35 | - | 0.43 |
| Zinc, ppm Zn | 16 | - | 20 | 20 | - | 30 | 30 | - | 45 |
| Iron, ppm Fe | 140 | - | 205 | 205 | - | 565 | 575 | - | 1320 |
| Manganese, ppm Mn | 58 | - | 80 | 80 | - | 155 | 155 | - | 235 |
| Copper ppm Cu | 5 | - | 6 | 6 | - | 9 | 9 | - | 13 |
| Boron, ppm B | 3 | - | 4 | 4 | - | 7 | 7 | - | 13 |
| Nitrogen-to-sulfur ratio (N:S) | 12 | - | 13 | 13 | - | 15 | 15 | - | 16 |
| Sodium, % Na | less than 0.01 | 0.01 | - | 0.02 | 0.03 | - | 0.07 | ||
| Chloride, % Cl | - | - | - | ||||||
¶ Figure A. Growth Stage: Feekes 2 - Tillering Begins
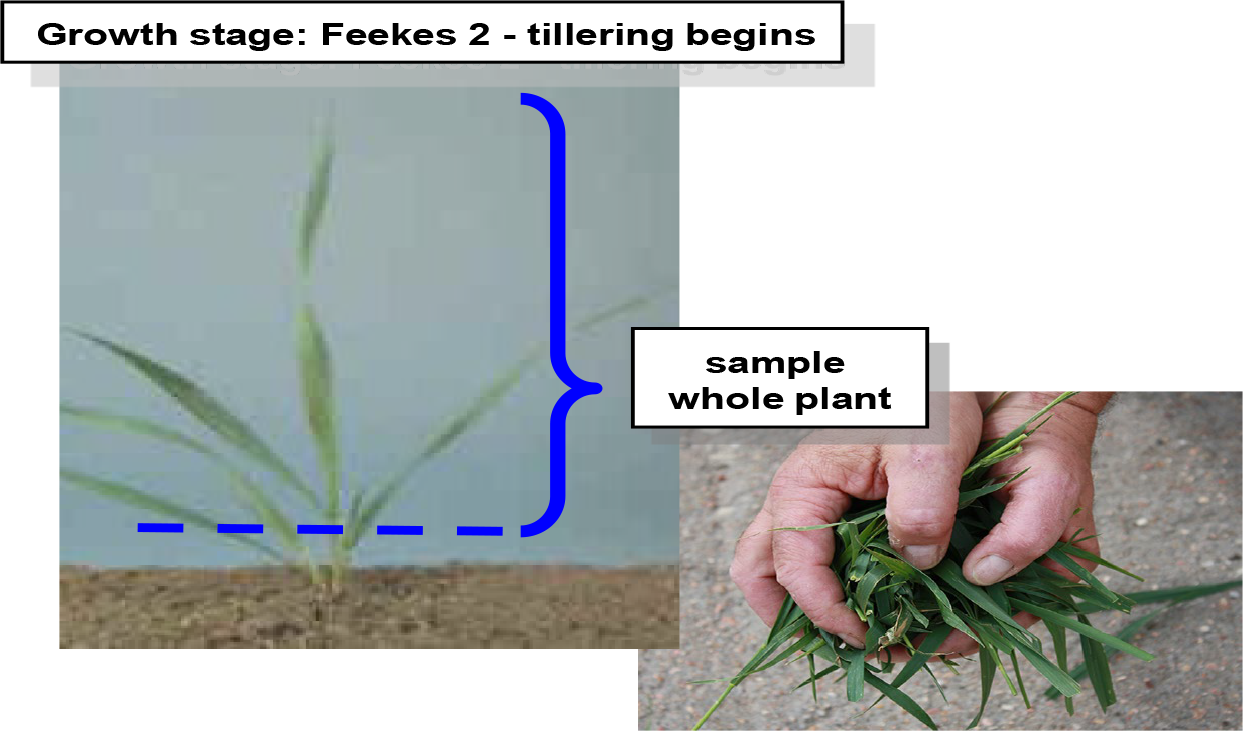
¶ Feekes growth stage 1 - 4 (Zadoks scale: 10 - 30)
- 1 - One shoot (number of leaves can be added) = "brairding"
- 2 - Beginning of tillering
- 3 - Tillers formed, leaves often twisted spirally. In some varieties of winter wheats, plants may be "creeping" or prostrate
- 4 - Beginning of the erection of the pseudo-stem, leaf sheaths beginning to lengthen
¶ B: Jointing or stem extension (Feekes 5 to 7)
Plant Part: Whole tillers
Sampling Procedure: Collect 30 to 40 tillers, cutting off about ½ inch above ground level. At least a pint of loosely packed tissue (a ball about 4 to 5 inches in diameter) should be submitted for analysis. Place sample in a paper bag, not a plastic bag, for shipment to the laboratory.
| Analysis | Tissue Concentration Guidelines | ||||||||
| Very Low to Low | Typical Range | High to Very High | |||||||
| Nitrogen, % N | 2.54 | - | 3.15 | 3.15 | - | 4.55 | 4.55 | - | w |
| Phosphorus, %P | 0.22 | - | 0.27 | 0.27 | - | 0.40 | 0.40 | - | 0.55 |
| Potassium, % K | 2.40 | - | 2.79 | 2.80 | - | 3.80 | 3.80 | - | 4.60 |
| Calcium, % Ca | 0.26 | - | 0.30 | 0.30 | - | 0.45 | 0.45 | - | 0.60 |
| Magnesium, % Mg | 0.11 | - | 0.12 | 0.12 | - | 0.18 | 0.18 | - | 0.24 |
| Sulfur, % S | 0.18 | - | 0.24 | 0.24 | - | 0.32 | 0.32 | - | 0.45 |
| Zinc, ppm Zn | 16 | - | 20 | 20 | - | 30 | 30 | - | 50 |
| Iron, ppm Fe | 100 | - | 130 | 130 | - | 300 | 300 | - | 800 |
| Manganese, ppm Mn | 45 | - | 60 | 60 | - | 120 | 120 | - | 190 |
| Copper ppm Cu | 4 | - | 6 | 6 | - | 9 | 9 | - | 13 |
| Boron, ppm B | 3 | - | 4 | 4 | - | 7 | 7 | - | 15 |
| Nitrogen-to-sulfur ratio (N:S) | 11 | - | 13 | 13 | - | 15 | 15 | - | 17 |
| Sodium, % Na | less than 0.01 | 0.01 | - | 0.02 | 0.03 | - | 0.08 | ||
| Chloride, % Cl | - | - | - | ||||||
¶ Figure B. Growth Stage: Feekes 6 - Jointing
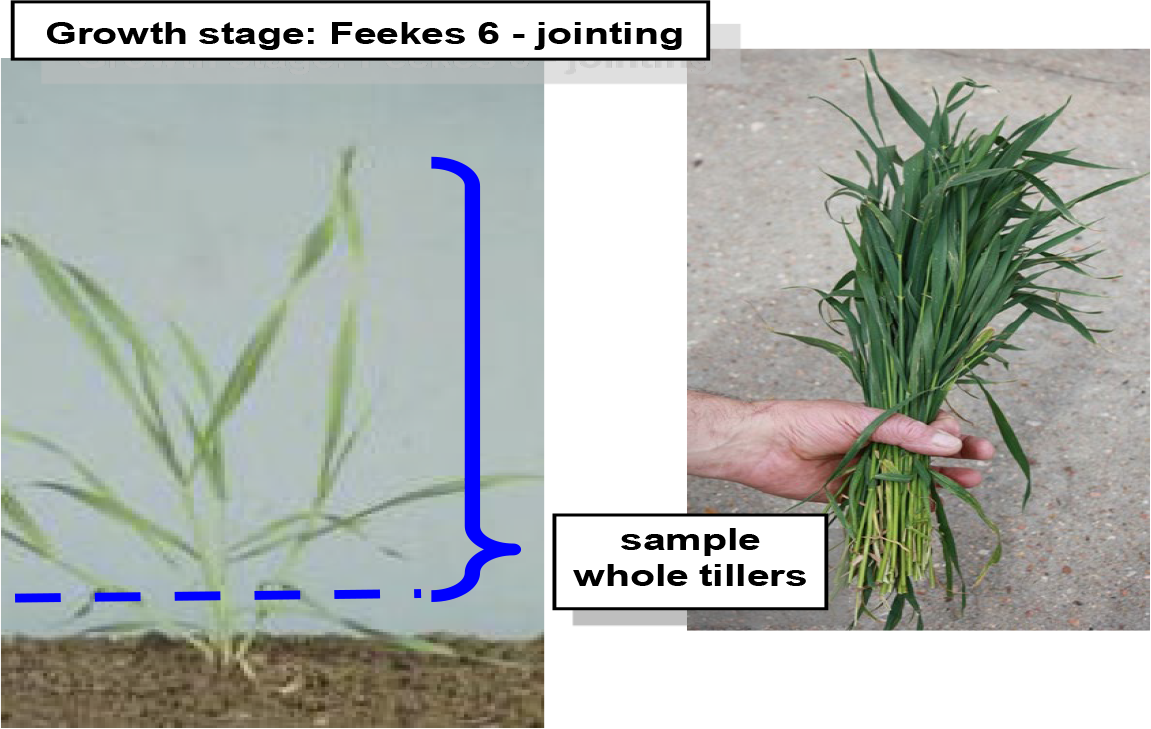
¶ Feekes growth stage 5 - 7 (Zadoks scale: 30 - 32)
- 5 - Pseudo-stem (formed by sheaths of leaves) strongly erected
- 6 - First node of stem visible at base of shoot
- 7 - Second node of stem formed, next-to-last leaf just visible
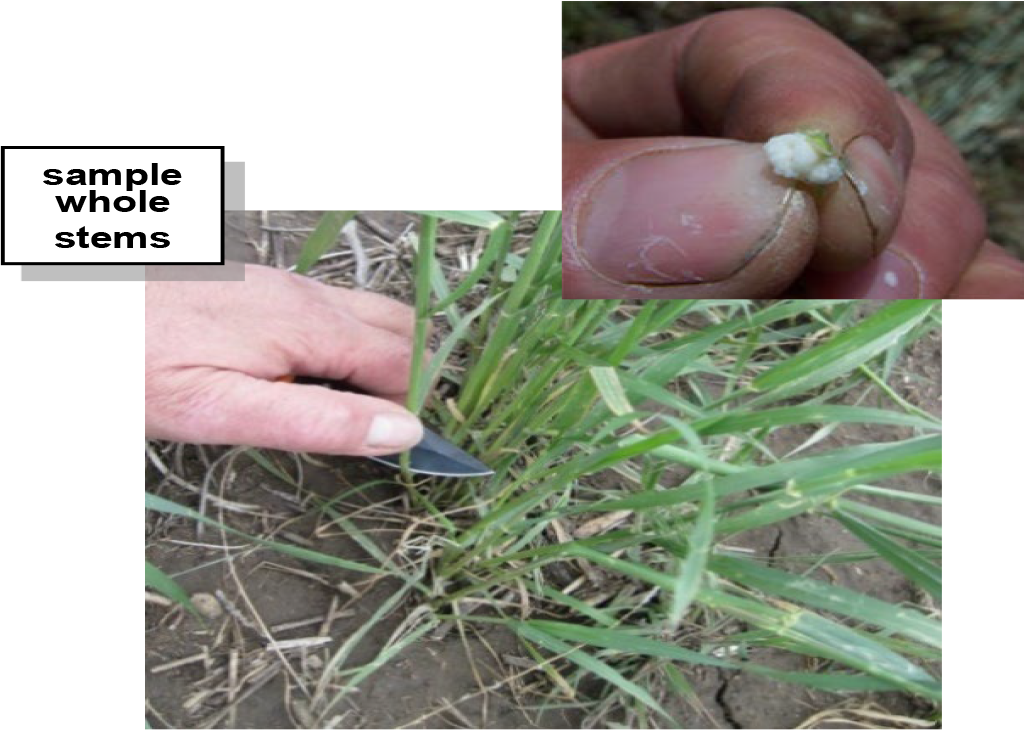
¶ C: Pre-boot (Feekes stage 8 to 9)
Plant Part: Whole stems (tillers)
Sampling Procedure: Collect 25 to 30 whole stems (tillers), cutting off about ½ inch above ground level. At least a pint of loosely packed tissue should be submitted for analysis. Place sample in a paper bag, not a plastic bag, for shipment to the laboratory.
| Analysis | Tissue Concentration Guidelines | ||||||||
| Very Low to Low | Typical Range | High to Very High | |||||||
| Nitrogen, % N | 2.28 | - | 2.85 | 2.85 | - | 4.25 | 4.25 | - | 5.00 |
| Phosphorus, %P | 0.20 | - | 0.25 | 0.25 | - | 0.37 | 0.37 | - | 0.48 |
| Potassium, % K | 2.08 | - | 2.47 | 2.47 | - | 3.55 | 3.55 | - | 4.45 |
| Calcium, % Ca | 0.23 | - | 0.30 | 0.30 | - | 0.40 | 0.40 | - | 0.50 |
| Magnesium, % Mg | 0.11 | - | 0.13 | 0.13 | - | 0.18 | 0.18 | - | 0.23 |
| Sulfur, % S | 0.17 | - | 0.22 | 0.22 | - | 0.33 | 0.33 | - | 0.44 |
| Zinc, ppm Zn | 15 | - | 18 | 18 | - | 30 | 30 | - | 45 |
| Iron, ppm Fe | 80 | - | 100 | 100 | - | 200 | 200 | - | 440 |
| Manganese, ppm Mn | 35 | - | 48 | 48 | - | 90 | 90 | - | 145 |
| Copper ppm Cu | 4 | - | 6 | 6 | - | 9 | 9 | - | 12 |
| Boron, ppm B | 3 | - | 4 | 4 | - | 8 | 8 | - | 16 |
| Nitrogen-to-sulfur ratio (N:S) | 10 | - | 12 | 12 | - | 14 | 14 | - | 16 |
| Sodium, % Na | less than 0.01 | 0.01 | - | 0.02 | 0.02 | - | 0.40 | ||
| Chloride, % Cl | - | - | - | ||||||
¶ Figure C. Sampling Whole Stems
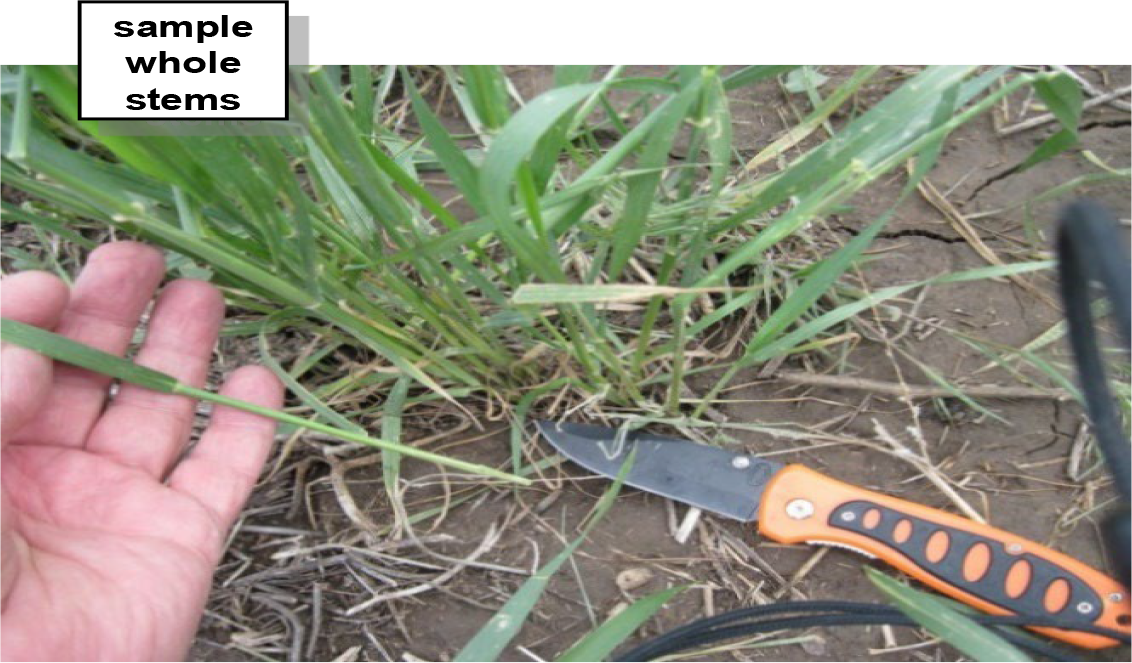
¶ Feekes growth stage 8 - 9 (Zadoks scale: 37 - 39)
- 8 - Last leaf visible, but still rolled up, ear beginning to swell
- 9 - Ligule of last leaf just visible
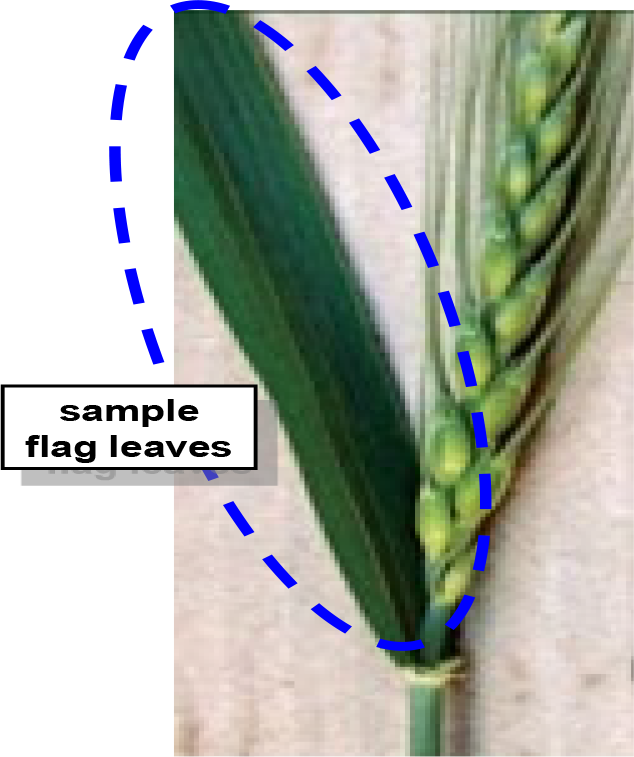
¶ D: Pre-boot (Feekes stage 8 to 9)
Plant Part: Flag leaves
Sampling Procedure: Collect 50 to 70 flag leaves from healthy plants. The final sample should be about the size of a soft-ball (about 4 to 5 inches in diameter). Place sample in a paper bag, not a plastic bag, for shipment to the laboratory.
| Analysis | Tissue Concentration Guidelines | ||||||||
| Very Low to Low | Typical Range | High to Very High | |||||||
| Nitrogen, % N | 3.30 | - | 3.70 | 3.70 | - | 4.60 | 4.60 | - | 5.10 |
| Phosphorus, %P | 0.18 | - | 0.20 | 0.20 | - | 0.27 | 0.27 | - | 0.32 |
| Potassium, % K | 1.65 | - | 1.90 | 1.90 | - | 2.50 | 2.50 | - | 3.40 |
| Calcium, % Ca | 0.27 | - | 0.33 | 0.33 | - | 0.60 | 0.60 | - | 0.75 |
| Magnesium, % Mg | 0.11 | - | 0.12 | 0.12 | - | 0.18 | 0.18 | - | 0.22 |
| Sulfur, % S | 0.22 | - | 0.25 | 0.25 | - | 0.33 | 0.33 | - | 0.40 |
| Zinc, ppm Zn | 13 | - | 16 | 16 | - | 26 | 26 | - | 35 |
| Iron, ppm Fe | 95 | - | 110 | 110 | - | 210 | 90 | - | 175 |
| Manganese, ppm Mn | 40 | - | 45 | 45 | - | 90 | 90 | - | 175 |
| Copper ppm Cu | 5 | - | 6 | 6 | - | 9 | 9 | - | 11 |
| Boron, ppm B | 6 | - | 7 | 7 | - | 17 | 17 | - | 35 |
| Nitrogen-to-sulfur ratio (N:S) | 10 | - | 13 | 13 | - | 15 | 15 | - | 16 |
| Sodium, % Na | less than 0.01 | 0.01 | 0.01 | - | 0.02 | ||||
| Chloride, % Cl | 0.10 | - | 0.12 | ||||||
¶ Figure D. Growth Stage: Feekes 10.1 - Head Emergence
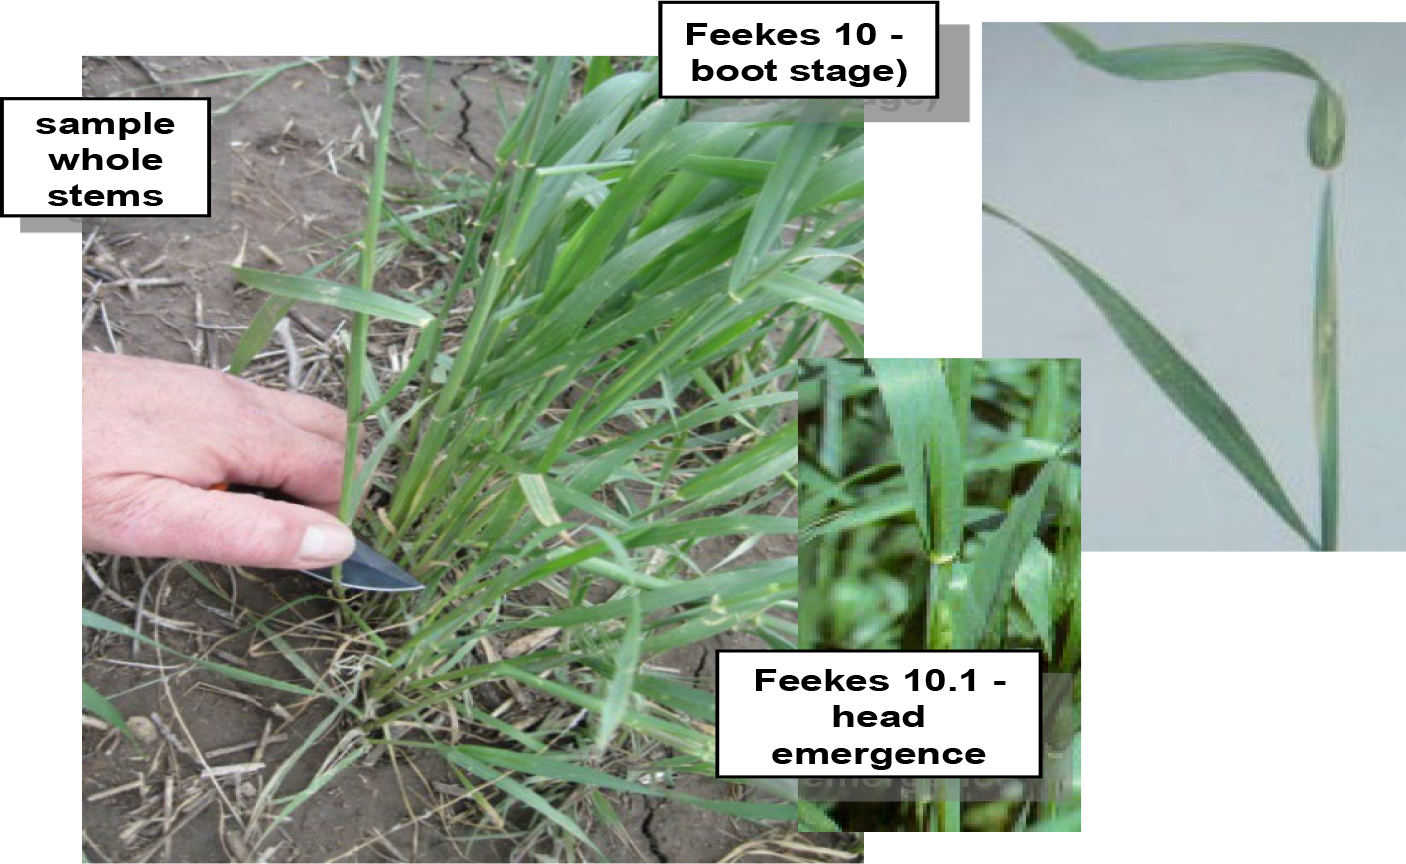
¶ Feekes growth stage 10 - 10.5 (Zadoks scale: 45 - 59)
- 10 - Boot stage; sheath of last leaf completely grown out, head swollen but not yet visible
- 10.1 - Awns visible, heads emerging through slit of flag leaf sheath
- 10.2 - Heading 1/4th complete
- 10.3 - Heading 1/2 complete
- 10.4 - Heading 3/4th complete
- 10.5 - Heading complete
¶ E: Boot to head emergence (Feekes stage 10 to 10.1)
Plant Part: Whole stems
Sampling Procedure: Collect 25 to 30 whole stems (tillers), cutting off about ½ inch above ground level. At least a pint of loosely packed tissue should be submitted for analysis. Place sample in a paper bag, not a plastic bag, for shipment to the laboratory.
| Analysis | Tissue Concentration Guidelines | ||||||||
| Very Low to Low | Typical Range | High to Very High | |||||||
| Nitrogen, % N | 1.63 | - | 2.00 | 2.00 | - | 3.35 | 3.35 | - | 4.45 |
| Phosphorus, %P | 0.17 | - | 0.21 | 0.21 | - | 0.30 | 0.30 | - | 0.40 |
| Potassium, % K | 1.60 | - | 1.85 | 1.85 | - | 2.80 | 2.80 | - | 3.70 |
| Calcium, % Ca | 0.15 | - | 0.20 | 0.20 | - | 0.35 | 0.35 | - | 0.55 |
| Magnesium, % Mg | 0.09 | - | 0.11 | 0.11 | - | 0.16 | 0.16 | - | 0.21 |
| Sulfur, % S | 0.12 | - | 0.15 | 0.15 | - | 0.25 | 0.25 | - | 0.35 |
| Zinc, ppm Zn | 12 | - | 15 | 15 | - | 25 | 25 | - | 35 |
| Iron, ppm Fe | 65 | - | 80 | 80 | - | 145 | 145 | - | 325 |
| Manganese, ppm Mn | 34 | - | 40 | 40 | - | 80 | 80 | - | 120 |
| Copper ppm Cu | 4 | - | 5 | 5 | - | 8 | 8 | - | 10 |
| Boron, ppm B | 3 | - | 4 | 4 | - | 7 | 7 | - | 15 |
| Nitrogen-to-sulfur ratio (N:S) | 10 | - | 12 | 12 | - | 14 | 14 | - | 16 |
| Sodium, % Na | less than 0.01 | 0.01 | 0.01 | - | 0.07 | ||||
| Chloride, % Cl | - | - | - | ||||||
¶ Figure E. Growth Stage: Feekes 10 - Boot Stage
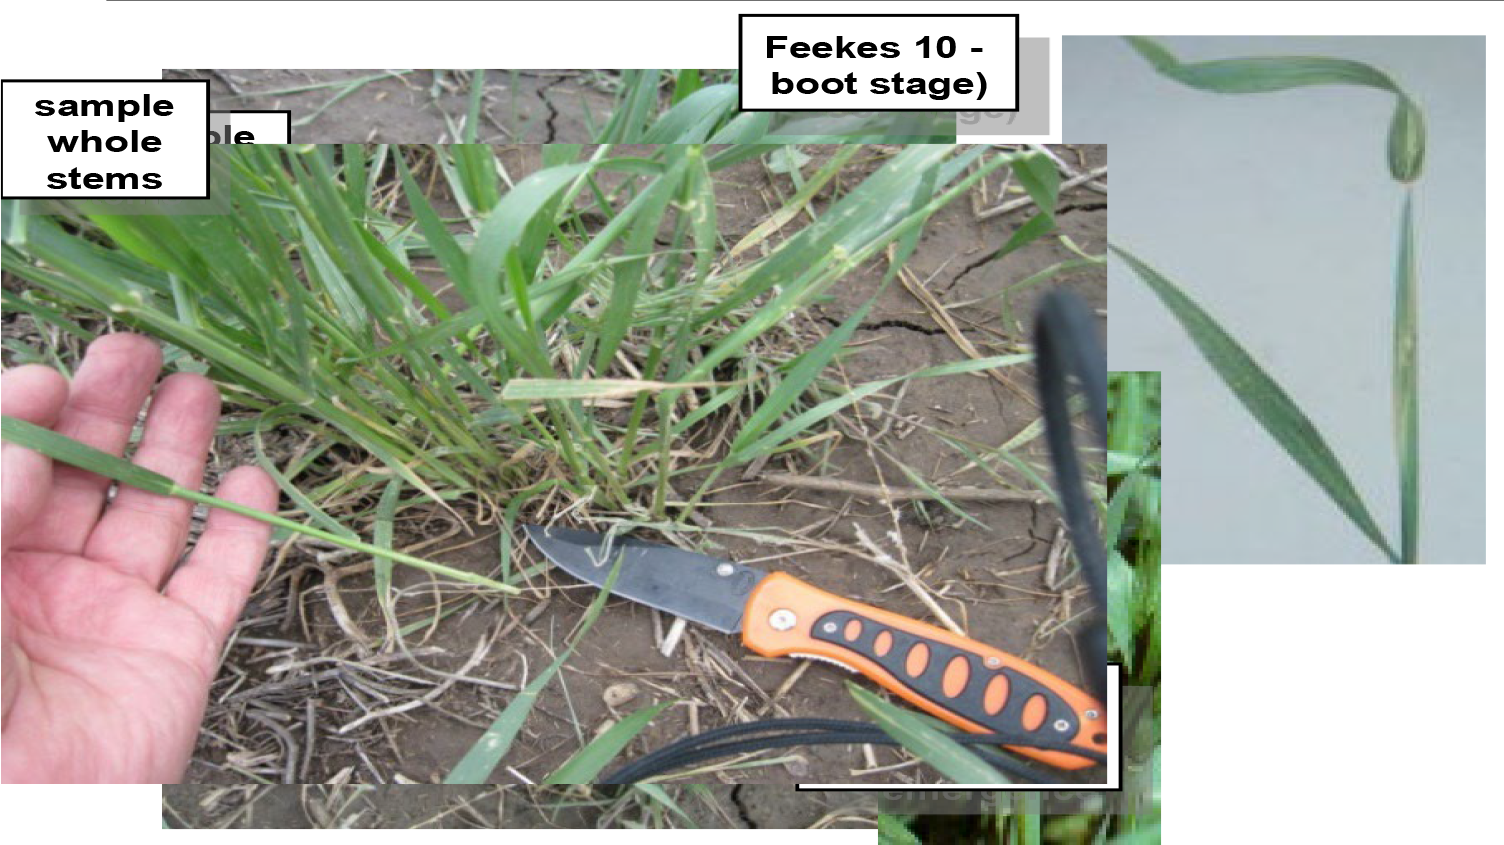
¶ Feekes growth stage 10 - 10.5 (Zadoks scale: 45 - 59)
- 10 - Boot stage; sheath of last leaf completely grown out, head swollen but not yet visible
- 10.1 - Awns visible, heads emerging through slit of flag leaf sheath
- 10.2 - Heading 1/4th complete
- 10.3 - Heading 1/2 complete
- 10.4 - Heading 3/4th complete
- 10.5 - Heading complete
¶ F: Boot to head emergence (Feekes stage 10 to 10.1)
Plant Part: Flag leaves
Sampling Procedure: Collect 50 to 70 flag leaves from healthy plants. The final sample should be about the size of a soft-ball (about 4 to 5 inches in diameter). Place sample in a paper bag, not a plastic bag, for shipment to the laboratory.
| Analysis | Tissue Concentration Guidelines | ||||||||
| Very Low to Low | Typical Range | High to Very High | |||||||
| Nitrogen, % N | 3.00 | - | 3.55 | 3.55 | - | 4.40 | 4.40 | - | 4.90 |
| Phosphorus, %P | 0.18 | - | 0.22 | 0.22 | - | 0.30 | 0.30 | - | 0.40 |
| Potassium, % K | 1.55 | - | 1.80 | 1.80 | - | 2.75 | 2.75 | - | 3.80 |
| Calcium, % Ca | 0.29 | - | 0.38 | 0.38 | - | 0.60 | 0.60 | - | 0.70 |
| Magnesium, % Mg | 0.12 | - | 0.14 | 0.14 | - | 0.20 | 0.20 | - | 0.25 |
| Sulfur, % S | 0.19 | - | 0.22 | 0.22 | - | 0.32 | 0.32 | - | 0.37 |
| Zinc, ppm Zn | 12 | - | 15 | 15 | - | 26 | 26 | - | 38 |
| Iron, ppm Fe | 85 | - | 105 | 105 | - | 215 | 215 | - | 275 |
| Manganese, ppm Mn | 40 | - | 55 | 55 | - | 95 | 95 | - | 140 |
| Copper ppm Cu | 5 | - | 6 | 6 | - | 8 | 8 | - | 11 |
| Boron, ppm B | 4 | - | 5 | 5 | - | 11 | 11 | - | 32 |
| Nitrogen-to-sulfur ratio (N:S) | 11 | - | 12 | 12 | - | 14 | 14 | - | 16 |
| Sodium, % Na | less than 0.01 | 0.01 | 0.01 | - | 0.03 | ||||
| Chloride, % Cl | 0.10 | - | 0.12 | ||||||
¶ Figure F. Sampling Flag Leaves - Feekes 10 Boot Stage
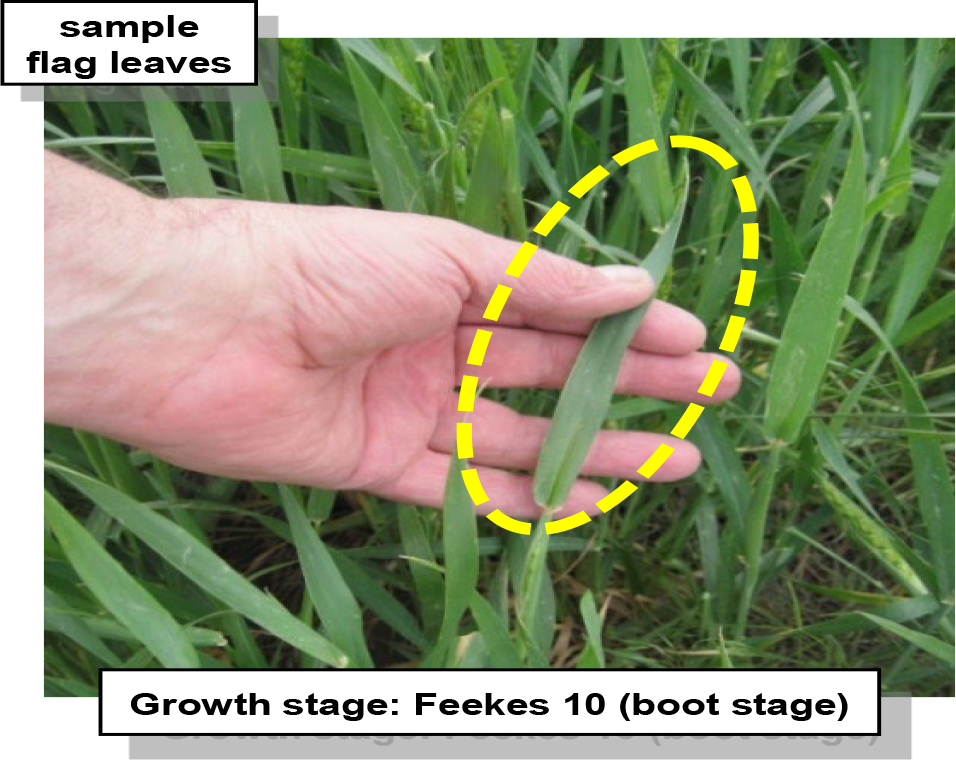
¶ Feekes growth stage 10 - 10.1 (Zadoks scale: 45 - 50)
- 10 - Boot stage; sheath of last leaf completely grown out, head swollen but not yet visible
- 10.1 - Awns visible, heads emerging through slit of flag leaf sheath
¶ G: Flowering (Feekes stage 10.5.1 to 10.5.4)
Plant Part: Whole plant
Sampling Procedure: Collect 25 to 30 whole stems (tillers), cutting off about ½ inch above ground level. At least a pint of loosely packed tissue should be submitted for analysis. Place sample in a paper bag, not a plastic bag, for shipment to the laboratory.
| Analysis | Tissue Concentration Guidelines | ||||||||
| Very Low to Low | Typical Range | High to Very High | |||||||
| Nitrogen, % N | 1.23 | - | 1.65 | 1.65 | - | 3.00 | 3.00 | - | 4.70 |
| Phosphorus, %P | 0.16 | - | 0.19 | 0.19 | - | 0.27 | 0.27 | - | 0.38 |
| Potassium, % K | 1.05 | - | 1.45 | 1.45 | - | 2.40 | 2.40 | - | 3.00 |
| Calcium, % Ca | 0.15 | - | 0.19 | 0.19 | - | 0.37 | 0.37 | - | 0.57 |
| Magnesium, % Mg | 0.10 | - | 0.11 | 0.11 | - | 0.16 | 0.16 | - | 0.22 |
| Sulfur, % S | 0.10 | - | 0.14 | 0.14 | - | 0.25 | 0.25 | - | 0.40 |
| Zinc, ppm Zn | 12 | - | 14 | 14 | - | 27 | 27 | - | 33 |
| Iron, ppm Fe | 60 | - | 75 | 75 | - | 225 | 225 | - | 415 |
| Manganese, ppm Mn | 35 | - | 45 | 45 | - | 80 | 80 | - | 115 |
| Copper ppm Cu | 3 | - | 4 | 4 | - | 10 | 10 | - | 13 |
| Boron, ppm B | 3 | - | 4 | 4 | - | 7 | 7 | - | 15 |
| Nitrogen-to-sulfur ratio (N:S) | 10 | - | 11 | 11 | - | 14 | 14 | - | 15 |
| Sodium, % Na | less than 0.01 | 0.01 | - | 0.08 | |||||
| Chloride, % Cl | |||||||||
¶ Figure G. Sampling Whole Stems - Feekes 10.4 Head Emerged
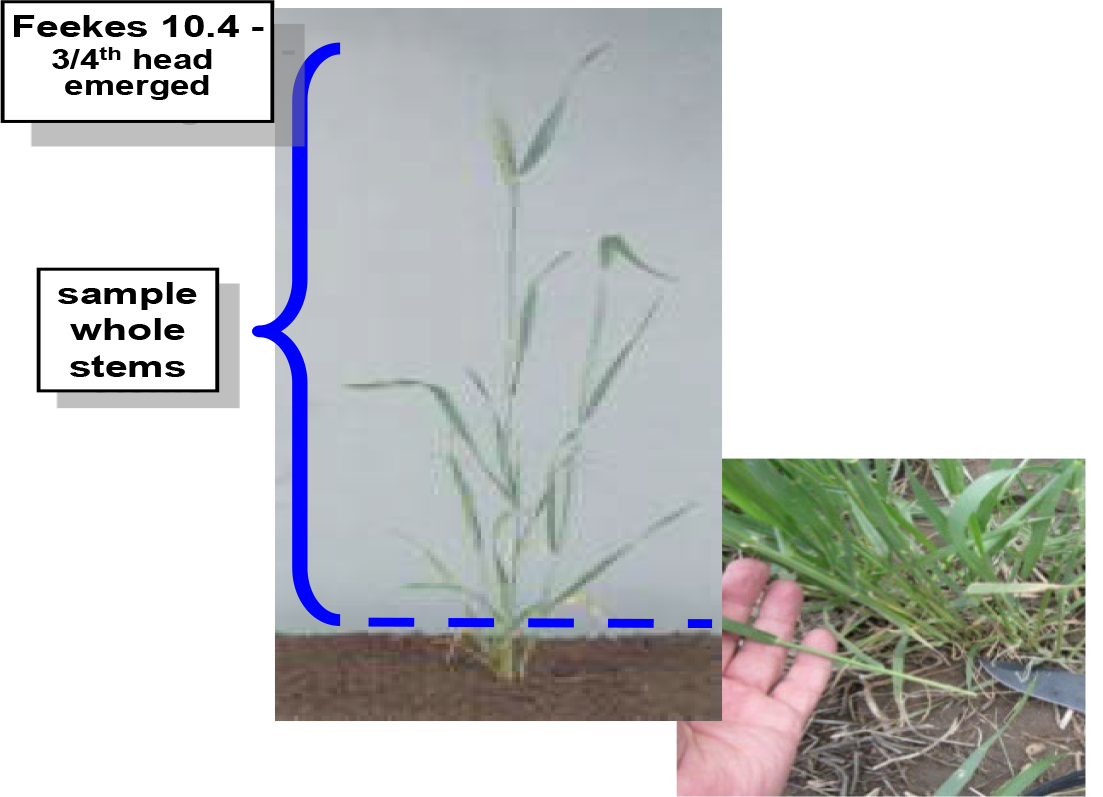
¶ Feekes growth stage 10.5.1 - 10.5.4 (Zadoks scale: 59 - 71)
- 10.5.1 - Beginning of flowering
- 10.5.2 - Flowering complete to top of spike
- 10.5.3 - Flowering complete to base of spike
- 10.5.4 - Flowering complete, kernels watery ripe
¶ H: Flowering (Feekes stage 10.5.1 to 10.5.4)
Plant Part: Flag leaves
Sampling Procedure: Collect 50 to 70 flag leaves from healthy plants. The final sample should be about the size of a soft-ball (about 4 to 5 inches in diameter). Place sample in a paper bag, not a plastic bag, for shipment to the laboratory.
| Analysis | Tissue Concentration Guidelines | ||||||||
| Very Low to Low | Typical Range | High to Very High | |||||||
| Nitrogen, % N | 3.27 | - | 3.55 | 3.55 | - | 4.30 | 4.30 | - | 4.80 |
| Phosphorus, %P | 0.20 | - | 0.21 | 0.21 | - | 0.28 | 0.28 | - | 0.31 |
| Potassium, % K | 1.70 | - | 1.90 | 1.90 | - | 2.30 | 2.30 | - | 2.75 |
| Calcium, % Ca | 0.33 | - | 0.40 | 0.40 | - | 0.60 | 0.60 | - | 0.70 |
| Magnesium, % Mg | 0.11 | - | 0.13 | 0.13 | - | 0.17 | 0.17 | - | 0.23 |
| Sulfur, % S | 0.21 | - | 0.24 | 0.24 | - | 0.30 | 0.30 | - | 0.40 |
| Zinc, ppm Zn | 13 | - | 15 | 15 | - | 21 | 21 | - | 27 |
| Iron, ppm Fe | 100 | - | 105 | 105 | - | 155 | 155 | - | 220 |
| Manganese, ppm Mn | 37 | - | 45 | 45 | - | 100 | 100 | - | 170 |
| Copper ppm Cu | 5 | - | 6 | 6 | - | 9 | 9 | - | 13 |
| Boron, ppm B | 4 | - | 6 | 6 | - | 11 | 11 | - | 20 |
| Nitrogen-to-sulfur ratio (N:S) | 11 | - | 13 | 13 | - | 15 | 15 | - | 17 |
| Sodium, % Na | less than 0.01 | 0.01 | 0.01 | - | 0.01 | ||||
| Chloride, % Cl | 0.10 | - | 0.12 | ||||||
¶ Figure H. Sampling Flag Leaves - Feeges 10.5.1 Beginning to Flower
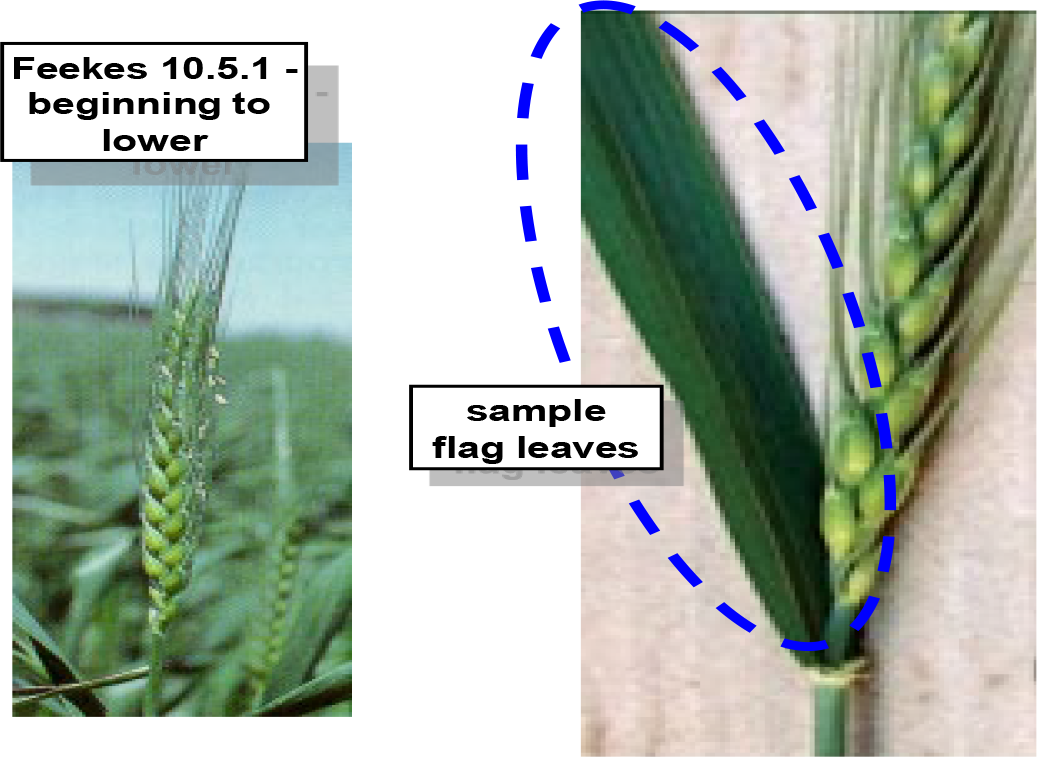
¶ Feekes growth stage 10.5.1 - 10.5.4 (Zadoks scale: 59 - 71)
- 10.5.1 - Beginning of flowering
- 10.5.2 - Flowering complete to top of spike
- 10.5.3 - Flowering complete to base of spike
- 10.5.4 - Flowering complete, kernels watery ripe
¶ I: Dough (Feekes stage 11.2)
Plant Part: Whole plant
Sampling Procedure: Collect 25 to 30 whole stems (tillers), cutting off about ½ inch above ground level. At least a pint of loosely packed tissue should be submitted for analysis. Place sample in a paper bag, not a plastic bag, for shipment to the laboratory.
| Analysis | Tissue Concentration Guidelines | ||||||||
| Very Low to Low | Typical Range | High to Very High | |||||||
| Nitrogen, % N | 0.85 | - | 1.40 | 1.40 | - | 2.25 | 2.25 | - | 3.80 |
| Phosphorus, %P | 0.12 | - | 0.18 | 0.18 | - | 0.26 | 0.26 | - | 0.30 |
| Potassium, % K | 0.90 | - | 1.27 | 1.27 | - | 1.95 | 1.95 | - | 3.00 |
| Calcium, % Ca | 0.08 | - | 0.11 | 0.11 | - | 0.30 | 0.30 | - | 0.50 |
| Magnesium, % Mg | 0.08 | - | 0.10 | 0.10 | - | 0.16 | 0.16 | - | 0.22 |
| Sulfur, % S | 0.09 | - | 0.11 | 0.11 | - | 0.18 | 0.18 | - | 0.30 |
| Zinc, ppm Zn | 9 | - | 12 | 12 | - | 22 | 22 | - | 27 |
| Iron, ppm Fe | 65 | - | 80 | 80 | - | 225 | 225 | - | 420 |
| Manganese, ppm Mn | 37 | - | 45 | 45 | - | 80 | 80 | - | 115 |
| Copper ppm Cu | 3 | - | 4 | 4 | - | 6 | 6 | - | 10 |
| Boron, ppm B | 3 | - | 4 | 4 | - | 7 | 7 | - | 13 |
| Nitrogen-to-sulfur ratio (N:S) | 10 | - | 11 | 11 | - | 13 | 13 | - | 15 |
| Sodium, % Na | less than 0.01 | 0.01 | 0.01 | - | 0.05 | ||||
| Chloride, % Cl | |||||||||
¶ Figure I. Sampling Whole Stems
¶ Feekes growth stage 11.1 - 11.4 (Zadoks scale: 75- 92)
- 11.1 - Kernels milky ripe
- 11.2 - Soft dough stage, "mealy" ripe; kernel contents soft, but dry
- 11.3 - Kernels hard, difficult to split with thumb-nail
- 11.4 - Kernels hard, cannot be dented with thumb-nail; ripe for harvest; straw dead
¶ J: Dough (Feekes stage 11.2)
Plant Part: Flag leaves
Sampling Procedure: Collect 50 to 70 flag leaves from healthy plants. The final sample should be about the size of a soft-ball (about 4 to 5 inches in diameter). Place sample in a paper bag, not a plastic bag, for shipment to the laboratory.
| Analysis | Tissue Concentration Guidelines | ||||||||
| Very Low to Low | Typical Range | High to Very High | |||||||
| Nitrogen, % N | 2.30 | - | 2.85 | 2.85 | - | 3.60 | 3.60 | - | 4.25 |
| Phosphorus, %P | 0.15 | - | 0.18 | 0.18 | - | 0.25 | 0.25 | - | 0.30 |
| Potassium, % K | 1.70 | - | 1.85 | 1.85 | - | 2.40 | 2.40 | - | 3.00 |
| Calcium, % Ca | 0.40 | - | 0.47 | 0.47 | - | 0.75 | 0.75 | - | 1.05 |
| Magnesium, % Mg | 0.12 | - | 0.15 | 0.15 | - | 0.21 | 0.21 | - | 0.35 |
| Sulfur, % S | 0.20 | - | 0.25 | 0.25 | - | 0.30 | 0.30 | - | 0.45 |
| Zinc, ppm Zn | 12 | - | 15 | 15 | - | 20 | 20 | - | 25 |
| Iron, ppm Fe | 125 | - | 145 | 145 | - | 215 | 100 | - | 160 |
| Manganese, ppm Mn | 35 | - | 50 | 50 | - | 100 | 100 | - | 160 |
| Copper ppm Cu | 5 | - | 7 | 7 | - | 9 | 9 | - | 14 |
| Boron, ppm B | 5 | - | 9 | 9 | - | 24 | 24 | - | 49 |
| Nitrogen-to-sulfur ratio (N:S) | 9 | - | 11 | 11 | - | 13 | 13 | - | 15 |
| Sodium, % Na | less than 0.01 | 0.01 | 0.01 | - | 0.21 | ||||
| Chloride, % Cl | 0.10 | - | 0.12 | ||||||
¶ Figure J. Sample Flag Leaves
¶ Feekes growth stage 11.1 - 11.4 (Zadoks scale: 75- 92)
- 11.1 - Kernels milky ripe
- 11.2 - Soft dough stage, "mealy" ripe; kernel contents soft, but dry
- 11.3 - Kernels hard, difficult to split with thumb-nail
- 11.4 - Kernels hard, cannot be dented with thumb-nail; ripe for harvest; straw dead
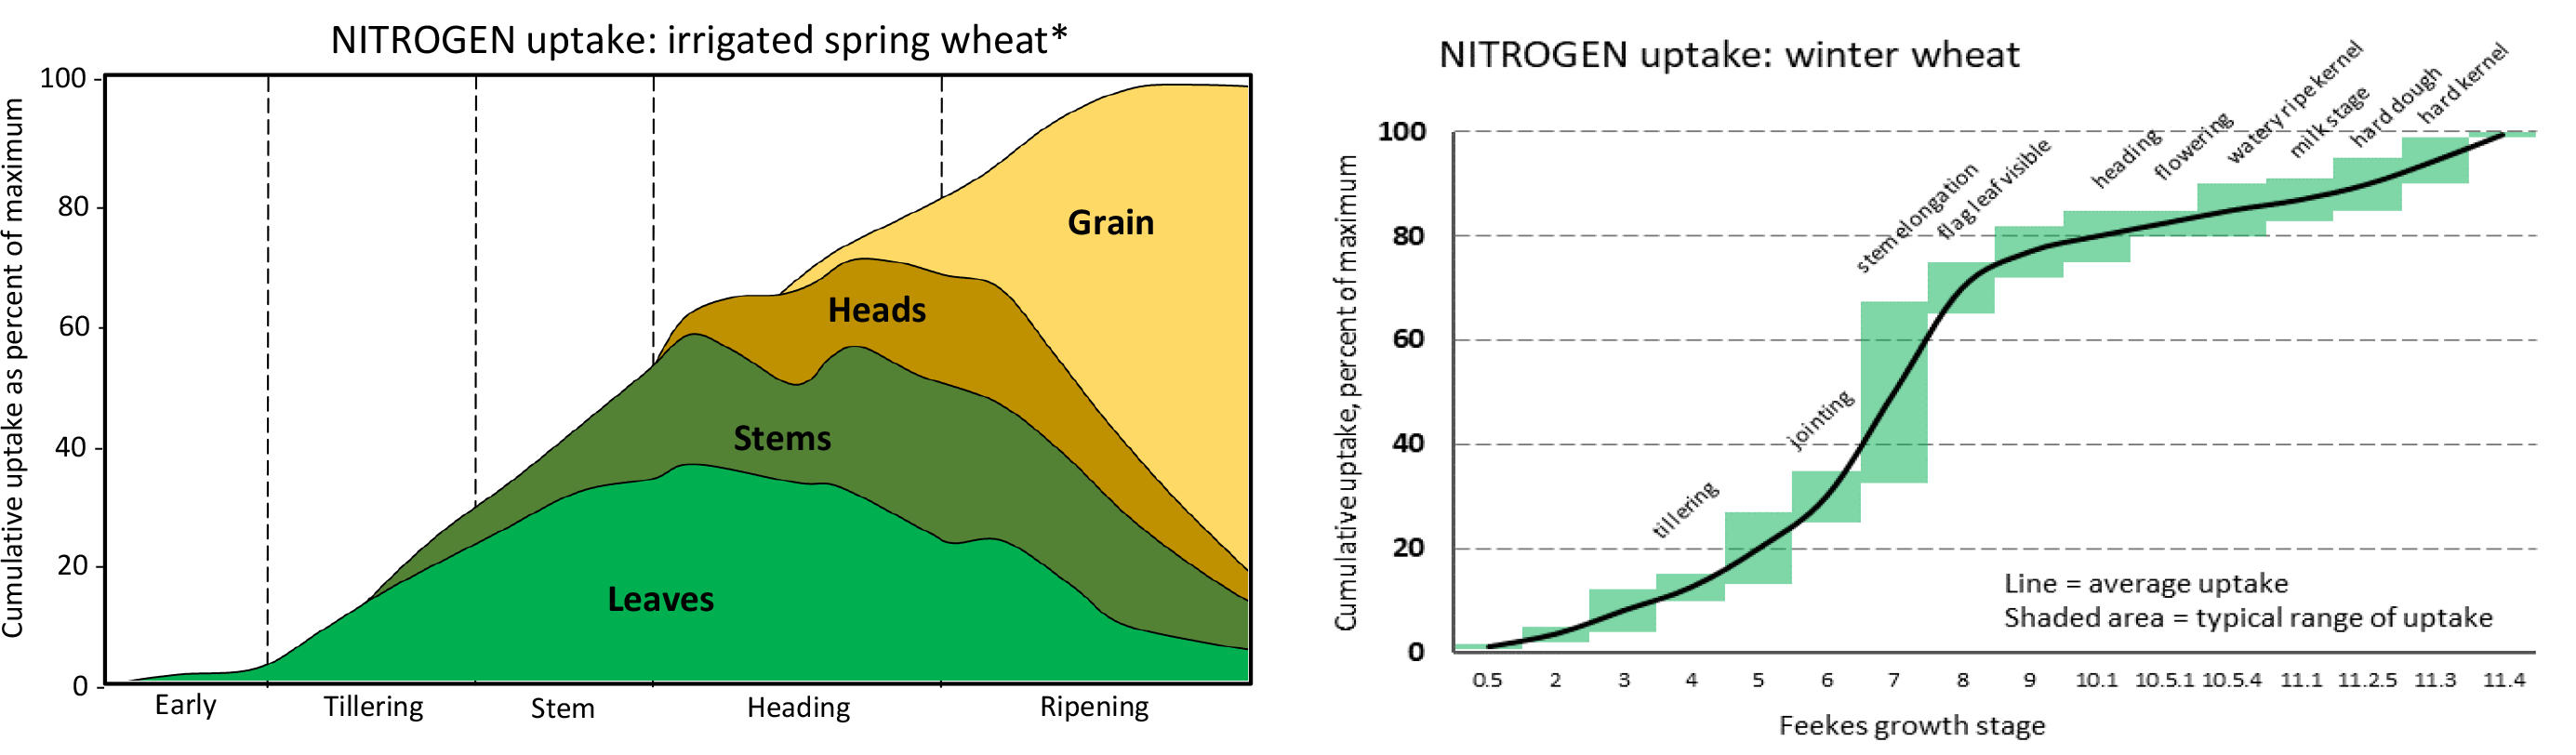
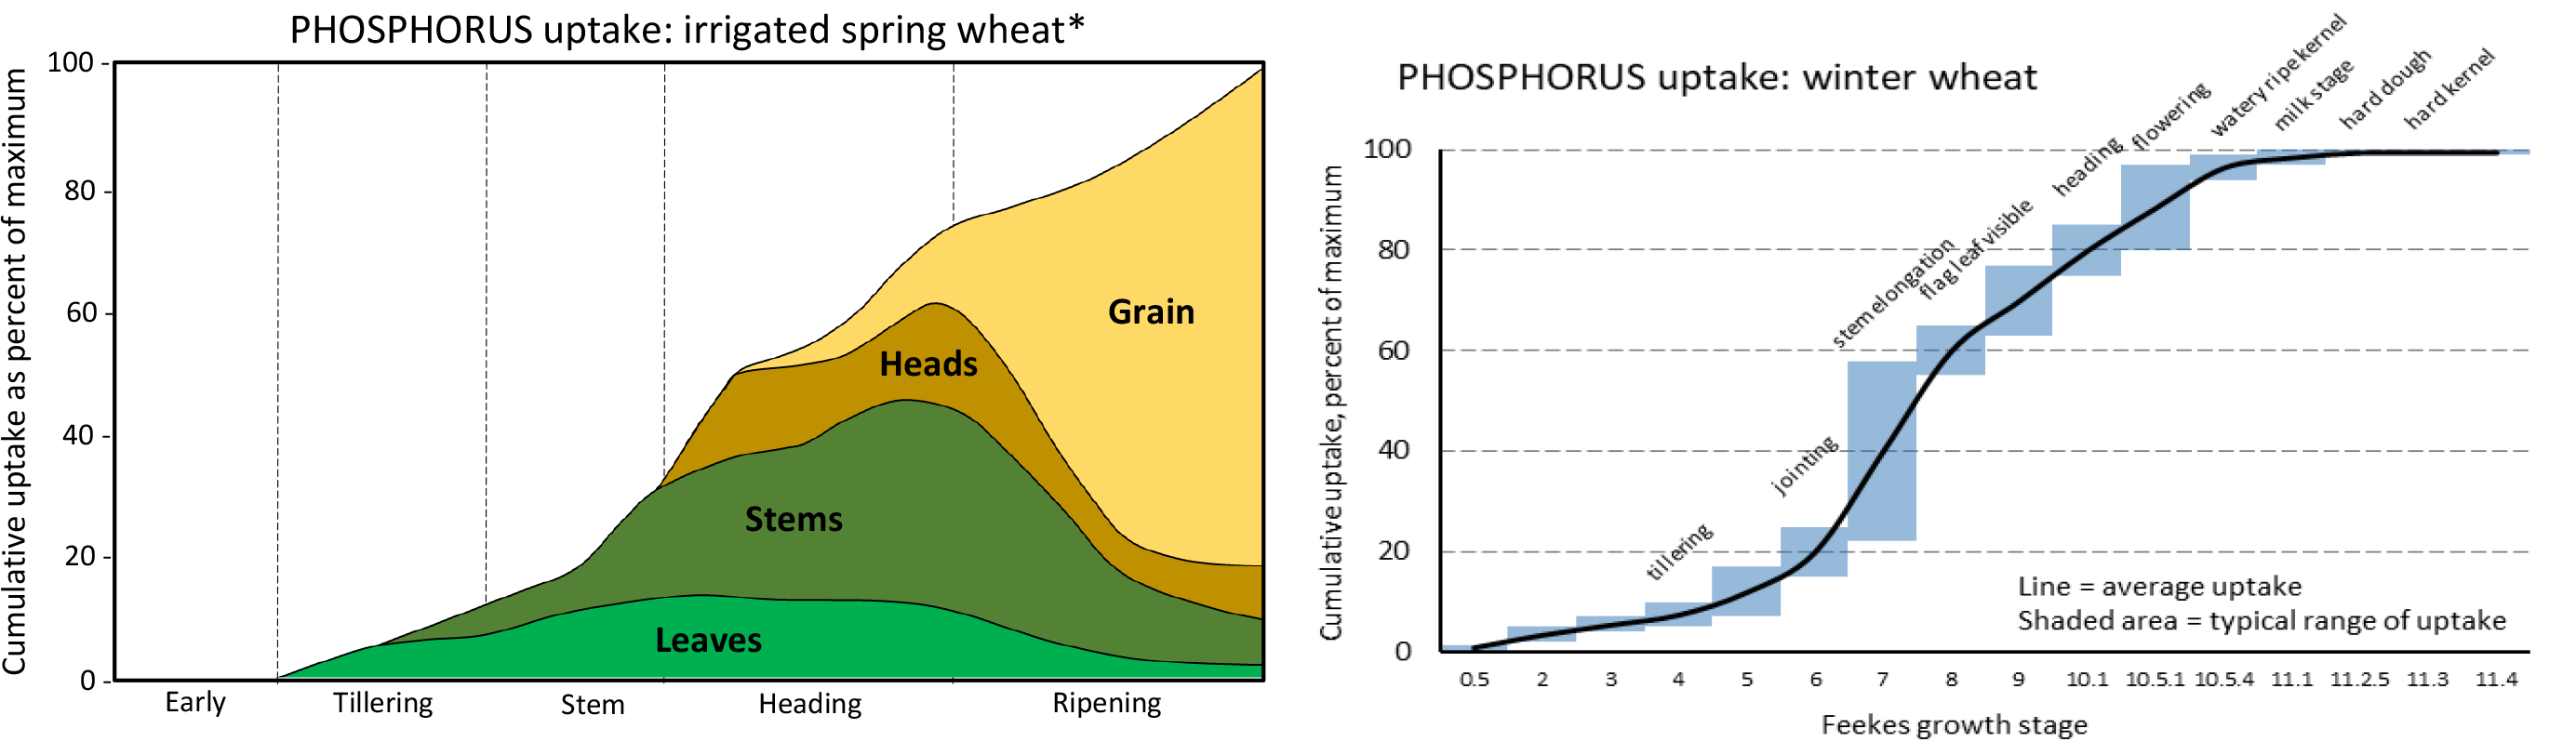
¶ K. Wheat nutrient uptake: N, P, K
¶ Figure K-1. Nitrogen Uptake
¶ Figure K-2. Phosphorus Uptake
¶ Figure K-3. Potassium Uptake
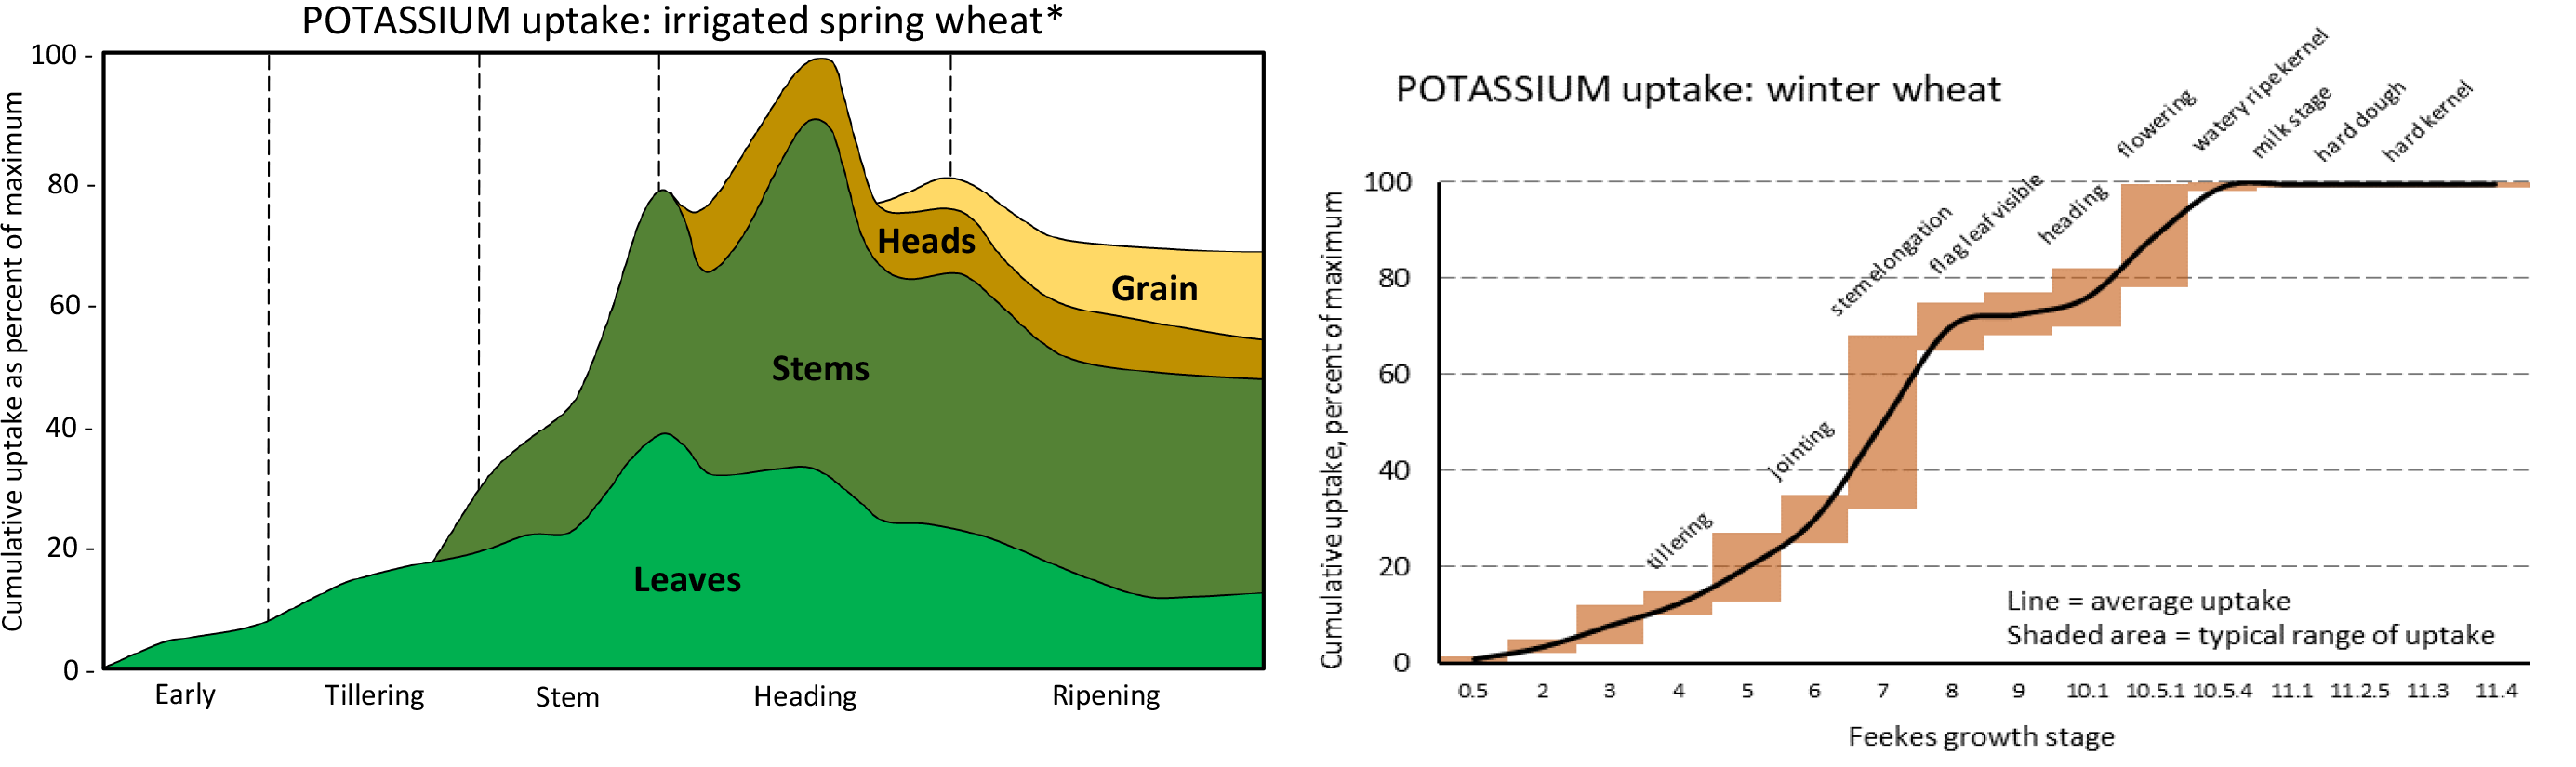
¶ Table K. Nutrient uptake by winter wheat** |
||||
| Number | Feekes Growth Stage Description | Nitrogen, N% | Phosphorus, P% | Potassium, K% |
| 0.5 | Coleoptile emergence | < 2% | < 2% | < 2% |
| 2 | Tillering begins | 2% - 5% | 2% - 5% | 2% - 5% |
| 4 | Leaf sheaths lengthen and form "false stem"; collars visible; tillers erect | 10% - 15% | 5% - 10% | 10% - 15% |
| 6 | Jointing stage; first stem node visible at base of shoot | 25% - 35% | 15% - 25% | 25% - 35% |
| 8 | Last leaf visible, but still rolled up; ear beginning to swell | 65% - 75% | 55% - 65% | 65% - 75% |
| 10.1 | Heading stage; awns emerging and are just visible | 75% - 85% | 75% - 85% | 70% - 80% |
| 10.5.1 | Flowering (anthesis) begins; anthers extend from florets | 80% - 85% | 80% - 95% | 80% - 85% |
| 10.5.4 | "Watery ripe" kernel; flowering complete; 7 to 10 days after floret extension | 80% - 90% | 95% - 100% | 100% |
| 11.2.5 | Hard dough stage | 85% - 90% | 100% | 100% |
| 11.3 | Kernel hard stage (about 20% moisture); hard to divide with thumbnail | 90% | 100% | 100% |
| 11..4 | Harvest ripe grain (about 14% moisture); straw is dead | 100% | 100% | 100% |