⇦ Back to Soil Fertility and Plant Nutrition Home
¶ Watermelon (Citrullis lanatus)
| Table No: | Growth stage: | Plant part: |
| Table A | Early growth to flowering | Mature leaves and petiole |
| Table B | Early fruiting | Mature leaves and petiole |
| Table C | Fruiting to harvest | Mature leaves and petiole |
| Table D | Growing season | Petiole |
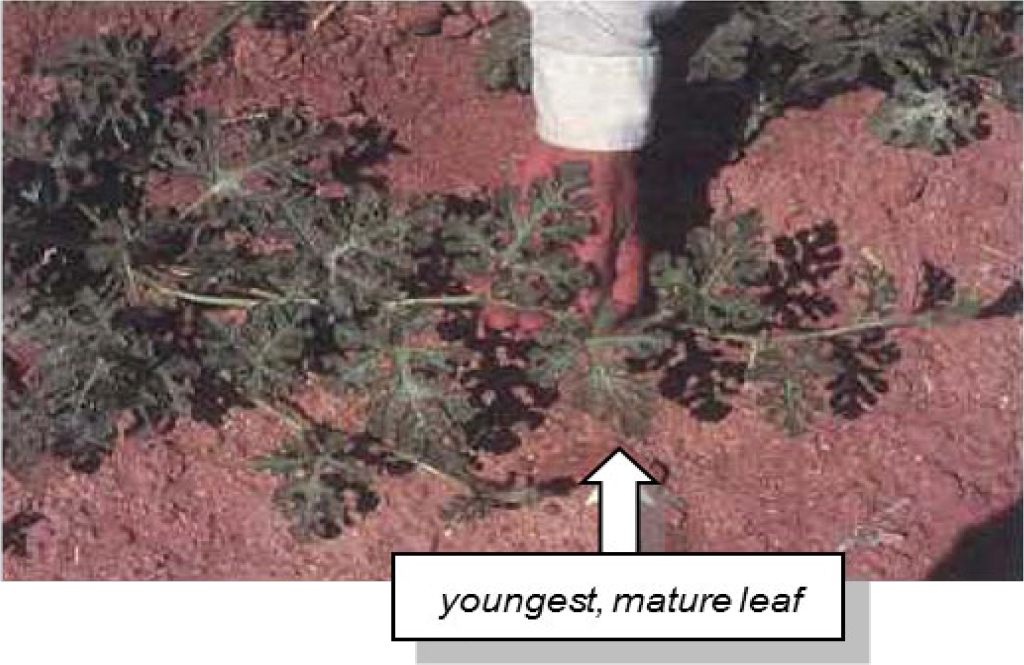
¶ A: Early growth to flowering
Plant Part: Youngest mature leaf and petiole (usually 5th or 6th leaf from tip)
Sampling Procedure: Collect leaves from 25 to 50 plants. Start from the tip of the youngest vine and select the youngest mature (full-size) leaf, generally the fifth or sixth leaf. Collect both leaf blades and petiole for complete analysis. Collect separate petiole sample for additional nitrate and phosphate analysis, if desired. Place samples in paper bag - not plastic - for shipment.
| Analysis | Tissue Concentration Guidelines | ||||||||
| Low/Marginal Range | Sufficiency Range | Excessive, toxic? | |||||||
| Nitrogen, % N | 2.50 | - | 3.00 | 3.00 | - | 4.50 | |||
| Phosphorus, %P | 0.25 | - | 0.30 | 0.30 | - | 0.70 | |||
| Potassium, % K | 2.25 | - | 3.00 | 3.00 | - | 4.50 | |||
| Calcium, % Ca | 0.80 | - | 1.00 | 1.00 | - | 2.20 | |||
| Magnesium, % Mg | 0.20 | - | 0.25 | 0.25 | - | 0.50 | |||
| Sulfur, % S | 0.17 | - | 0.20 | 0.20 | - | 0.50 | |||
| Zinc, ppm Zn | 15 | - | 20 | 20 | - | 50 | |||
| Iron, ppm Fe | 25 | - | 30 | 30 | - | 200 | |||
| Manganese, ppm Mn | 15 | - | 20 | 20 | - | 100 | 800 | ||
| Copper ppm Cu | 4 | - | 6 | 6 | - | 15 | |||
| Boron, ppm B | 15 | - | 20 | 20 | - | 50 | |||
| Nitrogen-to-sulfur ratio (N:S) | 0.25 | - | 0.50 | ||||||
| Sodium, % Na | 0.30 | - | 1.00 | ||||||
| Chloride, % Cl | |||||||||
| Nitrate, ppm NO3-N | |||||||||
| Phosphate, ppm PO4-P | |||||||||
¶ Figure A.
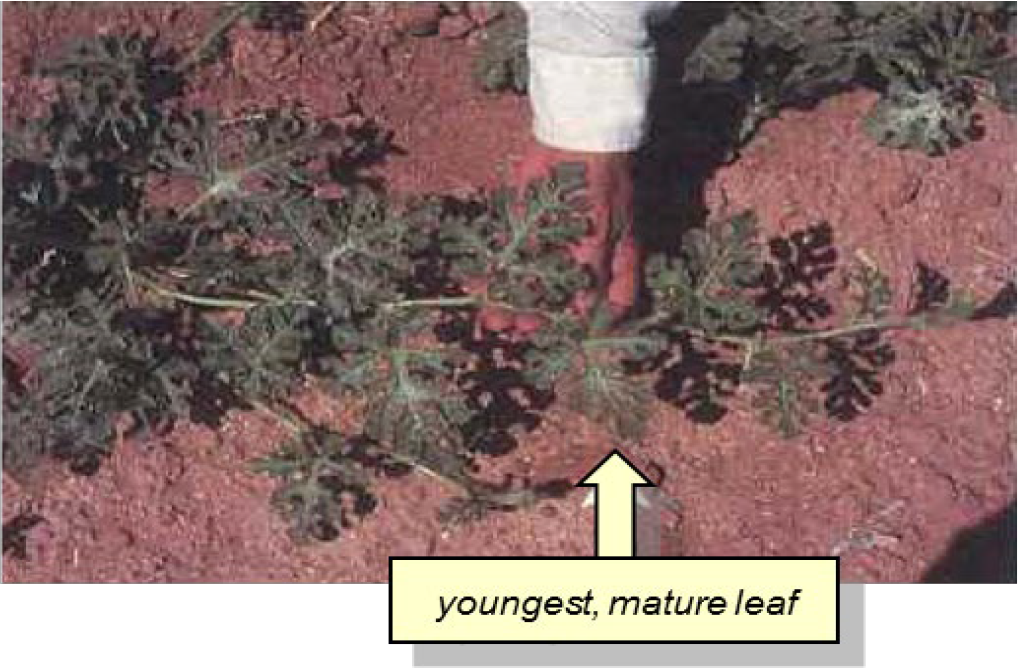
¶ B: Early fruiting
Plant Part: Youngest mature leaf and petiole (usually 5th or 6th leaf from tip)
Sampling Procedure: Collect leaves from 25 to 50 plants. Start from the tip of the youngest vine and select the youngest mature (full-size) leaf, generally the fifth or sixth leaf. Collect both leaf blades and petiole. Collect leaves free from disease or insect damage. Submit at least a pint of loosely packed tissue (a ball about 4 to 5 inches in diameter). Place samples in paper bag - not plastic - for shipment.
| Analysis | Tissue Concentration Guidelines | ||||||||
| Low/Marginal Range | Sufficiency Range | Excessive, toxic? | |||||||
| Nitrogen, % N | 1.50 | - | 1.80 | 1.80 | - | 3.00 | |||
| Phosphorus, %P | 0.20 | - | 0.25 | 0.25 | - | 0.70 | |||
| Potassium, % K | 2.00 | - | 2.30 | 2.30 | - | 4.00 | |||
| Calcium, % Ca | 0.80 | - | 1.10 | 1.10 | - | 2.50 | |||
| Magnesium, % Mg | 0.20 | - | 0.25 | 0.25 | - | 0.60 | |||
| Sulfur, % S | 0.15 | - | 0.20 | 0.20 | - | 0.50 | |||
| Zinc, ppm Zn | 15 | - | 20 | 20 | - | 50 | |||
| Iron, ppm Fe | 20 | - | 30 | 30 | - | 250 | |||
| Manganese, ppm Mn | 15 | - | 20 | 20 | - | 150 | |||
| Copper ppm Cu | 3 | - | 4 | 4 | - | 10 | |||
| Boron, ppm B | 15 | - | 20 | 20 | - | 50 | |||
| Nitrogen-to-sulfur ratio (N:S) | 0.25 | - | 0.50 | ||||||
| Sodium, % Na | 0.30 | - | 1.00 | ||||||
| Chloride, % Cl | |||||||||
| Nitrate, ppm NO3-N | |||||||||
| Phosphate, ppm PO4-P | |||||||||
¶ Figure B.
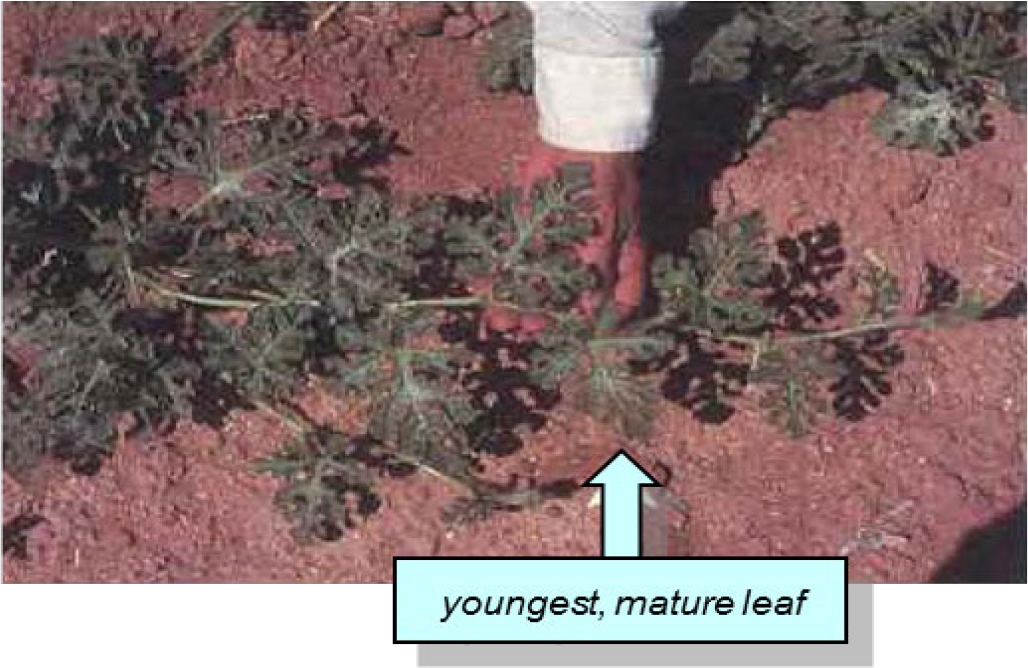
¶ C: Fruiting to harvest
Plant Part: Youngest mature leaf and petiole (usually 5th or 6th leaf from tip)
Sampling Procedure: Collect leaves from 25 to 50 plants. Start from the tip of the youngest vine and select the youngest mature (full-size) leaf, generally the fifth or sixth leaf. Collect both leaf blades and petiole. Collect leaves free from disease or insect damage. Submit at least a pint of loosely packed tissue (a ball about 4 to 5 inches in diameter). Place samples in paper bag - not plastic - for shipment.
| Analysis | Tissue Concentration Guidelines | ||||||||
| Low/Marginal Range | Sufficiency Range | Excessive, toxic? | |||||||
| Nitrogen, % N | 1.70 | - | 2.00 | 2.00 | - | 3.50 | |||
| Phosphorus, %P | 0.15 | - | 0.20 | 0.20 | - | 0.60 | |||
| Potassium, % K | 1.80 | - | 2.10 | 2.10 | - | 3.50 | |||
| Calcium, % Ca | 0.80 | - | 1.00 | 1.00 | - | 2.00 | |||
| Magnesium, % Mg | 0.18 | - | 0.22 | 0.22 | - | 0.80 | |||
| Sulfur, % S | 0.15 | - | 0.20 | 0.20 | - | 0.60 | |||
| Zinc, ppm Zn | 15 | - | 20 | 20 | - | 100 | |||
| Iron, ppm Fe | 25 | - | 35 | 35 | - | 250 | |||
| Manganese, ppm Mn | 15 | - | 20 | 20 | - | 150 | |||
| Copper ppm Cu | 4 | - | 6 | 6 | - | 15 | |||
| Boron, ppm B | 15 | - | 20 | 20 | - | 50 | |||
| Nitrogen-to-sulfur ratio (N:S) | 0.25 | - | 0.50 | ||||||
| Sodium, % Na | 0.30 | - | 1.00 | ||||||
| Chloride, % Cl | |||||||||
| Nitrate, ppm NO3-N | |||||||||
| Phosphate, ppm PO4-P | |||||||||
¶ Figure C.
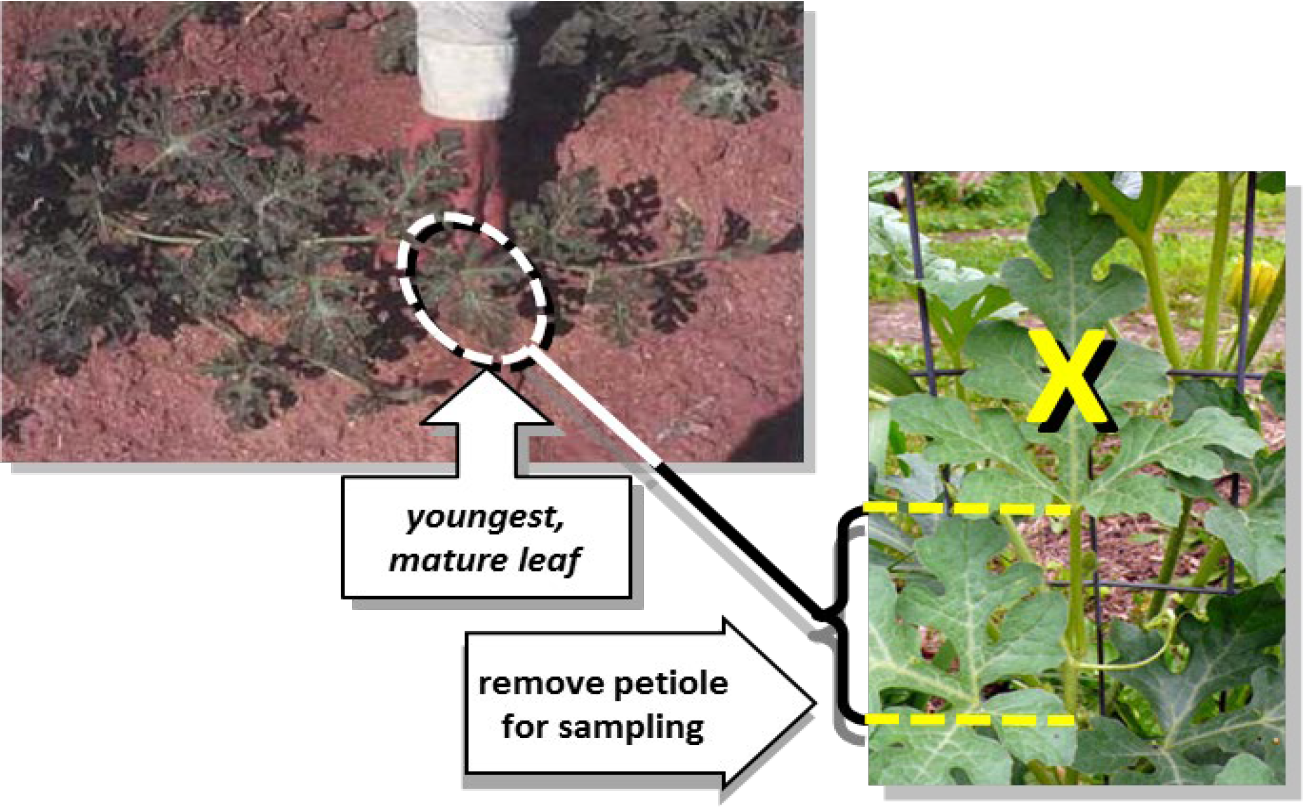
¶ D: Growing season
Plant Part: Petiole of youngest mature leaf (ususually 5th or 6th leaf from tip)
Sampling Procedure: Collect leaves from 20 to 25 average-looking plants. Start from the tip of the youngest vine and select the youngest mature (full-size) leaf, generally the fifth or sixth leaf. Collect petiole and discard leaf blade.
| Growth Stage | Petiole concentration guidelines* | |||||||||||
| Deficient | Marginal | Sufficient | Excessive | |||||||||
| ------------ Nitrate, ppm NO3-N ------------ | ||||||||||||
| 3-leaf to 4-leaf | < 4500 | 4500 | - | 10000 | 10,000 | - | 15,000 | > 15,000 | ||||
| Early runner | < 4500 | 4500 | - | 10000 | 10,000 | - | 15,000 | > 15,000 | ||||
| 2-inch melons | < 4500 | 4500 | - | 12500 | 12,500 | - | 18,000 | > 18,000 | ||||
| Full-size melons | < 4000 | 4000 | - | 4500 | 4500 | - | 6000 | > 6000 | ||||
| ----------- Phosphate, ppm PO4-P ----------- | ||||||||||||
| Growing season | < 1200 | 1200 | - | 1500 | 1500 | - | 2500 | > 2500 | ||||
| Suggested nitrogen applications based on petiole nitrate concentrations (ppm NO3-N)* (assumes 30 to 40 ton per acre yield potential) |
||||||||||||
| Growth Stage | Deficient | Marginal | Sufficient | Excessive | ||||||||
| ------------ pounds nitrogen per acre (lb N/ac) ------------ | ||||||||||||
| 3-leaf to 4-leaf | 50 | - | 75 | 40 | - | 50 | 30 | - | 40 | 0 | - | 30 |
| Early runner | 100 | - | 125 | 70 | - | 100 | 60 | - | 70 | 0 | - | 60 |
| 2-inch melons | 50 | - | 75 | 30 | - | 50 | 25 | - | 30 | 0 | ||
| Full-size melons | 25 | - | 30 | 25 | - | 35 | 0 | - | 25 | 0 | ||
¶ Figure D.
Petiole analysis results are best interpreted from trends over the growing season and not on results from a single sampling date. Results from a single sample may be affected by time of day, climatic conditions, plant stress, age, or disease, that are not directly related to fertility status. Nutrient concentrations are not uniform throughout the plant and may change as the tissue matures. Petiole analysis trends should be evaluated by variety, growing season, and yield/quality goals. Collecting petioles from the same location as soil samples allows comparison of soil nutrient availability with petiole nutrient status
Note: Leaf analysis can be a reliable indicator of a tree's nutrient status and used to diagnose problems occurring during the growing season. It is also useful to differentiate between nutritional problems and disease symptoms.
These plant analysis interpretations are developed from data collected across a wide range of conditions. Plant tissue levels can vary between varieties or be affected by conditions that affect nutrient uptake, Low nutrient levels may be due to deficiency or to dilution by intensive growth. High or excessive nutrient levels may be a sign of restricted growth allowing nutrients to accumulate in the plant tissue. Nutrient imbalance may be secondary to the primary problem.
Collecting "paired" samples (e.g.,"good" vs. "bad") greatly improves the diagnostic value of plant analysis. Paired sampling also allows comparison of the nutrient status of healthy trees to abnormal ones in situations outside the normal sampling routine.