⇦ Back to Soil Fertility and Plant Nutrition Home
¶ Tobacco (Nicotiana tabacum)
| Table No: | Growth stage: | Plant part: |
| Table A | Seedling to early growth (30 to 45 days after planting) | Whole plant or leaves, depending on size |
| Table B | Early growth (45 to 60 days after planting) | Most recently matured, fully-developed leaf. |
| Table C | Bloom or flowering (60 to 80 days after planting) | Most recently matured, fully-developed leaf. |
| Table D | Maturity (80 to 100 days after planting, flue-cured) | Most recently matured, fully-developed leaf. |
| Table E | Maturity (80 to 100 days after planting, air-cured burley) | Most recently matured, fully-developed leaf. |
| Table F | Harvest, flue-cured | Leaves |
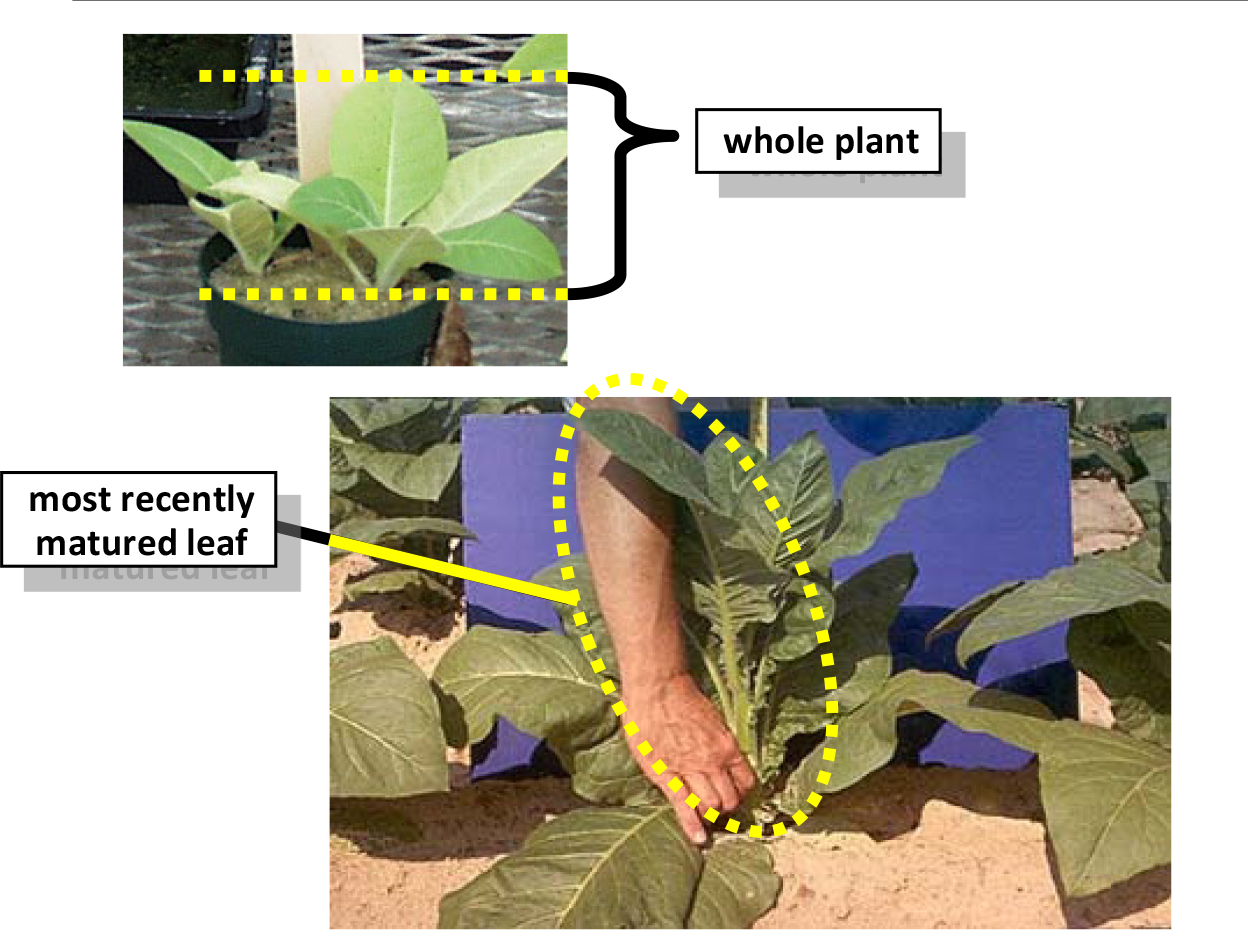
¶ A: Seedling to early growth (30 to 45 days after planting)
Plant Part: Whole plant or leaves, depending on size.
Sampling Procedure: Collect 12 to 15 seedling plants, cutting off at ground level. For more mature plants, collect the most recently matured leaves from 10 to 15 plants. This is the first fully-developed leaf back from the growing point.
| Analysis | Tissue Concentration Guidelines | |||||||
| Marginal Range | Sufficiency Range | Excessive, toxic? | ||||||
| Nitrogen, % N | 3.50 | - | 4.00 | 4.00 | - | 6.50 | ||
| Phosphorus, %P | 0.17 | - | 0.20 | 0.20 | - | 0.80 | ||
| Potassium, % K | 2.50 | - | 3.00 | 3.00 | - | 4.50 | ||
| Calcium, % Ca | 0.60 | - | 1.60 | 1.60 | - | 2.50 | ||
| Magnesium, % Mg | 0.15 | - | 0.20 | 0.20 | - | 0.85 | ||
| Sulfur, % S | 0.15 | - | 0.20 | 0.20 | - | 0.60 | ||
| Zinc, ppm Zn | 15 | - | 25 | 25 | - | 60 | ||
| Iron, ppm Fe | 50 | - | 80 | 80 | - | 500 | ||
| Manganese, ppm Mn | 20 | - | 25 | 25 | - | 200 | 1000? | |
| Copper ppm Cu | 5 | - | 10 | 10 | - | 30 | ||
| Boron, ppm B | 14 | - | 18 | 18 | - | 75 | ||
| Nitrogen-to-sulfur ratio (N:S) | 15 | - | 18 | 12 | - | 15 | ||
| Chloride, % Cl | - | - | 1.50 | |||||
| Molybdenum, ppm Mo | 0.18 | - | 0.20 | 0.20 | - | 1.00 | ||
¶ Figure A.
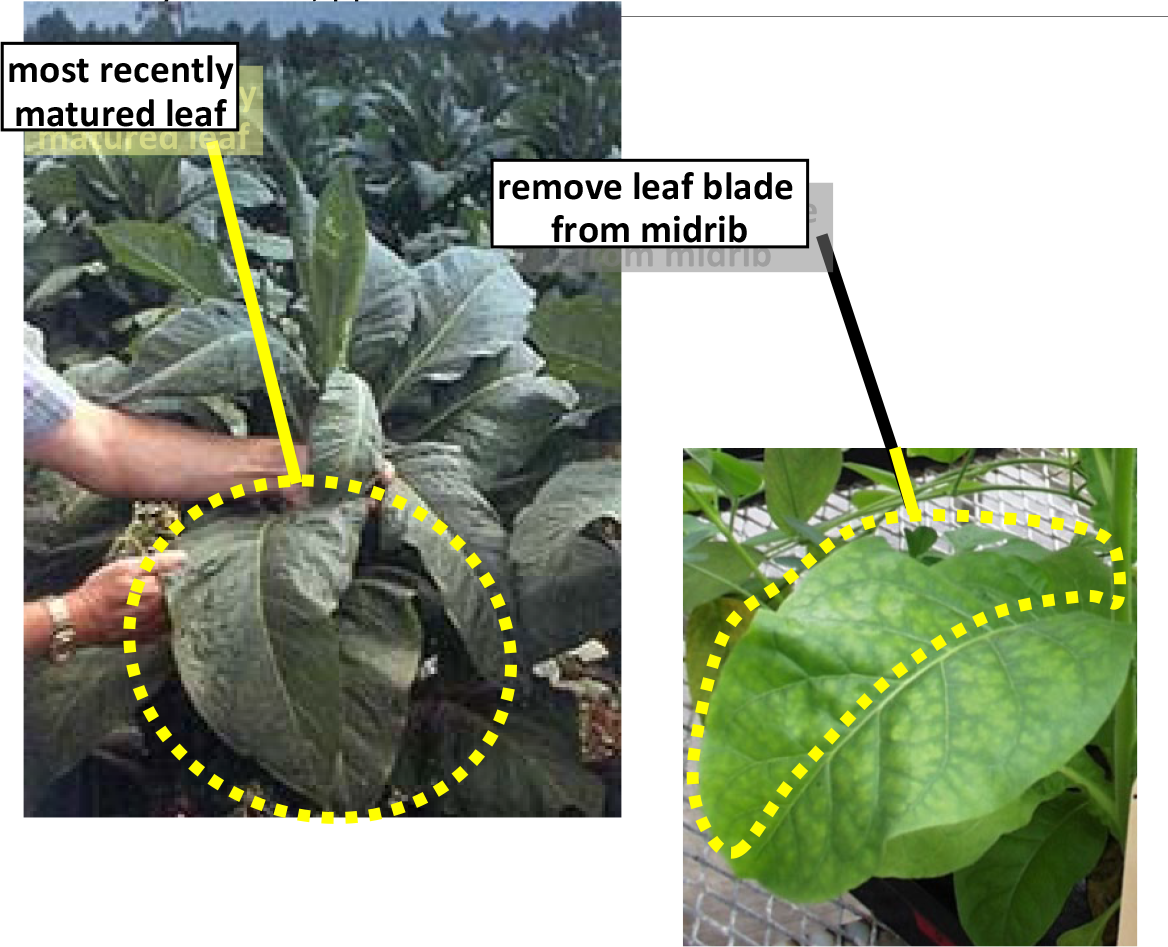
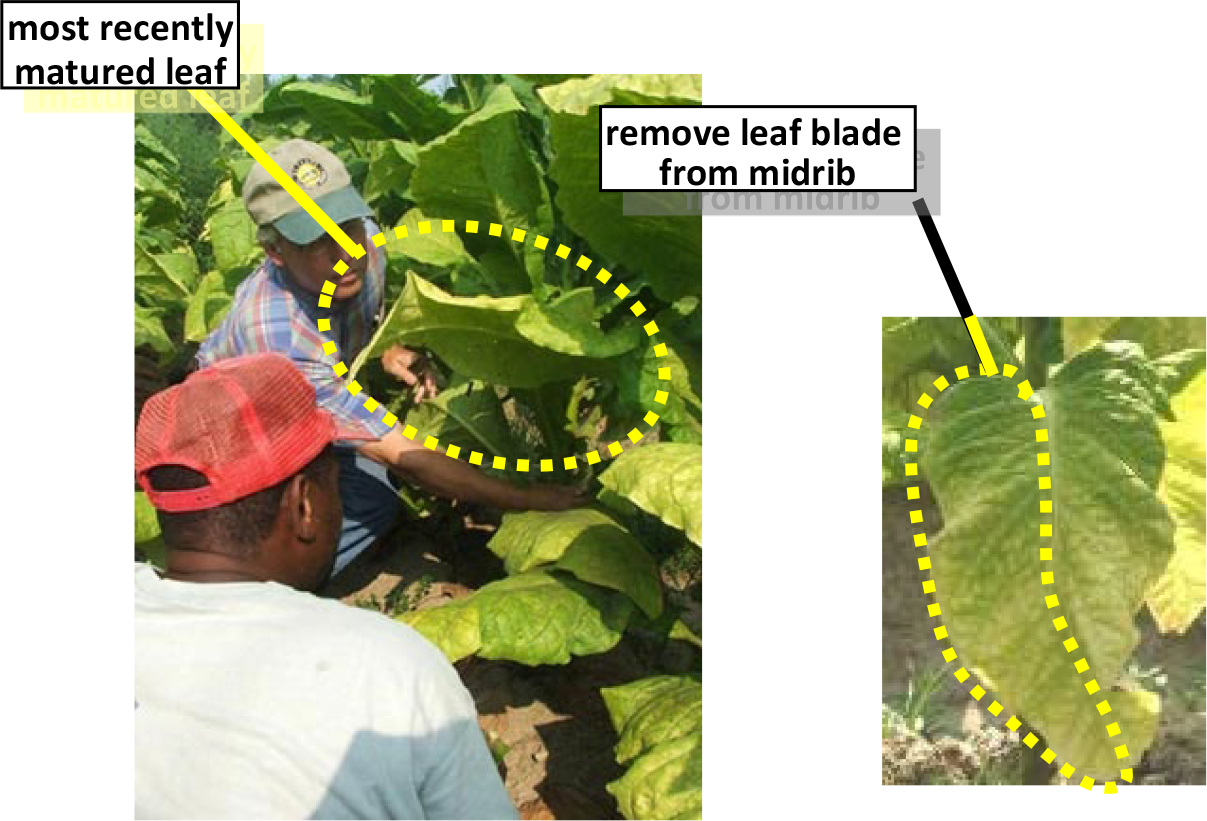
¶ B: Early growth (45 to 60 days after planting)
Plant Part: Most recently matured, fully-developed leaf.
Sampling Procedure: Collect the most recently matured leaves from 12 to 15 plants. This is the first fully developed leaf back from the growing point, generally 4th or 5th leaf back from the bud. If leaves are large, remove the lamina (blade portion of the leaf) from one side of the midrib for analysis.
| Analysis | Tissue Concentration Guidelines | |||||||
| Marginal Range | Sufficiency Range | Excessive, toxic? | ||||||
| Nitrogen, % N | 3.50 | - | 4.00 | 4.00 | - | 6.50 | ||
| Phosphorus, %P | 0.17 | - | 0.20 | 0.20 | - | 0.80 | ||
| Potassium, % K | 2.20 | - | 2.50 | 2.50 | - | 4.25 | ||
| Calcium, % Ca | 0.80 | - | 1.50 | 1.50 | - | 2.50 | ||
| Magnesium, % Mg | 0.20 | - | 0.40 | 0.40 | - | 0.75 | ||
| Sulfur, % S | 0.15 | - | 0.20 | 0.20 | - | 0.60 | ||
| Zinc, ppm Zn | 20 | - | 30 | 30 | - | 60 | ||
| Iron, ppm Fe | 50 | - | 100 | 100 | - | 500 | ||
| Manganese, ppm Mn | 25 | - | 35 | 35 | - | 350 | 1000? | |
| Copper ppm Cu | 5 | - | 10 | 10 | - | 35 | ||
| Boron, ppm B | 18 | - | 20 | 20 | - | 75 | ||
| Nitrogen-to-sulfur ratio (N:S) | 15 | - | 18 | 12 | - | 15 | ||
| Chloride, % Cl | - | - | 1.50 | |||||
| Molybdenum, ppm Mo | 0.18 | - | 0.20 | 0.20 | - | 1.00 | ||
¶ Figure B.
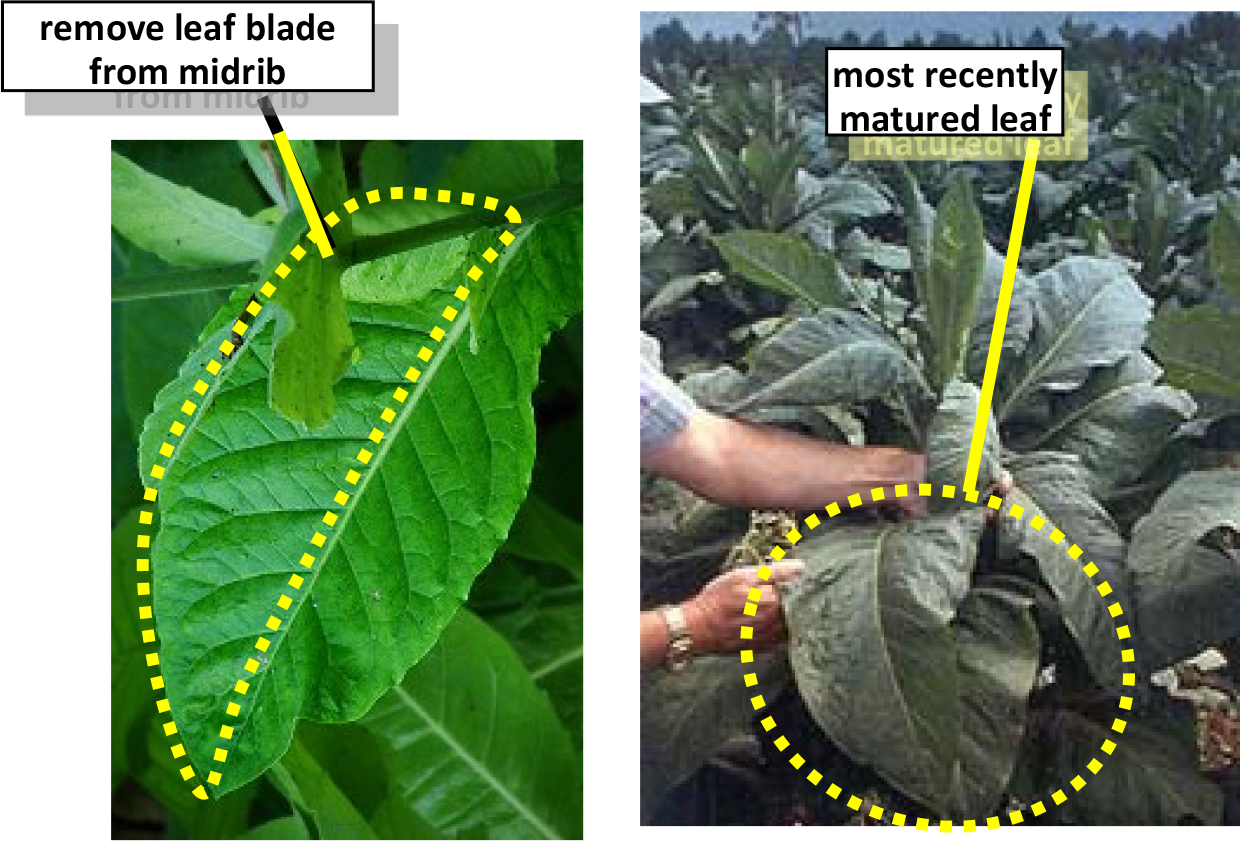
¶ C: Bloom or flowering (60 to 80 days after planting)
Plant Part: Most recently matured, fully-developed leaf
Sampling Procedure: Collect the most recently matured leaves from 10 to 15 plants. This is generally the 4th or 5th leaf back from the bud or the 2nd or 3rd leaf from the top of the stalk after topping. Remove the lamina (blade portion of the leaf) from one side of the midrib for analysis.
| Analysis | Tissue Concentration Guidelines | |||||||
| Marginal Range | Sufficiency Range | Excessive, toxic? | ||||||
| Nitrogen, % N | 3.50 | - | 4.25 | 4.25 | - | 5.50 | ||
| Phosphorus, %P | 0.20 | - | 0.27 | 0.27 | - | 0.75 | ||
| Potassium, % K | 1.75 | - | 2.50 | 2.50 | - | 4.00 | ||
| Calcium, % Ca | 0.75 | - | 1.50 | 1.50 | - | 3.50 | ||
| Magnesium, % Mg | 0.20 | - | 0.25 | 0.25 | - | 0.80 | ||
| Sulfur, % S | 0.15 | - | 0.20 | 0.20 | - | 0.60 | ||
| Zinc, ppm Zn | 20 | - | 25 | 25 | - | 80 | ||
| Iron, ppm Fe | 50 | - | 75 | 75 | - | 300 | ||
| Manganese, ppm Mn | 20 | - | 30 | 30 | - | 250 | 1000? | |
| Copper ppm Cu | 5 | - | 10 | 10 | - | 60 | ||
| Boron, ppm B | 18 | - | 20 | 20 | - | 75 | ||
| Nitrogen-to-sulfur ratio (N:S) | 15 | - | 18 | 12 | - | 15 | ||
| Chloride, % Cl | - | - | 1.50 | |||||
| Molybdenum, ppm Mo | 0.18 | - | 0.20 | 0.20 | - | 1.00 | ||
¶ Figure C.
¶ Tobacco, flue-cured (Nicotiana tabacum)
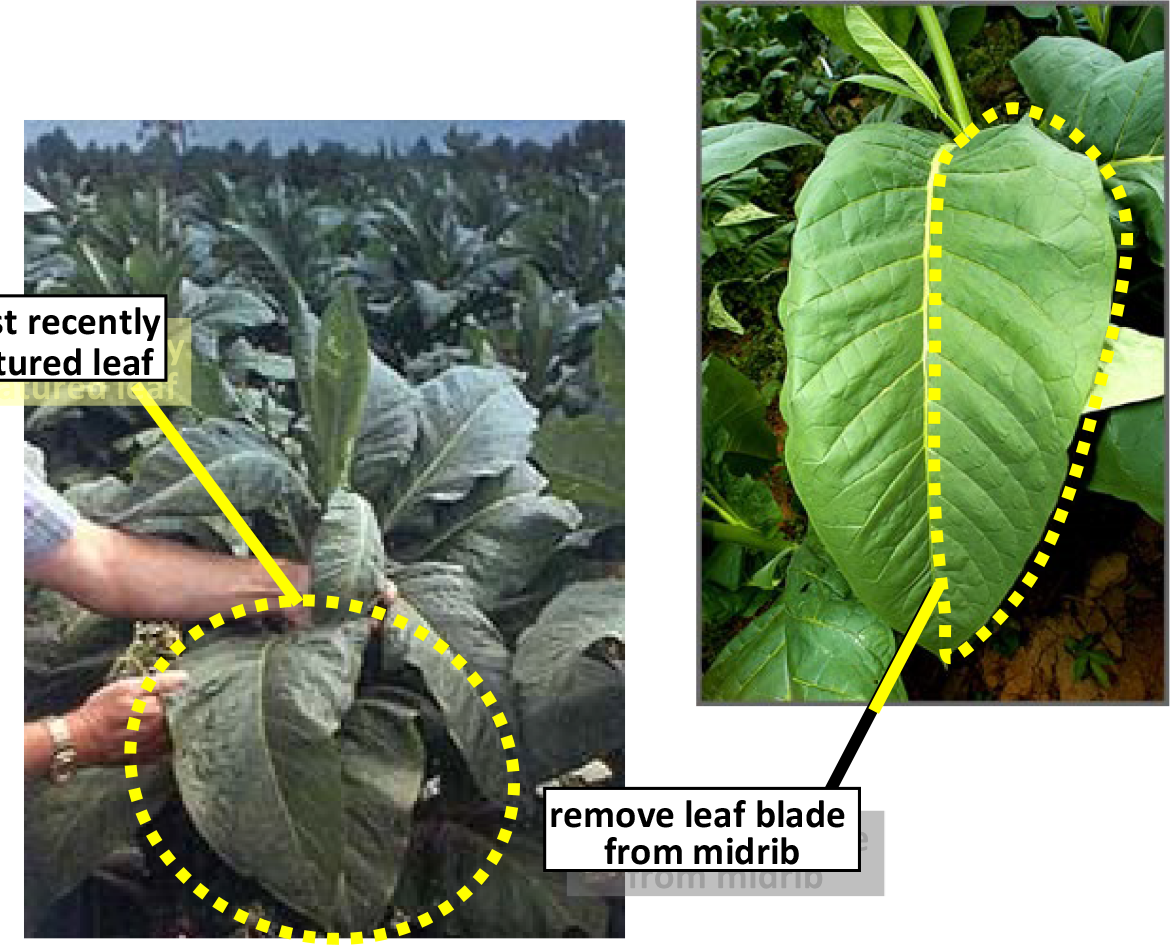
¶ D: Maturity (80 to 100 days after planting)
Plant Part: Most recently matured, fully-developed leaf.
Sampling Procedure: Collect the most recently matured leaves from 10 to 15 plants. This is generally the 2nd or 3rd leaf from the top of the stalk after topping. Remove the lamina (blade portion of the leaf) from one side of the midrib for analysis.
| Analysis | Tissue Concentration Guidelines | |||||||
| Marginal Range | Sufficiency Range | Excessive, toxic? | ||||||
| Nitrogen, % N | 2.10 | - | 2.25 | 2.25 | - | 3.50 | ||
| Phosphorus, %P | 0.15 | - | 0.17 | 0.17 | - | 0.80 | ||
| Potassium, % K | 1.30 | - | 1.60 | 1.60 | - | 3.50 | ||
| Calcium, % Ca | 0.60 | - | 0.75 | 0.75 | - | 1.50 | ||
| Magnesium, % Mg | 0.15 | - | 0.18 | 0.18 | - | 0.80 | ||
| Sulfur, % S | 0.12 | - | 0.15 | 0.15 | - | 0.60 | ||
| Zinc, ppm Zn | 15 | - | 20 | 20 | - | 60 | ||
| Iron, ppm Fe | 50 | - | 75 | 75 | - | 300 | ||
| Manganese, ppm Mn | 15 | - | 20 | 20 | - | 250 | 1000? | |
| Copper ppm Cu | 5 | - | 10 | 10 | - | 50 | ||
| Boron, ppm B | 15 | - | 18 | 18 | - | 75 | ||
| Nitrogen-to-sulfur ratio (N:S) | 15 | - | 18 | 12 | - | 15 | ||
| Chloride, % Cl | - | - | 1.50 | |||||
| Molybdenum, ppm Mo | 0.18 | - | 0.20 | 0.20 | - | 1.00 | ||
¶ Figure D.
¶ Tobacco, air-cured burley (Nicotiana tabacum)
¶ E: Maturity (80 to 100 days after planting)
Plant Part: Most recently matured, fully-developed leaf.
Sampling Procedure: Collect the most recently matured leaves from 10 to 15 plants. This is generally the 2nd or 3rd leaf from the top of the stalk after topping. Remove the lamina (blade portion of the leaf) from one side of the midrib for analysis.
| Analysis | Tissue Concentration Guidelines | |||||||
| Marginal Range | Sufficiency Range | Excessive, toxic? | ||||||
| Nitrogen, % N | 2.80 | - | 3.00 | 3.00 | - | 4.50 | ||
| Phosphorus, %P | 0.17 | - | 0.20 | 0.20 | - | 0.80 | ||
| Potassium, % K | 2.25 | - | 2.50 | 2.50 | - | 4.00 | ||
| Calcium, % Ca | 0.60 | - | 0.75 | 0.75 | - | 1.50 | ||
| Magnesium, % Mg | 0.15 | - | 0.18 | 0.18 | - | 0.80 | ||
| Sulfur, % S | 0.12 | - | 0.15 | 0.15 | - | 0.60 | ||
| Zinc, ppm Zn | 15 | - | 20 | 20 | - | 60 | ||
| Iron, ppm Fe | 50 | - | 75 | 75 | - | 300 | ||
| Manganese, ppm Mn | 15 | - | 20 | 20 | - | 250 | 1000? | |
| Copper ppm Cu | 5 | - | 10 | 10 | - | 50 | ||
| Boron, ppm B | 15 | - | 18 | 18 | - | 75 | ||
| Nitrogen-to-sulfur ratio (N:S) | 15 | - | 18 | 12 | - | 15 | ||
| Chloride, % Cl | - | - | 1.50 | |||||
| Molybdenum, ppm Mo | 0.18 | - | 0.20 | 0.20 | - | 1.00 | ||
¶ Figure E.
¶ Tobacco, flue-cured (Nicotiana tabacum)
¶ F: Harvest
Plant Part: Leaves
Sampling Procedure: To monitor nutritional status and fine-tune fertilizer programs, collect the leaves from 10 to 15 plants. To test for ripeness (harvest readiness), collect samples by stalk position: lower, middle or upper. Remove the lamina (blade portion of the leaf) from one side of the midrib for analysis.
| Analysis | Tissue Concentration Guidelines | |||||||
| Marginal Range | Sufficiency Range | Excessive, toxic? | ||||||
| Upper leaf | ||||||||
| Nitrogen, % N | 1.80 | - | 2.10 | 2.10 | - | 3.50 | ||
| Phosphorus, % P | 0.11 | - | 0.14 | 0.14 | - | 0.45 | ||
| Potassium, % K | 1.30 | - | 1.50 | 1.50 | - | 3.00 | ||
| Calcium, % Ca | 0.80 | - | 1.00 | 1.00 | - | 2.50 | ||
| Magnesium, % Mg | 0.17 | - | 0.20 | 0.20 | - | 0.75 | ||
| Middle leaf | ||||||||
| Nitrogen, % N | 1.40 | - | 1.60 | 1.60 | - | 2.50 | ||
| Phosphorus, %P | 0.10 | - | 0.13 | 0.13 | - | 0.45 | ||
| Potassium, % K | 1.30 | - | 1.50 | 1.50 | - | 3.00 | ||
| Calcium, % Ca | 0.80 | - | 1.00 | 1.00 | - | 2.50 | ||
| Magnesium, % Mg | 0.17 | - | 0.20 | 0.20 | - | 0.75 | ||
| Lower leaf | ||||||||
| Nitrogen, % N | 1.10 | - | 1.30 | 1.30 | - | 2.20 | ||
| Phosphorus, %P | 0.10 | - | 0.12 | 0.12 | - | 0.40 | ||
| Potassium, % K | 1.10 | - | 1.30 | 1.30 | - | 2.80 | ||
| Calcium, % Ca | 0.80 | - | 1.00 | 1.00 | - | 2.50 | ||
| Magnesium, % Mg | 0.15 | - | 0.18 | 0.18 | - | 0.65 | ||
| All positions | ||||||||
| Sulfur, % S | 0.12 | - | 0.15 | 0.15 | - | 0.60 | ||
| Zinc, ppm Zn | 15 | - | 18 | 18 | - | 75 | ||
| Iron, ppm Fe | 40 | - | 50 | 50 | - | 200 | ||
| Manganese, ppm Mn | 18 | - | 20 | 20 | - | 350 | 1000? | |
| Copper ppm Cu | 3 | - | 5 | 5 | - | 25 | ||
| Boron, ppm B | 15 | - | 18 | 18 | - | 35 | ||
| Chloride, % Cl | - | - | 1.50 | |||||