⇦ Back to Soil Fertility and Plant Nutrition Home
¶ Sudangrass (Sorghum bicolor, Sorghum sudanense)
| Table No: | Growth stage: | Plant part: |
| Table A | Emergence to 12-inches tall | Whole plan |
| Table B | Over 12-inches tall | Whole plan |
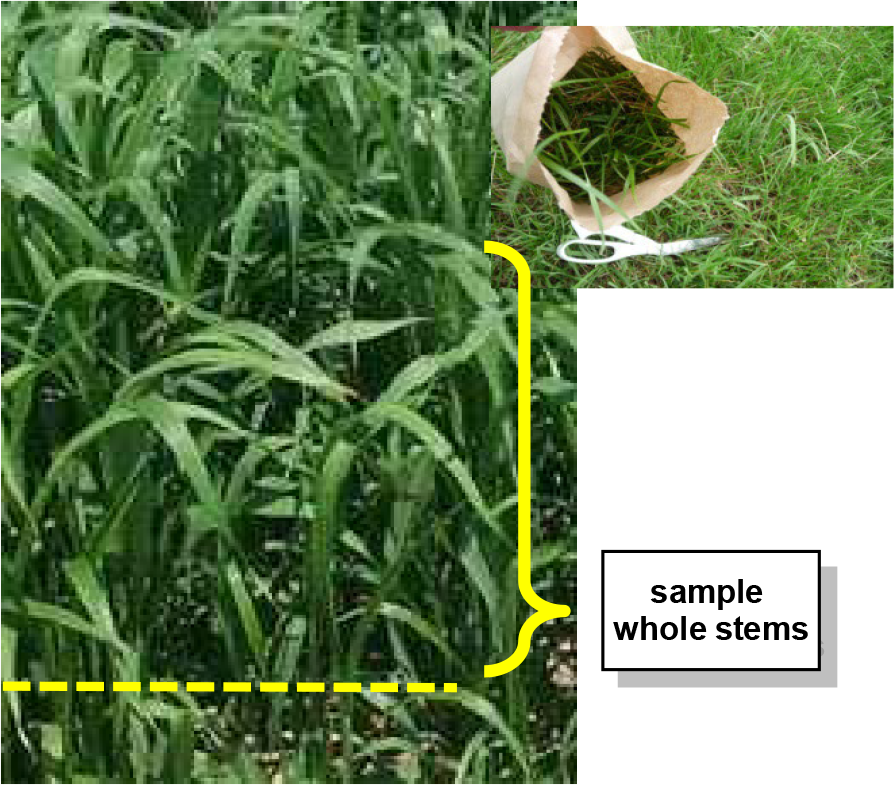
¶ A: Emergence to 12-inches tall
Plant Part: Whole plant
Sampling Procedure: Collect 15 to 20 whole plants that represent the field condition. Cut plants off about one-half inch above ground level. Do not include soil or roots in the sample. Pack loosely in paper sampling bag to ship.
| Analysis | Tissue Concentration Guidelines | ||||||||
| Low/Marginal Range | Sufficiency Range | Excessive, toxic? | |||||||
| Nitrogen, % N | 1.60 | - | 2.00 | 2.00 | - | 3.00 | |||
| Phosphorus, %P | 0.20 | - | 0.30 | 0.30 | - | 0.60 | |||
| Potassium, % K | 1.40 | - | 1.60 | 1.60 | - | 2.20 | |||
| Calcium, % Ca | 0.15 | - | 0.20 | 0.20 | - | 0.50 | |||
| Magnesium, % Mg | 0.20 | - | 0.25 | 0.25 | - | 0.50 | |||
| Sulfur, % S | 0.05 | - | 0.10 | 0.10 | - | 0.25 | |||
| Zinc, ppm Zn | 10 | - | 20 | 20 | - | 50 | |||
| Iron, ppm Fe | 10 | - | 25 | 25 | - | 300 | |||
| Manganese, ppm Mn | 15 | - | 30 | 30 | - | 200 | |||
| Copper ppm Cu | 2 | - | 5 | 5 | - | 20 | |||
| Boron, ppm B | 5 | - | 10 | 10 | - | 20 | |||
| Nitrogen-to-sulfur ratio (N:S) | 10 | - | 15 | ||||||
| Sodium, % Na | 0.25 | - | 1.00 | ||||||
| Chloride, % Cl | n/a | ||||||||
¶ Figure A.
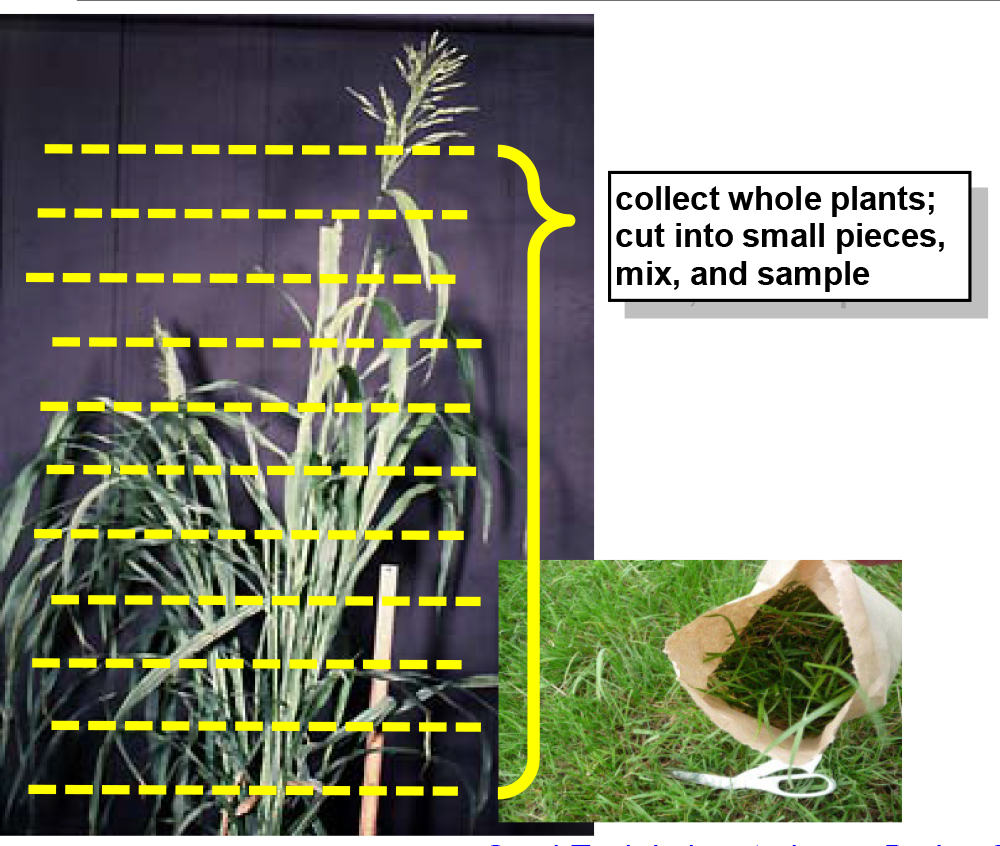
¶ B: Over 12-inches tall
Plant Part: Whole plant
Sampling Procedure: Collect 15 to 25 plants, cutting above ground level. Chop plants into smaller pieces, about two to three inches long. Mix pieces thoroughly, then remove two or three handfulls for laboratory analysis. Pack loosely in paper bag for shipment. Do not use plastic containers.
| Analysis | Tissue Concentration Guidelines | ||||||||
| Low/Marginal Range | Sufficiency Range | Excessive, toxic? | |||||||
| Nitrogen, % N | 1.20 | - | 1.50 | 1.50 | - | 2.50 | |||
| Phosphorus, %P | 0.15 | - | 0.20 | 0.20 | - | 0.60 | |||
| Potassium, % K | 1.40 | - | 1.60 | 1.60 | - | 2.20 | |||
| Calcium, % Ca | 0.15 | - | 0.20 | 0.20 | - | 0.50 | |||
| Magnesium, % Mg | 0.20 | - | 0.25 | 0.25 | - | 0.50 | |||
| Sulfur, % S | 0.05 | - | 0.10 | 0.10 | - | 0.25 | |||
| Zinc, ppm Zn | 10 | - | 20 | 20 | - | 50 | |||
| Iron, ppm Fe | 25 | - | 50 | 50 | - | 500 | |||
| Manganese, ppm Mn | 15 | - | 30 | 30 | - | 200 | |||
| Copper ppm Cu | 2 | - | 5 | 5 | - | 20 | |||
| Boron, ppm B | 5 | - | 10 | 10 | - | 20 | |||
| Nitrogen-to-sulfur ratio (N:S) | 10 | - | 15 | ||||||
| Sodium, % Na | 0.25 | - | 1.00 | ||||||
| Chloride, % Cl | n/a | ||||||||
¶ Figure B.
Note: Interpretations are based the relationship between nutrient levels in a particular part of a "standard" tissue in a specific time in the growing season. These plant tissue ranges and interpretations are not considered valid with plant parts or growth stages other than those specified. These interpretations are developed from data collected across a wide range of crop, soil, and climate conditions.
Results from a single sample may be affected by time of day, climatic conditions, plant stress, age, or disease, that are not directly related to fertility status. Nutrient concentrations are not uniform throughout the plant and may change as the tissue matures.Tissue analysis trends should be evaluated by variety, growing season, and yield/quality goals. Collecting plant samples from the same location as soil samples allows comparison of soil nutrient availability with plant nutrient status.Low nutrient levels may be due to deficiency or to dilution by intensive growth. High or excessive nutrient levels may be a sign of restricted growth allowing nutrients to accumulate in the plant tissue. Nutrient imbalance may be secondary to the primary problem.