⇦ Back to Soil Fertility and Plant Nutrition Home
¶ Summer squash (Curbita species)
(*includes acorn squash, butternut squash, cushaw squash, Hubbard squash, and others)
| Table No: | Growth stage: | Plant part: |
| Table A | Early bloom | Mature leaves |
| Table B | Midbloom to early fruiting | Mature leaves |
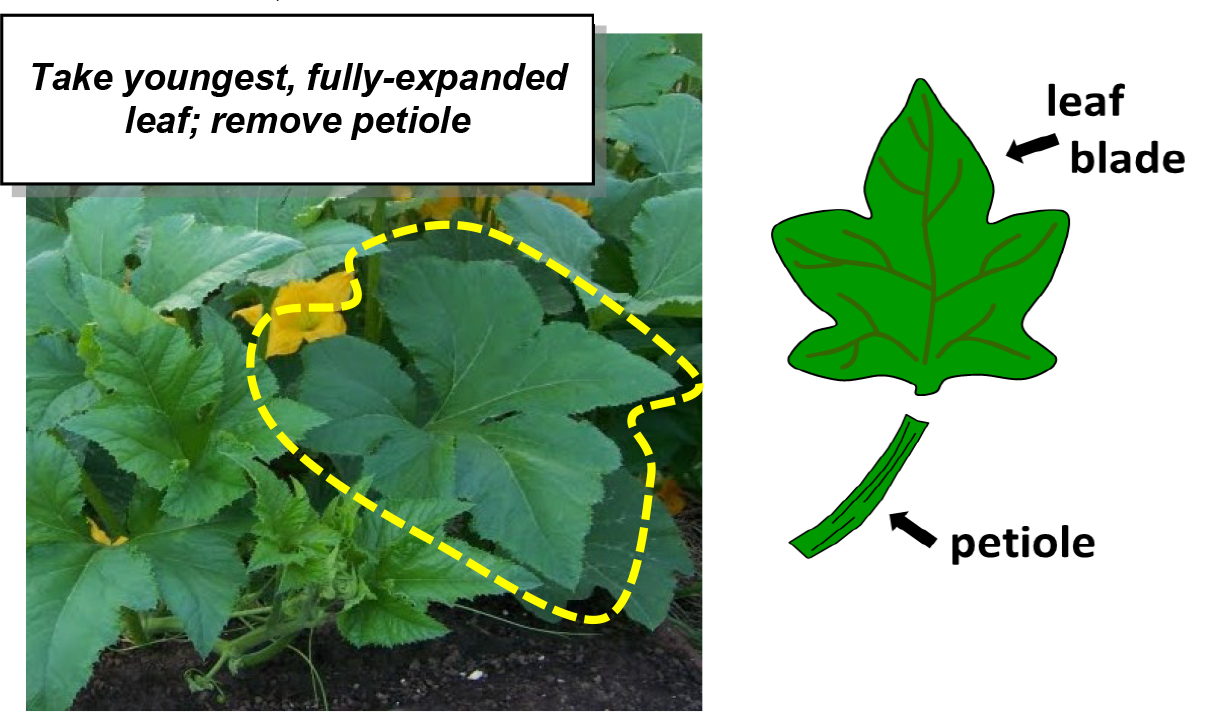
¶ A: Early bloom
Plant Part: Most recently mature or first fully expanded leaf
Sampling Procedure: Collect first fully expanded leaf back from the growing point, generally the 4th or 5th leaf from the terminal leaf. Collect leaf blades from 20 to 25 plants, discarding petioles. Snap off leaves. Using knife or scissors may spread disease. Mature leaf is full-sized, has essentially ceased to expand, and has turned from juvenile light-green color to a darker-green color.
| Analysis | Tissue Concentration Guidelines | ||||||||
| Low/Marginal Range | Sufficiency Range | Excessive, toxic? | |||||||
| Nitrogen, % N | 3.00 | - | 3.20 | 3.20 | - | 5.20 | |||
| Phosphorus, %P | 0.30 | - | 0.35 | 0.30 | - | 1.10 | |||
| Potassium, % K | 3.00 | - | 3.20 | 3.20 | - | 5.50 | |||
| Calcium, % Ca | 0.90 | - | 1.20 | 1.20 | - | 2.00 | |||
| Magnesium, % Mg | 0.30 | - | 0.35 | 0.35 | - | 0.80 | |||
| Sulfur, % S | 0.25 | - | 0.30 | 0.30 | - | 1.00 | |||
| Zinc, ppm Zn | 20 | - | 25 | 25 | - | 200 | 500 | - | 750 |
| Iron, ppm Fe | 40 | - | 50 | 50 | - | 400 | |||
| Manganese, ppm Mn | 40 | - | 50 | 50 | - | 300 | 600 | - | 800 |
| Copper ppm Cu | 7 | - | 10 | 10 | - | 30 | |||
| Boron, ppm B | 20 | - | 25 | 25 | - | 75 | 120 | - | 180 |
| Nitrogen-to-sulfur ratio (N:S) | 0.25 | - | 0.50 | ||||||
| Sodium, % Na | 0.30 | - | 1.00 | ||||||
| Chloride, % Cl | |||||||||
| Nitrate, ppm NO3-N | |||||||||
| Phosphate, ppm PO4-P | |||||||||
¶ Figure A.
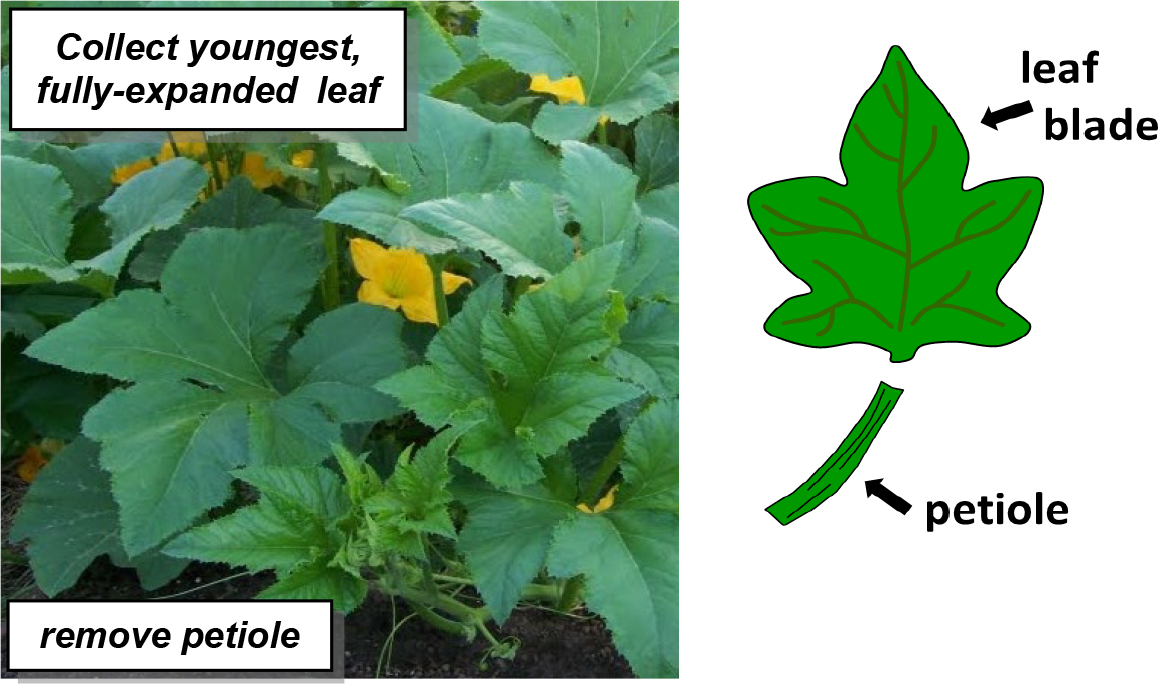
¶ B: Midbloom to early fruiting
Plant Part: Most recently mature or first fully expanded leaf
Sampling Procedure: Collect first fully expanded leaf back from the growing point, generally the 4th or 5th leaf from the terminal leaf. Collect leaf blades from 20 to 25 plants, discarding petioles. Snap off leaves. Using knife or scissors may spread disease. Mature leaf is full-sized, has essentially ceased to expand, and has turned from juvenile light-green color to a darker-green color
| Analysis | Tissue Concentration Guidelines | ||||||||
| Low/Marginal Range | Sufficiency Range | Excessive, toxic? | |||||||
| Nitrogen, % N | 2.90 | - | 3.10 | 3.10 | - | 4.50 | |||
| Phosphorus, %P | 0.30 | - | 0.35 | 0.30 | - | 0.90 | |||
| Potassium, % K | 2.00 | - | 2.70 | 2.70 | - | 4.50 | |||
| Calcium, % Ca | 1.20 | - | 1.50 | 1.50 | - | 2.50 | |||
| Magnesium, % Mg | 0.30 | - | 0.35 | 0.35 | - | 1.00 | |||
| Sulfur, % S | 0.20 | - | 0.25 | 0.25 | - | 0.80 | |||
| Zinc, ppm Zn | 20 | - | 25 | 25 | - | 200 | 400 | - | 600 |
| Iron, ppm Fe | 50 | - | 60 | 60 | - | 400 | |||
| Manganese, ppm Mn | 40 | - | 50 | 50 | - | 400 | 600 | - | 800 |
| Copper ppm Cu | 5 | - | 7 | 7 | - | 25 | |||
| Boron, ppm B | 25 | - | 30 | 30 | - | 70 | 120 | - | 180 |
| Nitrogen-to-sulfur ratio (N:S) | 0.25 | - | 0.50 | ||||||
| Sodium, % Na | 0.30 | - | 1.00 | ||||||
| Chloride, % Cl | |||||||||
| Nitrate, ppm NO3-N | |||||||||
| Phosphate, ppm PO4-P | |||||||||
¶ Figure B.
Note: Interpretations are based the relationship between nutrient levels in a particular part of a "standard" tissue in a specific time in the growing season. These plant tissue ranges and interpretations are not considered valid with plant parts or growth stages other than those specified. These interpretations are developed from data collected across a wide range of crop, soil, and climate conditions.
Results from a single sample may be affected by time of day, climatic conditions, plant stress, age, or disease, that are not directly related to fertility status. Nutrient concentrations are not uniform throughout the plant and may change as the tissue matures.Tissue analysis trends should be evaluated by variety, growing season, and yield/quality goals. Collecting plant samples from the same location as soil samples allows comparison of soil nutrient availability with plant nutrient status.Low nutrient levels may be due to deficiency or to dilution by intensive growth. High or excessive nutrient levels may be a sign of restricted growth allowing nutrients to accumulate in the plant tissue. Nutrient imbalance may be secondary to the primary problem