⇦ Back to Soil Fertility and Plant Nutrition Home
¶ Soybeans (Glycine max)
| Table No: | Growth stage: | Plant part: |
| Table A | First to third trifoliate (growth stage V1 to V3) | Whole plant |
| Table B | Fourth trifoliate to first flower (growth stage V4 to R1) | Youngest, fully mature leaves |
| Table C | Full flower to early pod fill (growth stage R2 to R4) | Youngest, fully mature leaves |
| Table D | Beginning seed to full seed (growth stage R5 to R6) | Youngest, fully mature leaves |
| Table E | Soybean Nutrient Uptake |
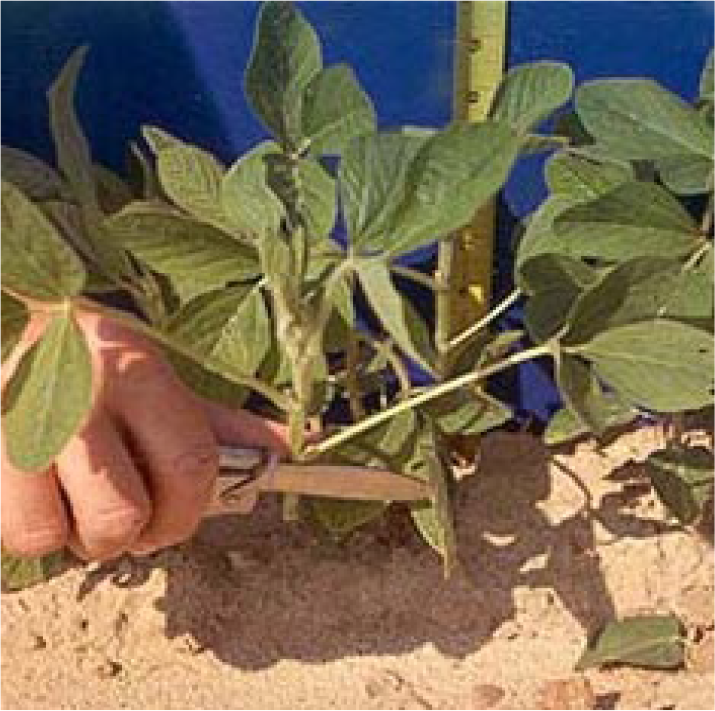
¶ A: First to third trifoliate (growth stage V1 to V3)
Plant Part: Whole plant
Sampling Procedure: Collect 20 to 30 whole plants. Cut off about 1/2-inch above ground level to avoid contaminating the sample with soil particles. Do not include roots in sample.
Growth Stage Description:
- V1: Plants have one set of fully unfolded trifoliolate leaves
- V3: Plants are about 7-9 inches tall with four nodes (three unfolded trifoliate leaves).
| Analysis | Tissue Concentration Guidelines | ||||||||
| Very Low to Low | Typical Range | High to Very High | |||||||
| Nitrogen, % N | 4.10 | - | 4.70 | 4.70 | - | 5.70 | 5.70 | - | 6.10 |
| Phosphorus, %P | 0.35 | - | 0.40 | 0.40 | - | 0.50 | 0.50 | - | 0.60 |
| Potassium, % K | 2.30 | - | 2.60 | 2.60 | - | 3.20 | 3.20 | - | 3.40 |
| Calcium, % Ca | 1.10 | - | 1.28 | 1.28 | - | 1.70 | 1.70 | - | 2.00 |
| Magnesium, % Mg | 0.41 | - | 0.45 | 0.45 | - | 0.60 | 0.60 | - | 0.70 |
| Sulfur, % S | 0.26 | - | 0.28 | 0.28 | - | 0.33 | 0.33 | - | 0.36 |
| Zinc, ppm Zn | 37 | - | 43 | 43 | - | 60 | 60 | - | 70 |
| Iron, ppm Fe | 160 | - | 215 | 215 | - | 580 | 580 | - | 1000 |
| Manganese, ppm Mn | 65 | - | 85 | 85 | - | 150 | 180 | - | 200 |
| Copper ppm Cu | 7 | - | 9 | 9 | - | 13 | 13 | - | 15 |
| Boron, ppm B | 31 | - | 35 | 35 | - | 45 | 45 | - | 55 |
| Nitrogen-to-sulfur ratio (N:S) | 14 | - | 16 | 16 | - | 19 | 19 | - | 20 |
| Sodium, % Na | 0.005 | - | 0.010 | 0.010 | - | 0.012 | 0.012 | - | 0.020 |
| Chloride, % Cl | - | - | - | ||||||
¶ Figure A.
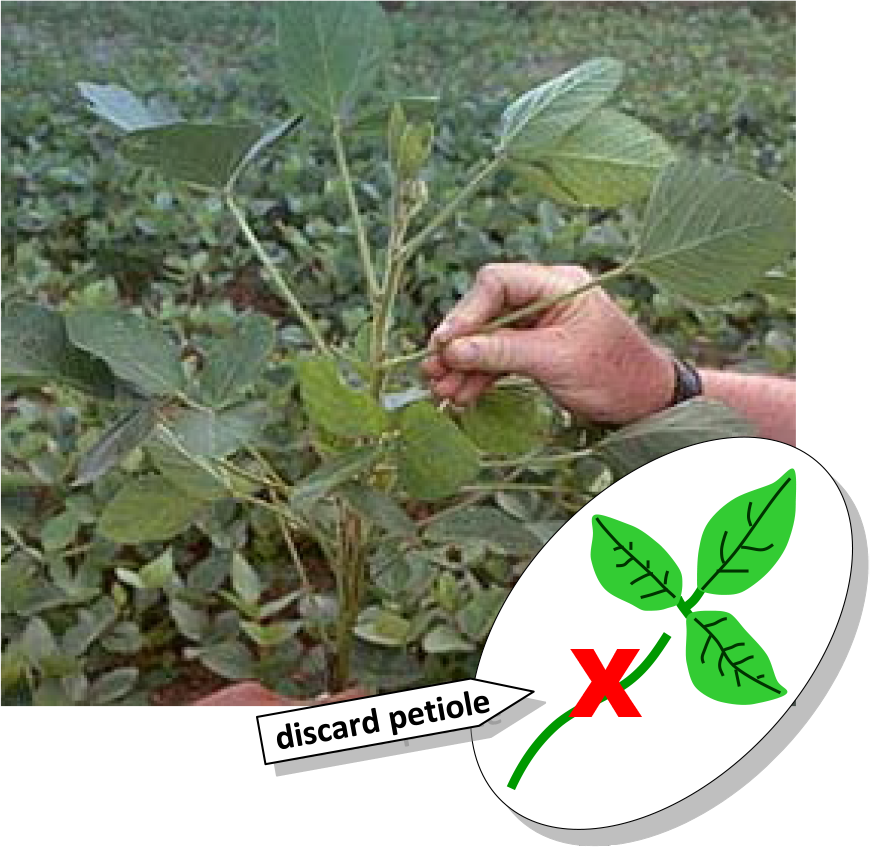
¶ B: Fourth trifoliate to first flower (growth stage V4 to R1)
Plant Part: Youngest, fully mature leaves
Sampling Procedure: Collect one set of trifoliates from 15 to 20 plants. Start from top of plant and select leaves from the most recently expanded, fully mature trifoliate. Discard the petiole.
Growth Stage Description:
- V4: Plants will be about 9 to 10 inches tall with five nodes of unfolded trifoliates.
- R1: Plants will be about 15 to 18 inches tall with at least one flower on any node.
| Analysis | Tissue Concentration Guidelines | ||||||||
| Very Low to Low | Typical Range | High to Very High | |||||||
| Nitrogen, % N | 4.75 | - | 5.25 | 5.25 | - | 6.00 | 6.00 | - | 6.30 |
| Phosphorus, %P | 0.32 | - | 0.38 | 0.38 | - | 0.55 | 0.55 | - | 0.60 |
| Potassium, % K | 1.75 | - | 2.20 | 2.20 | - | 2.80 | 2.80 | - | 3.00 |
| Calcium, % Ca | 0.95 | - | 1.10 | 1.10 | - | 1.40 | 1.40 | - | 1.65 |
| Magnesium, % Mg | 0.37 | - | 0.40 | 0.40 | - | 0.55 | 0.55 | - | 0.60 |
| Sulfur, % S | 0.26 | - | 0.28 | 0.28 | - | 0.34 | 0.34 | - | 0.36 |
| Zinc, ppm Zn | 35 | - | 40 | 40 | - | 60 | 60 | - | 65 |
| Iron, ppm Fe | 120 | - | 150 | 150 | - | 320 | 320 | - | 550 |
| Manganese, ppm Mn | 55 | - | 70 | 70 | - | 125 | 125 | - | 165 |
| Copper ppm Cu | 8 | - | 10 | 10 | - | 13 | 13 | - | 15 |
| Boron, ppm B | 34 | - | 38 | 38 | - | 50 | 50 | - | 60 |
| Nitrogen-to-sulfur ratio (N:S) | 16 | - | 17 | 17 | - | 19 | 19 | - | 20 |
| Sodium, % Na | 0.005 | - | 0.010 | 0.010 | - | 0.012 | 0.012 | - | 0.016 |
| Chloride, % Cl | - | - | 0.300 | - | 1.000 | ||||
¶ Figure B.
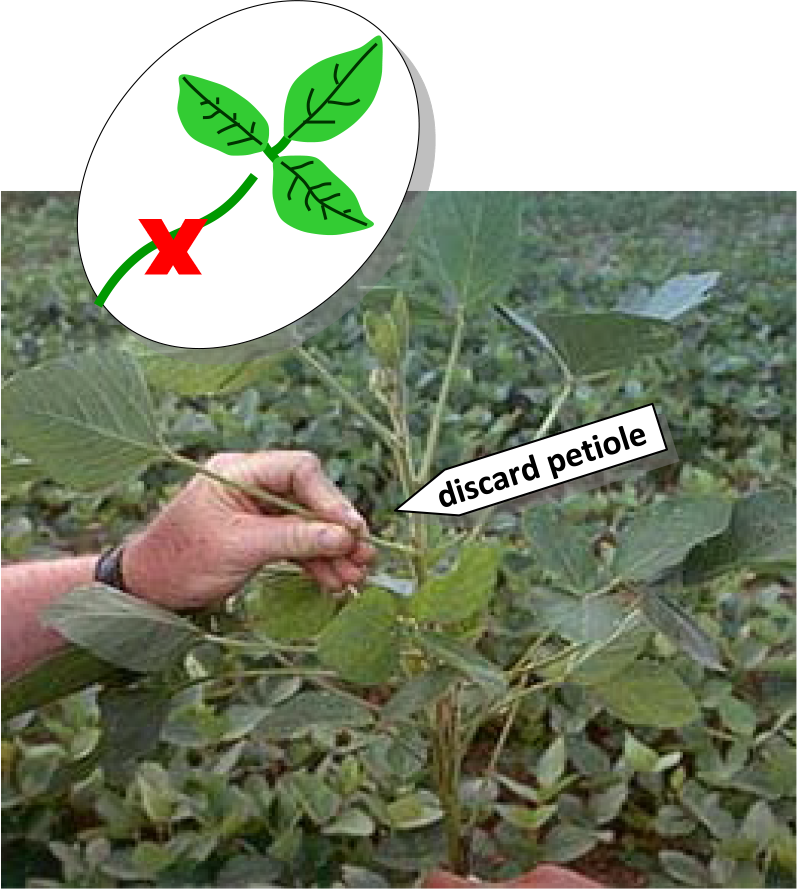
¶ C: Full flower to early pod fill (growth stage R2 to R4)
Plant Part: Youngest, fully mature leaves
Sampling Procedure: Collect one set of trifoliates from 15 to 20 plants. Start from top of plant and select leaves from the most recently expanded, fully mature trifoliate. Discard the petiole.
Growth Stage Description:
- R2: Plants have an open flower at one of the two uppermost nodes.
- R4: Plants have a pod which is at least ¾ inch long on at least one of the four upper nodes of the main stem . Seeds have not started to form.
| Analysis | Tissue Concentration Guidelines | ||||||||
| Very Low to Low | Typical Range | High to Very High | |||||||
| Nitrogen, % N | 4.55 | - | 5.20 | 5.20 | - | 6.20 | 6.20 | - | 6.50 |
| Phosphorus, %P | 0.31 | - | 0.37 | 0.37 | - | 0.53 | 0.53 | - | 0.62 |
| Potassium, % K | 1.65 | - | 2.00 | 2.00 | - | 2.50 | 2.50 | - | 2.75 |
| Calcium, % Ca | 0.95 | - | 1.00 | 1.00 | - | 1.30 | 1.30 | - | 1.70 |
| Magnesium, % Mg | 0.30 | - | 0.34 | 0.34 | - | 0.47 | 0.47 | - | 0.55 |
| Sulfur, % S | 0.26 | - | 0.29 | 0.29 | - | 0.34 | 0.34 | - | 0.36 |
| Zinc, ppm Zn | 37 | - | 42 | 42 | - | 57 | 57 | - | 67 |
| Iron, ppm Fe | 105 | - | 120 | 120 | - | 165 | 165 | - | 230 |
| Manganese, ppm Mn | 60 | - | 75 | 75 | - | 120 | 120 | - | 155 |
| Copper ppm Cu | 8 | - | 10 | 10 | - | 13 | 13 | - | 14 |
| Boron, ppm B | 39 | - | 44 | 44 | - | 60 | 60 | - | 67 |
| Nitrogen-to-sulfur ratio (N:S) | 16 | - | 17 | 17 | - | 20 | 20 | - | 21 |
| Sodium, % Na | 0.005 | - | 0.010 | 0.010 | - | 0.013 | 0.013 | - | 0.018 |
| Chloride, % Cl | - | - | - | ||||||
¶ Figure C.
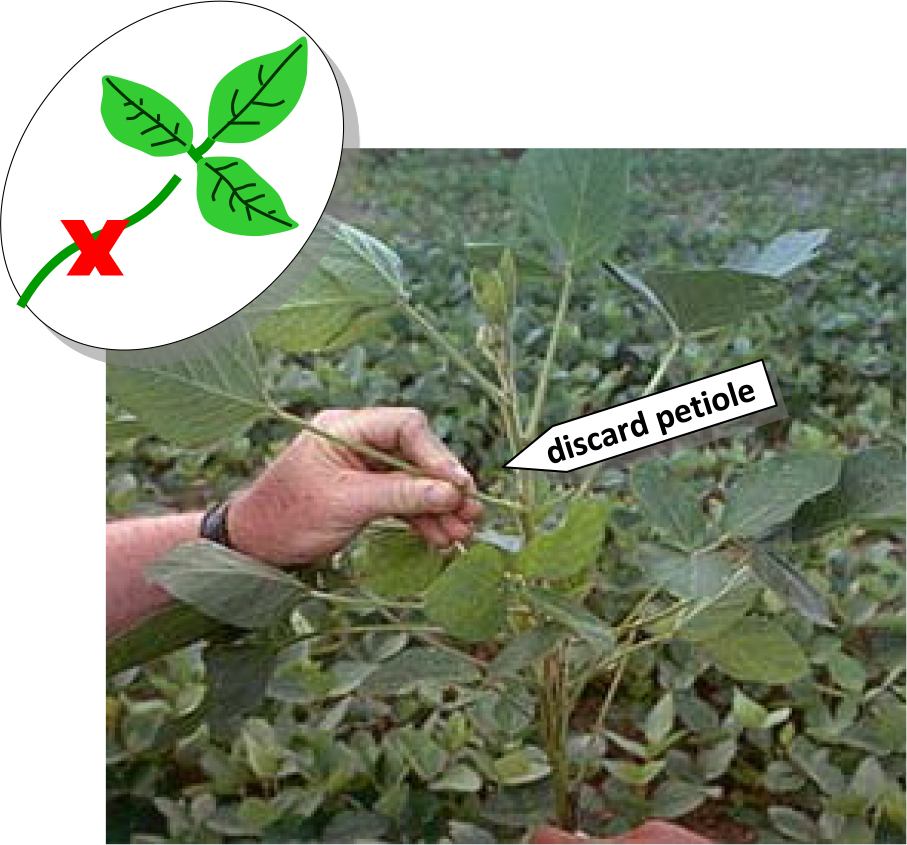
¶ D: Beginning seed to full seed (growth stage R5 to R6)
Plant Part: Youngest, fully mature leaves
Sampling Procedure: Collect one set of trifoliates from 15 to 20 plants. Start from top of plant and select leaves from the most recently expanded, fully mature trifoliate. Discard the petiole.
Growth Stage Description:
- R5: Plants have a seed that is 1/8th inch long in a pod located on one of the four uppermost nodes on the main stem.
- R6: Plants have a pod containing a green seed that fills the pod capacity at one of the four uppermost nodes on the main stem.
| Analysis | Tissue Concentration Guidelines | ||||||||
| Very Low to Low | Typical Range | High to Very High | |||||||
| Nitrogen, % N | 3.80 | - | 4.70 | 4.70 | - | 6.00 | 6.00 | - | 6.20 |
| Phosphorus, %P | 0.27 | - | 0.29 | 0.29 | - | 0.47 | 0.47 | - | 0.55 |
| Potassium, % K | 1.25 | - | 1.65 | 1.65 | - | 2.35 | 2.35 | - | 2.50 |
| Calcium, % Ca | 0.90 | - | 1.05 | 1.05 | - | 1.70 | 1.70 | - | 2.35 |
| Magnesium, % Mg | 0.21 | - | 0.24 | 0.24 | - | 0.45 | 0.45 | - | 0.53 |
| Sulfur, % S | 0.24 | - | 0.26 | 0.26 | - | 0.31 | 0.31 | - | 0.34 |
| Zinc, ppm Zn | 30 | - | 38 | 38 | - | 55 | 55 | - | 70 |
| Iron, ppm Fe | 100 | - | 105 | 105 | - | 150 | 150 | - | 220 |
| Manganese, ppm Mn | 60 | - | 80 | 80 | - | 155 | 155 | - | 225 |
| Copper ppm Cu | 6 | - | 8 | 8 | - | 11 | 11 | - | 12 |
| Boron, ppm B | 36 | - | 45 | 45 | - | 60 | 60 | - | 70 |
| Nitrogen-to-sulfur ratio (N:S) | 14 | - | 17 | 17 | - | 20 | 20 | - | 21 |
| Sodium, % Na | less than 0.010 | 0.010 | 0.010 | - | 0.011 | ||||
| Chloride, % Cl | 0.300 | - | 1.000 | ||||||
¶ Figure D.
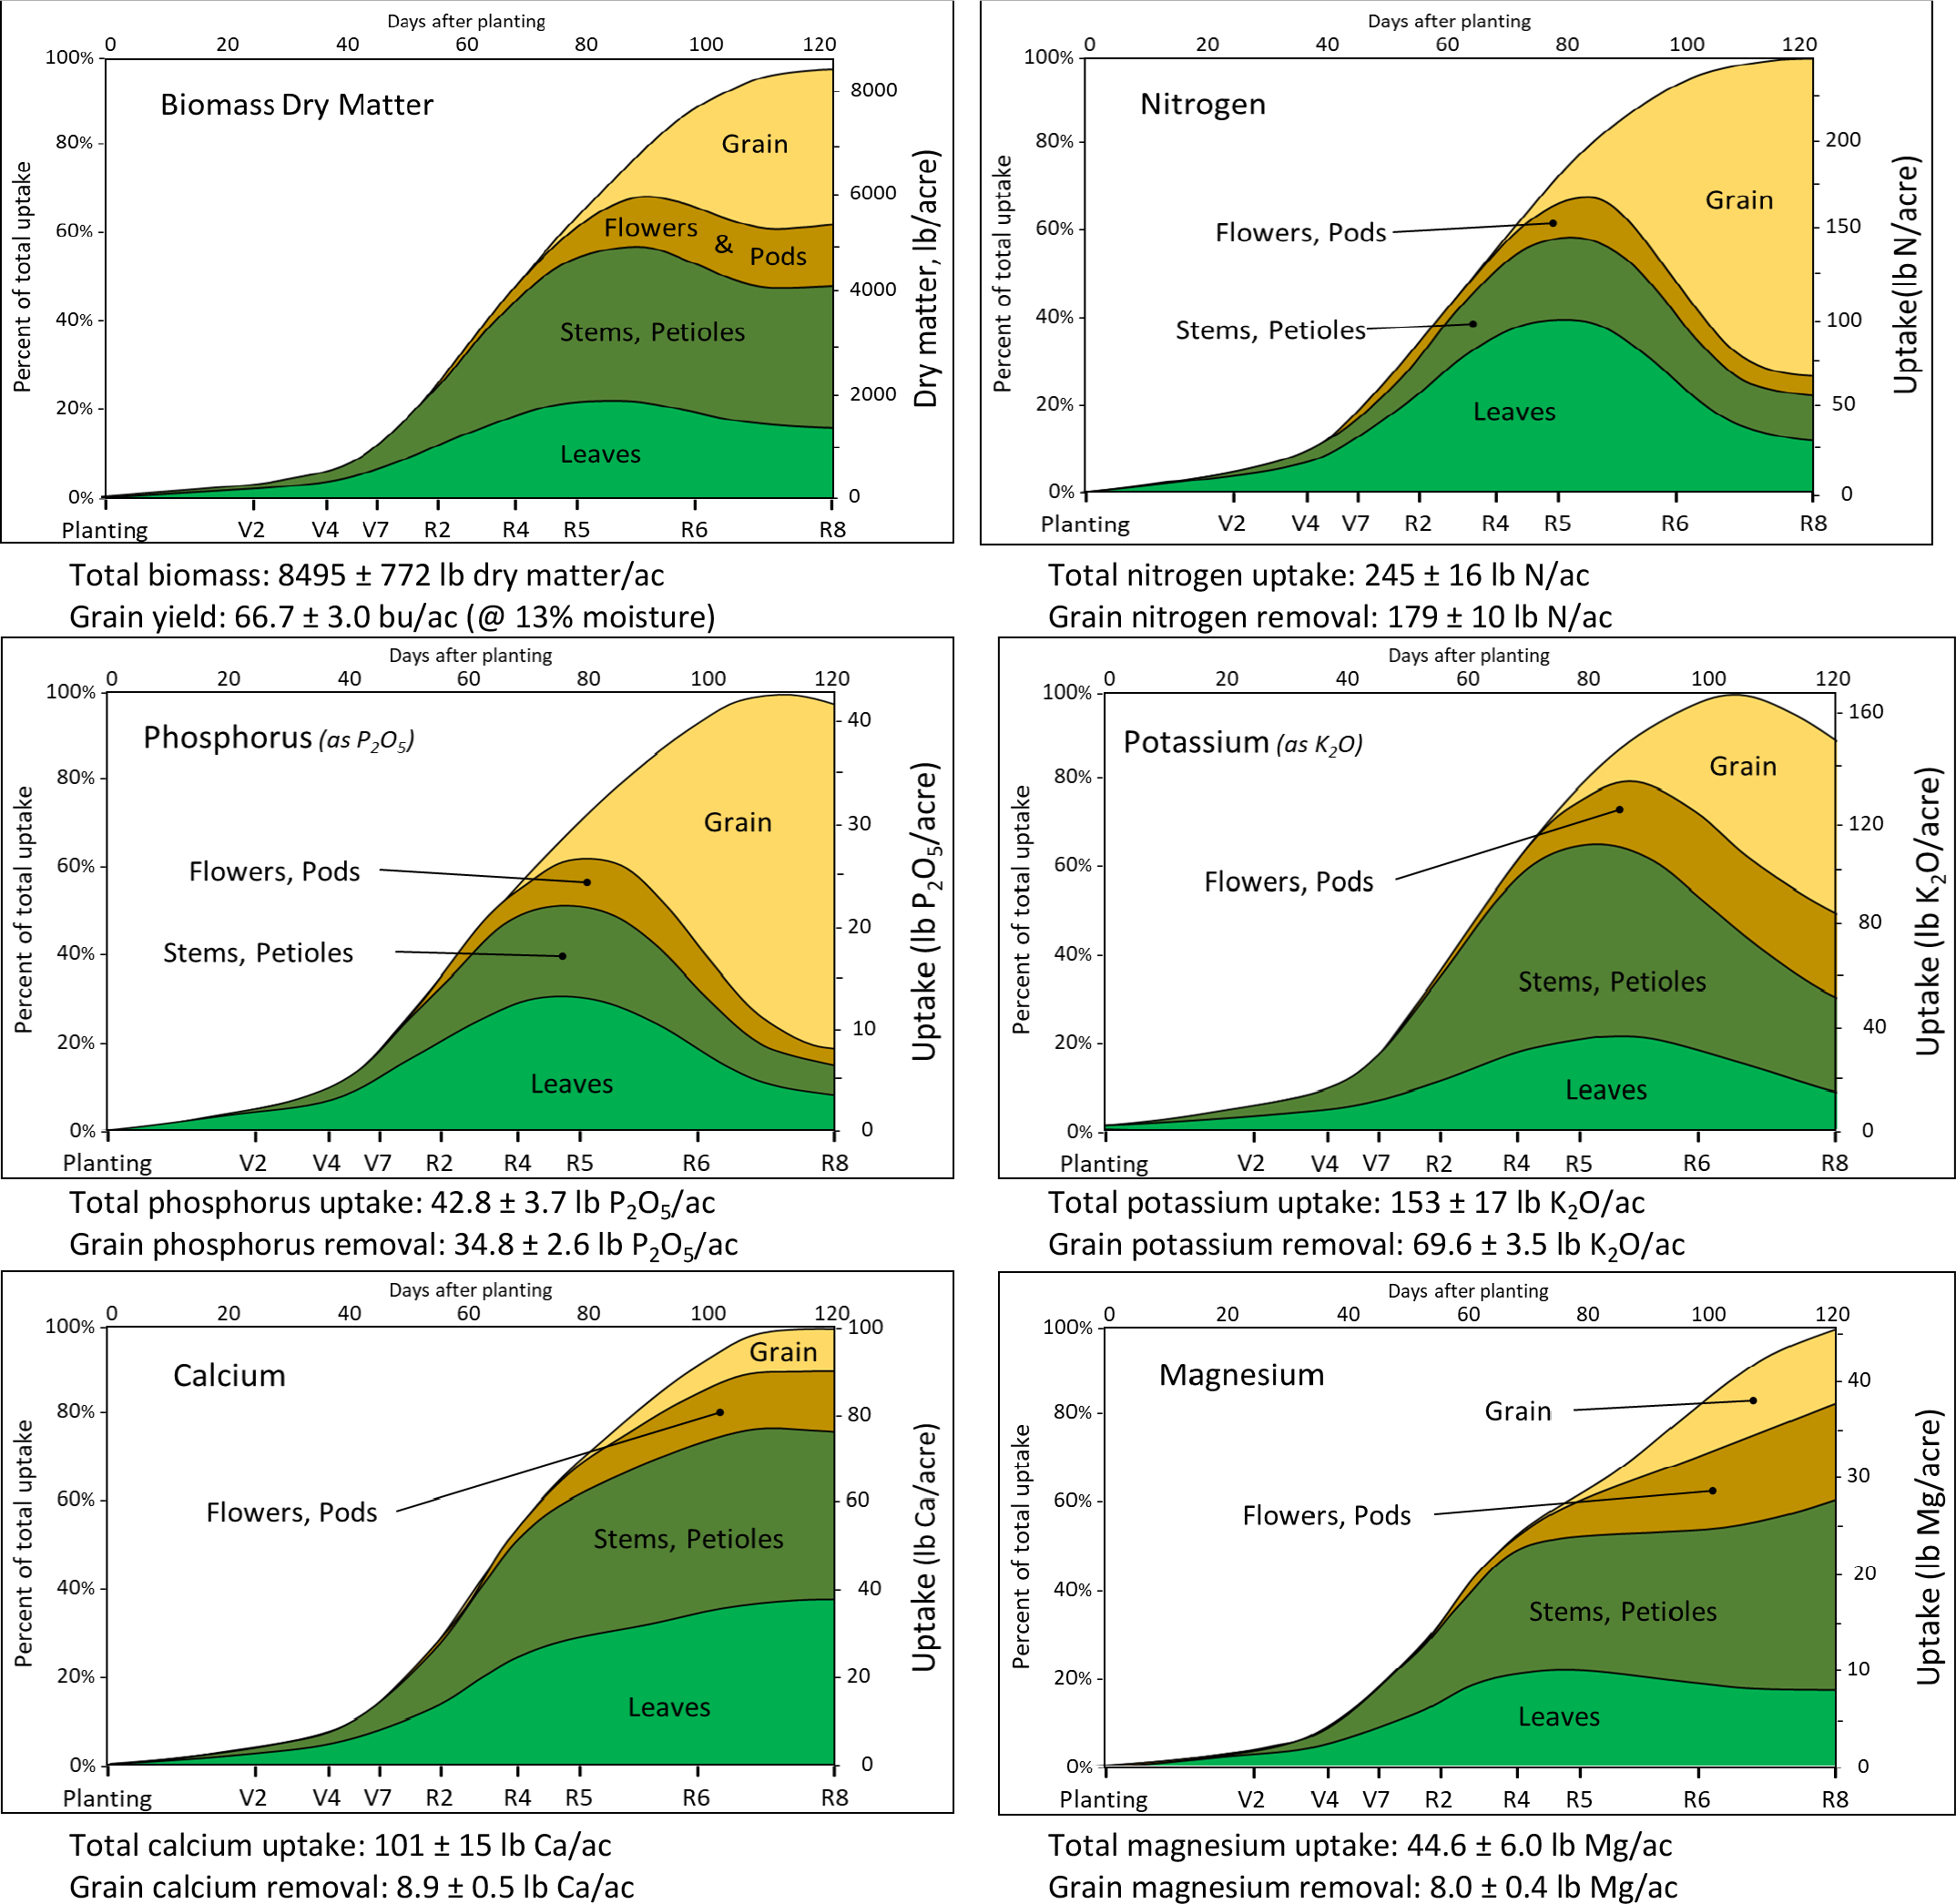
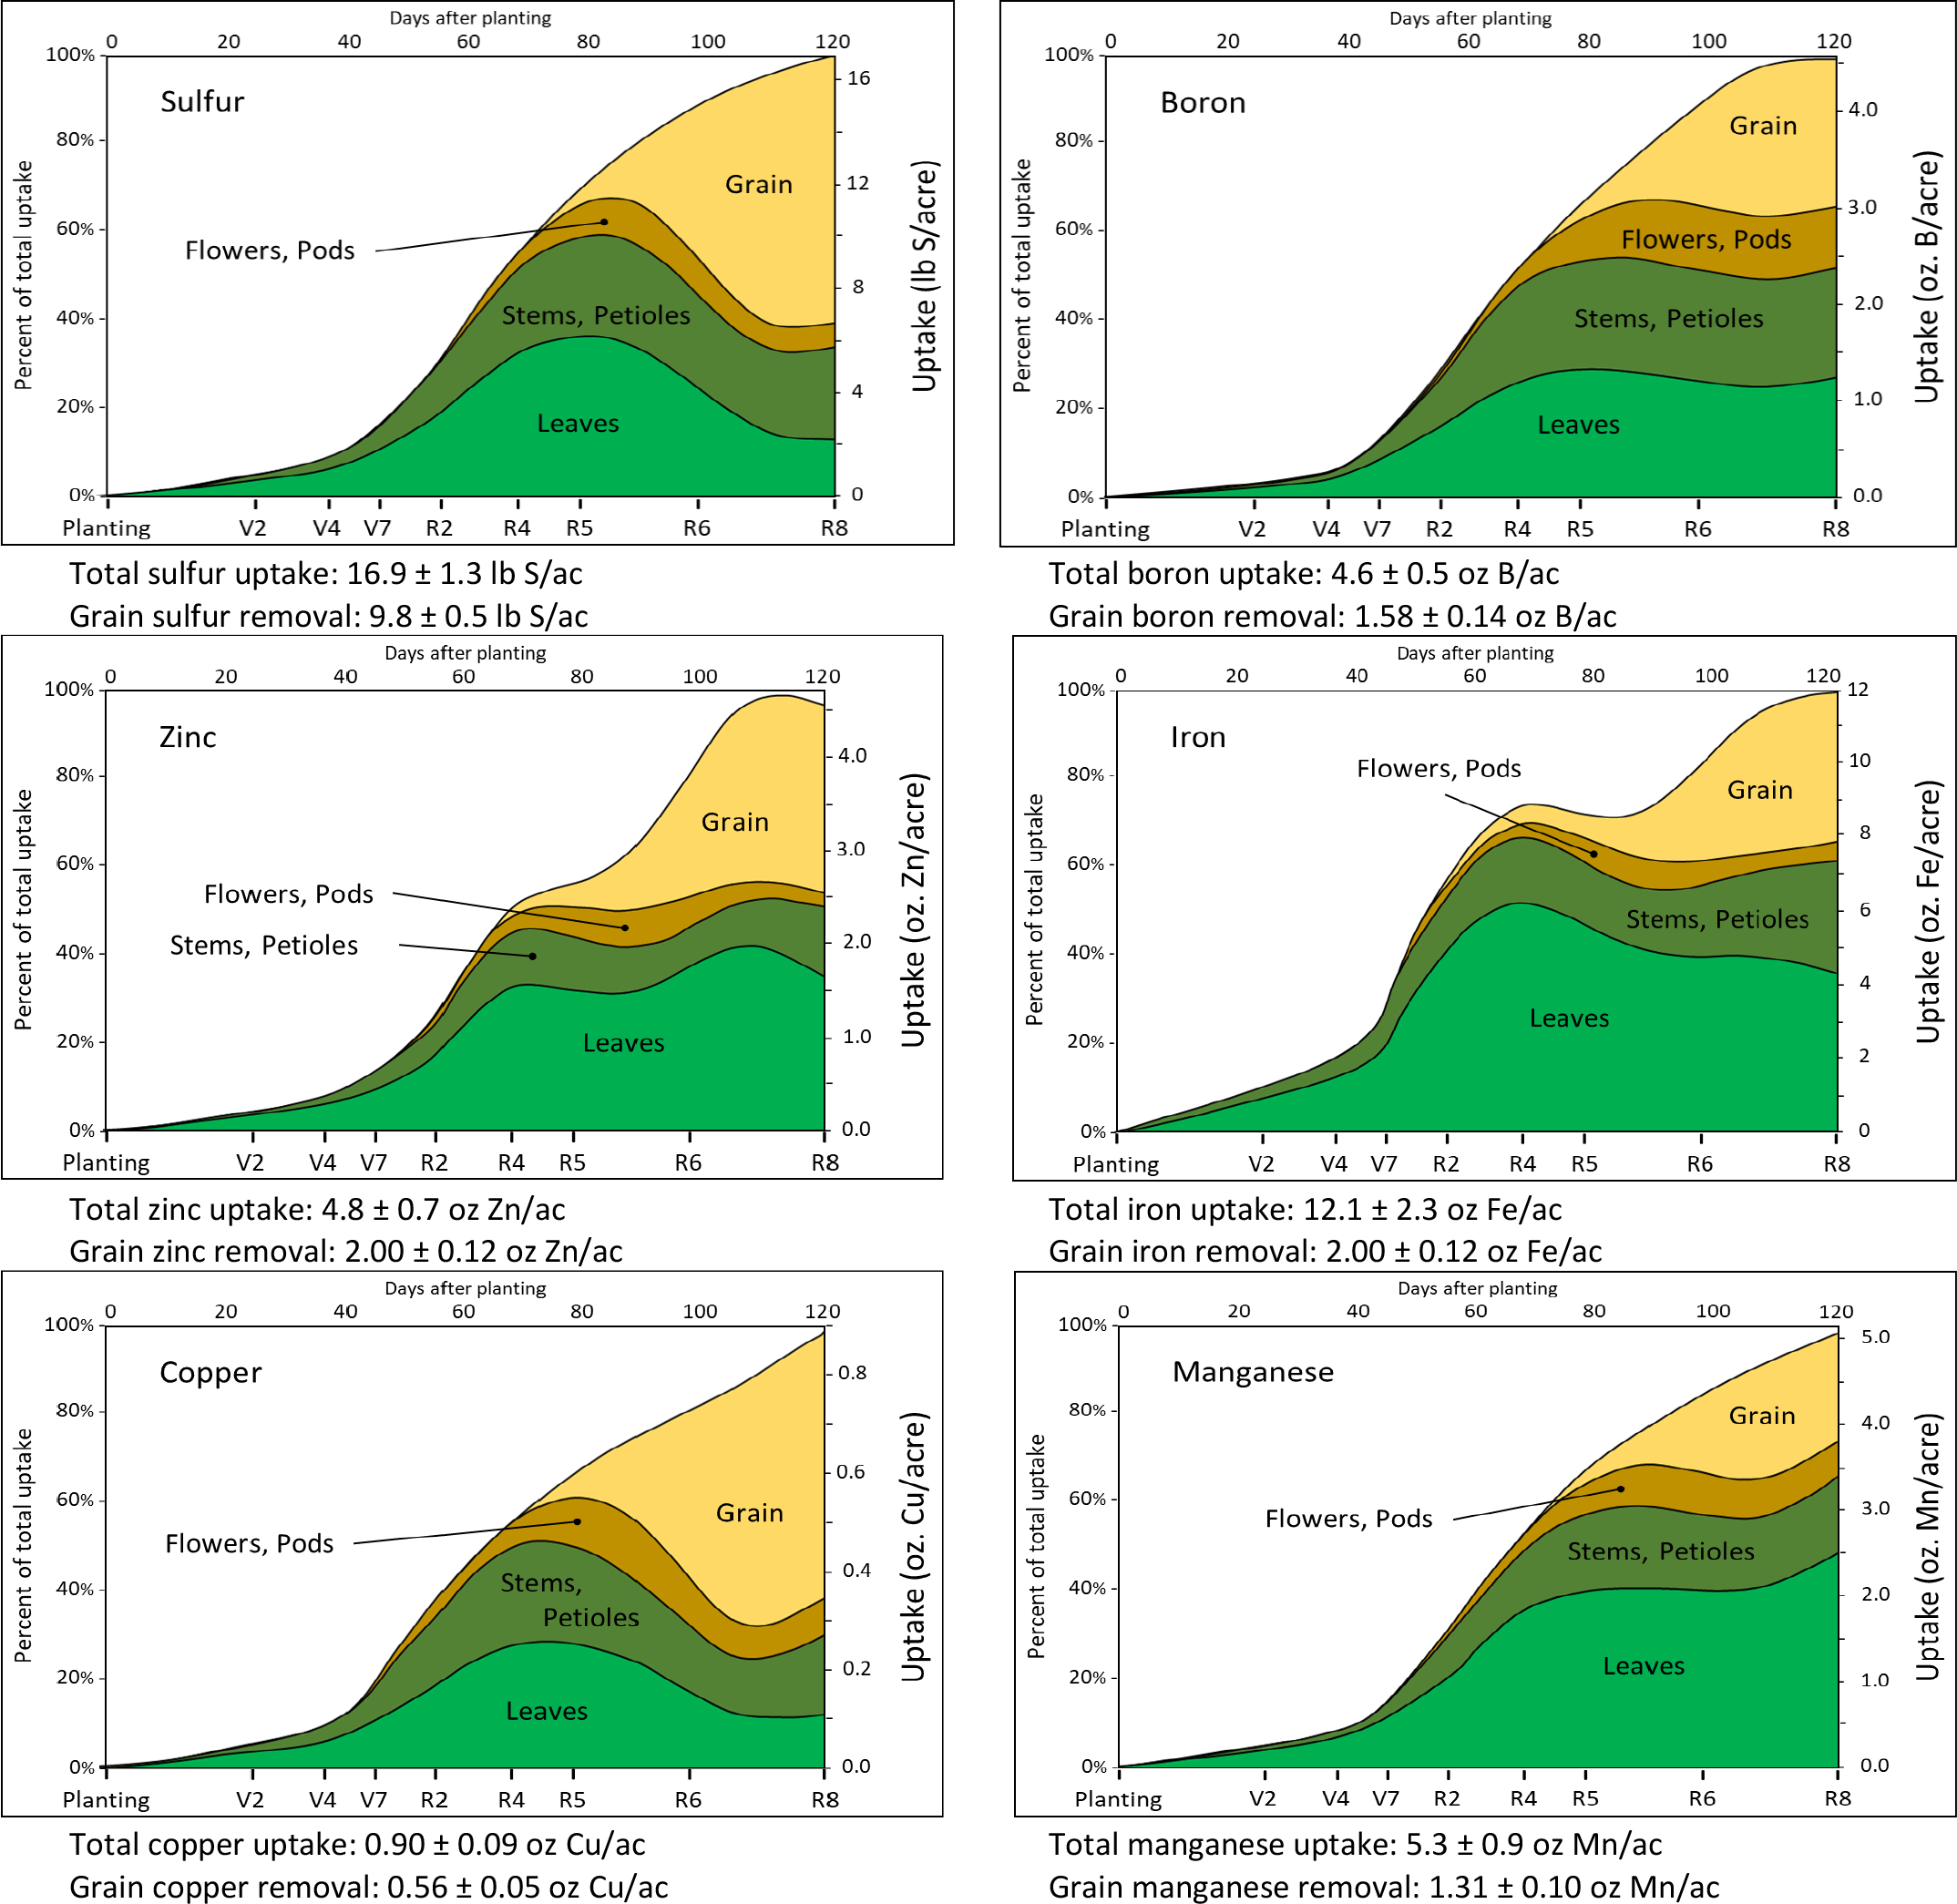
¶ F. Soybean Nutrient Uptake
The nutrient uptake values presented in this Crop File are based on whole plant samples collected from two Illinois locations during the 2012 and 2013 growing seasons. Samples were collected at the V4 (fourth trifoliate), V7 (seventh trifoliate), R2 (full bloom), R4 (full pod), R5 (beginning seed), R6 (full seed), and R8 (full maturity) growth stages, then separated into the four components.
¶ Table F1. Grain Nutrient Removal, pounds per bushel (lb/bu) |
|
| Nitrogen, N | 2.69 ± 0.15 |
| Phosphorus, as P2O5 | 0.52 ± 0.04 |
| (as P) | (0.23 ± 0.02) |
| Potassium as K2O | 1.04 ± 0.05 |
| (as K) | (0.86 ± 0.04) |
| Calcium, Ca | 0.13 ± 0.01 |
| Magnesium, Mg | 0.12 ± 0.01 |
| Sulfur, S | 0.15 ± 0.01 |
¶ Table F2. Grain Nutrient Removal, ounces per bushel (oz/bu) |
|
| Zinc, Zn | 0.030 ± 0.002 |
| Iron, Fe | 0.053 ± 0.004 |
| Manganese, Mn | 0.020 ± 0.002 |
| Copper, Cu | 0.008 ± 0.001 |
| Boron, B | 0.024 ± 0.002 |
¶ References
Reference: Bender, R.R., J. W. Haegele, and F. E. Below. 2015. Nutrient Uptake, Partitioning, and Remobilization in Modern Soybean Varieties. Agrononmy Journal 107:563–573.