⇦ Back to Soil Fertility and Plant Nutrition Home
¶ Peanut (Arachis hypogaea)
| Table No: | Growth stage: | Plant part: |
| Table A | Emergence to 30 days after emergence | Whole plant |
| Table B | Pre-bloom to flowering | Youngest, mature leaves |
| Table C | Early pegging | Youngest, mature leaves |
| Table D | Pod formation to maturity | Fully-developed mature leaves |
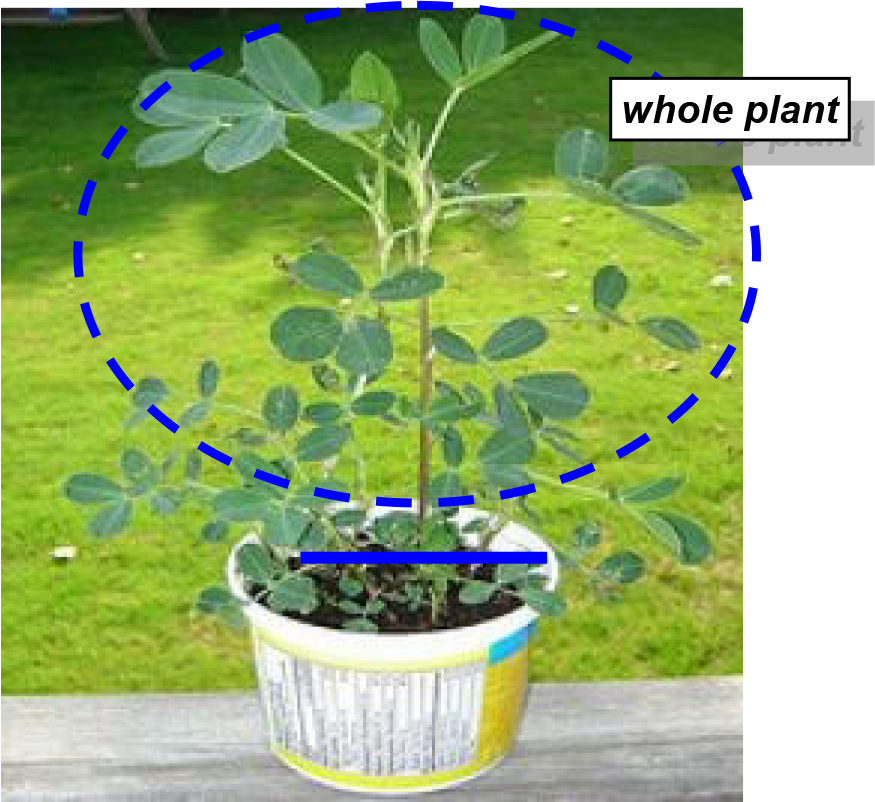
¶ A: Emergence to 30 days after emergence
Plant Part: Whole plant
Sampling Procedure: Collect 30 to 40 whole plants, cutting off at ground level. Avoid transferrig soil particles into sampling bag.
| Analysis | Tissue Concentration Guidelines | |||||||
| Marginal Range | Sufficiency Range | Probably Toxic | ||||||
| Nitrogen, % N | 2.80 | - | 3.20 | 3.20 | - | 4.50 | ||
| Phosphorus, %P | 0.30 | - | 0.35 | 0.35 | - | 0.60 | ||
| Potassium, % K | 1.60 | - | 2.00 | 2.00 | - | 3.50 | ||
| Calcium, % Ca | 1.10 | - | 1.30 | 1.30 | - | 1.90 | ||
| Magnesium, % Mg | 0.25 | - | 0.30 | 0.30 | - | 0.80 | ||
| Sulfur, % S | 0.18 | - | 0.24 | 0.24 | - | 0.40 | ||
| Zinc, ppm Zn | 15 | - | 20 | 20 | - | 50 | > 200 | |
| Iron, ppm Fe | 80 | - | 100 | 100 | - | 250 | ||
| Manganese, ppm Mn | 80 | - | 100 | 100 | - | 350 | > 600 | |
| Copper ppm Cu | 5 | - | 10 | 10 | - | 40 | ||
| Boron, ppm B | 10 | - | 20 | 20 | - | 40 | > 200 | |
| Nitrogen-to-sulfur ratio (N:S) | 10 | - | 15 | |||||
| Chloride, % Cl | > 2.5% | |||||||
¶ Figure A.
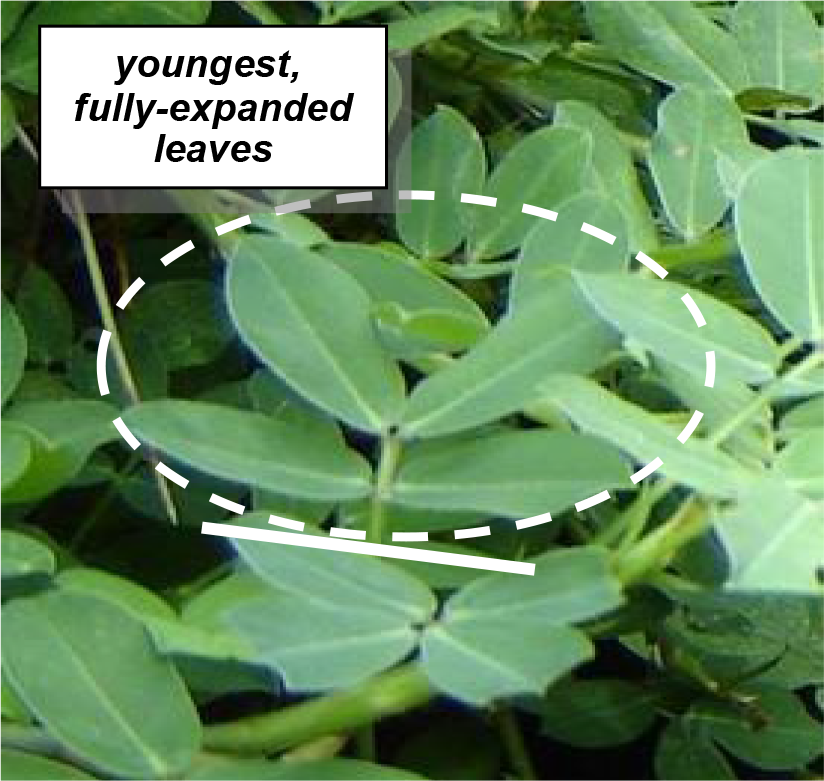
¶ B: Pre-bloom to flowering
Plant Part: Youngest, mature leaves
Sampling Procedure: Collect recently matured, fully-expanded leaves. It is better to collect a slightly older leaf than one that is too young. Collect 50 to 60 leaves (i.e., 12 to 15 plants).
| Analysis | Tissue Concentration Guidelines | |||||||
| Marginal Range | Sufficiency Range | Probably Toxic | ||||||
| Nitrogen, % N | 2.70 | - | 3.00 | 3.00 | - | 4.50 | ||
| Phosphorus, %P | 0.20 | - | 0.25 | 0.25 | - | 0.50 | ||
| Potassium, % K | 1.40 | - | 1.70 | 1.70 | - | 3.00 | ||
| Calcium, % Ca | 1.10 | - | 1.25 | 1.25 | - | 1.75 | ||
| Magnesium, % Mg | 0.25 | - | 0.30 | 0.30 | - | 0.80 | ||
| Sulfur, % S | 0.15 | - | 0.20 | 0.20 | - | 0.35 | ||
| Zinc, ppm Zn | 15 | - | 20 | 20 | - | 60 | > 200 | |
| Iron, ppm Fe | 50 | - | 60 | 60 | - | 300 | ||
| Manganese, ppm Mn | 80 | - | 100 | 100 | - | 350 | > 600 | |
| Copper ppm Cu | 7 | - | 10 | 10 | - | 50 | ||
| Boron, ppm B | 20 | - | 25 | 25 | - | 60 | > 200 | |
| Nitrogen-to-sulfur ratio (N:S) | 12 | - | 15 | |||||
| Chloride, % Cl | > 2.5% | |||||||
¶ Figure B.
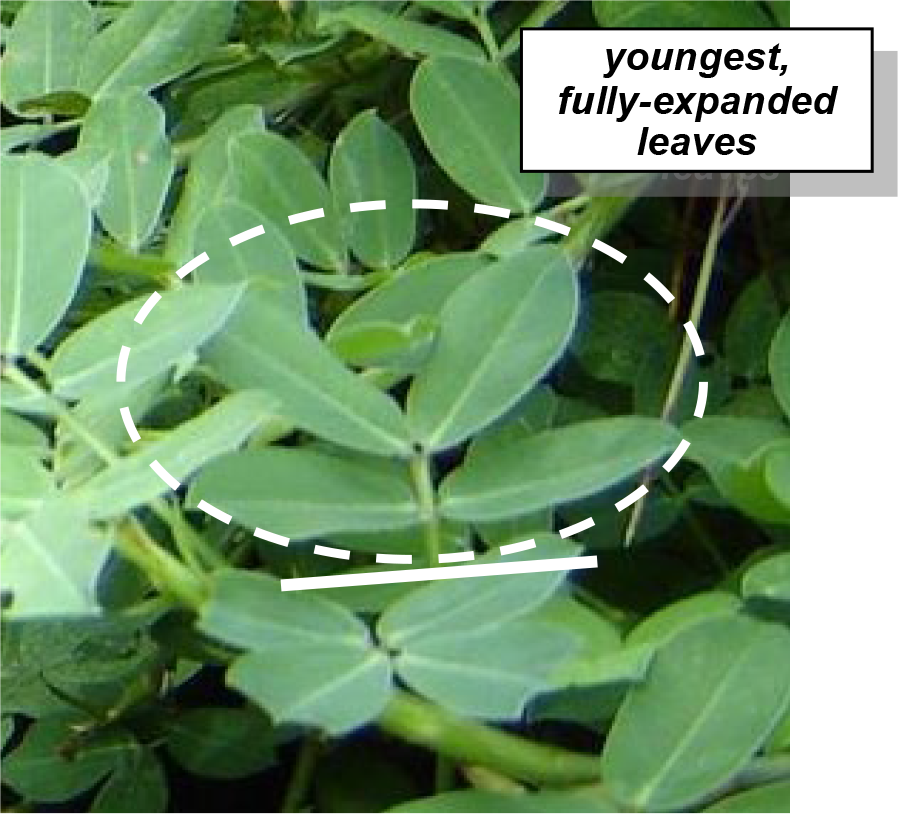
¶ C: Early pegging
Plant Part: Youngest, mature leaves
Sampling Procedure: Collect recently matured, fully-expanded leaves. It is better to collect a slightly older leaf than one that is too young. Collect 50 to 60 leaves (i.e., 12 to 15 plants).
| Analysis | Tissue Concentration Guidelines | |||||||
| Marginal Range | Sufficiency Range | Probably Toxic | ||||||
| Nitrogen, % N | 3.20 | - | 3.50 | 3.50 | - | 4.50 | ||
| Phosphorus, %P | 0.15 | - | 0.20 | 0.20 | - | 0.35 | ||
| Potassium, % K | 1.30 | - | 1.70 | 1.70 | - | 3.00 | ||
| Calcium, % Ca | 1.00 | - | 1.25 | 1.25 | - | 1.75 | ||
| Magnesium, % Mg | 0.25 | - | 0.30 | 0.30 | - | 0.80 | ||
| Sulfur, % S | 0.15 | - | 0.20 | 0.20 | - | 0.40 | ||
| Zinc, ppm Zn | 15 | - | 20 | 20 | - | 50 | > 200 | |
| Iron, ppm Fe | 70 | - | 100 | 100 | - | 250 | ||
| Manganese, ppm Mn | 80 | - | 100 | 100 | - | 350 | > 600 | |
| Copper ppm Cu | 7 | - | 10 | 10 | - | 50 | ||
| Boron, ppm B | 16 | - | 20 | 20 | - | 50 | > 200 | |
| Nitrogen-to-sulfur ratio (N:S) | ||||||||
| Chloride, % Cl | > 2.5% | |||||||
¶ Figure C.
¶ D: Pod formation to maturity
Plant Part: Fully-developed mature leaves
Sampling Procedure: Collect recently matured, fully-expanded leaves. Collect 50 to 60 leaves (i.e., 12 to 15 plants).
| Analysis | Tissue Concentration Guidelines | |||||||
| Marginal Range | Sufficiency Range | Probably Toxic | ||||||
| Nitrogen, % N | 1.50 | - | 1.70 | 1.70 | - | 3.00 | ||
| Phosphorus, %P | 0.10 | - | 0.15 | 0.15 | - | 0.30 | ||
| Potassium, % K | 1.20 | - | 1.40 | 1.40 | - | 2.50 | ||
| Calcium, % Ca | 1.00 | - | 1.25 | 1.25 | - | 1.75 | ||
| Magnesium, % Mg | 0.25 | - | 0.30 | 0.30 | - | 0.80 | ||
| Sulfur, % S | 0.12 | - | 0.15 | 0.15 | - | 0.35 | ||
| Zinc, ppm Zn | 12 | - | 15 | 15 | - | 35 | ||
| Iron, ppm Fe | 70 | - | 100 | 100 | - | 300 | ||
| Manganese, ppm Mn | 80 | - | 100 | 100 | - | 400 | ||
| Copper ppm Cu | 4 | - | 7 | 7 | - | 40 | ||
| Boron, ppm B | 10 | - | 20 | 20 | - | 50 | ||
Note: During plant maturity, nutrients may be translocated from the leaf tissues to the reproductive tissues (grain, seeds, fruit, etc.) and may be quite variable. The interpretations provided above are best estimates of nutrient content.