⇦ Back to Soil Fertility and Plant Nutrition Home
¶ Onion (Allium cepa)
| Table No: | Growth stage: | Plant part: |
| Table A | 2-leaf to 6-leaf stage | Whole tops |
| Table B | Early bulbing (8-leaf to 10-leaf stage) | Whole tops |
| Table C | Mid-growth, mid-bulbing (12L to 13L stage) | Mature leaves |
| Table D | Late-bulb to early maturity | Mature leaves |
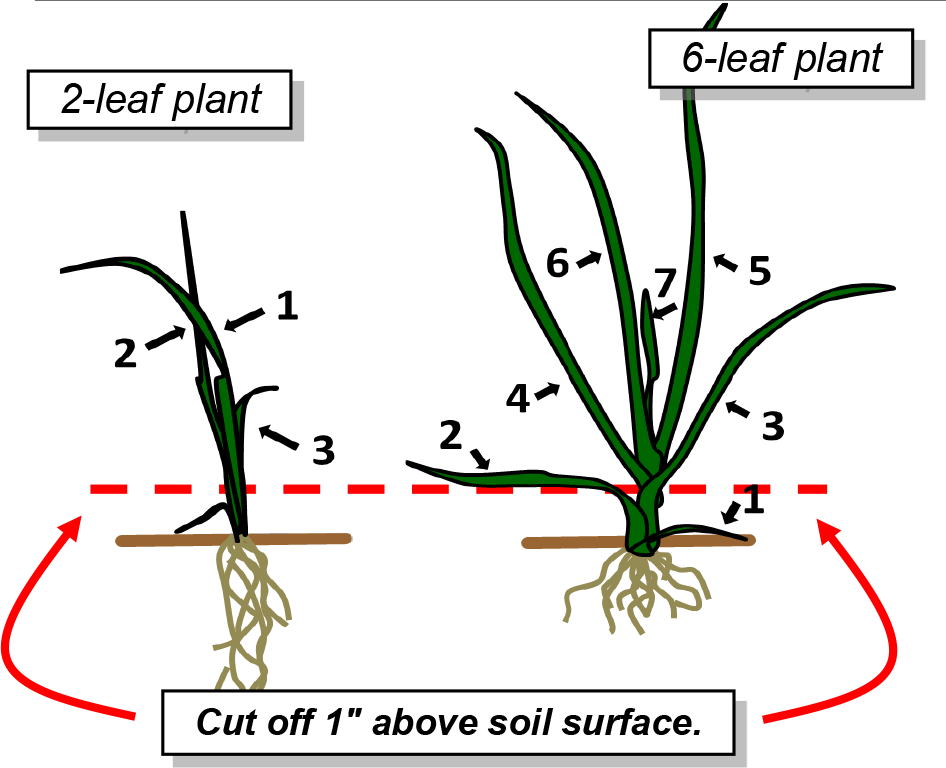
¶ A: 2-leaf to 6-leaf stage
Plant Part: Whole tops
Sampling Procedure: Collect whole tops (green portion) from 20 to 25 plants. (At this growth stage, bulbs have not begun to enlarge.)
| Analysis | Tissue Concentration Guidelines | ||||||||
| Low/Marginal Range | Sufficiency Range | Excessive, toxic? | |||||||
| Nitrogen, % N | 2.00 | - | 2.30 | 2.30 | - | 3.50 | |||
| Phosphorus, %P | 0.15 | - | 0.25 | 0.25 | - | 0.50 | |||
| Potassium, % K | 1.80 | - | 2.00 | 2.00 | - | 4.00 | |||
| Calcium, % Ca | 0.60 | - | 0.90 | 0.90 | - | 2.00 | |||
| Magnesium, % Mg | 0.12 | - | 0.15 | 0.15 | - | 0.30 | |||
| Sulfur, % S | 0.20 | - | 0.25 | 0.25 | - | 0.50 | |||
| Zinc, ppm Zn | 15 | - | 20 | 20 | - | 50 | |||
| Iron, ppm Fe | 35 | - | 50 | 50 | - | 200 | |||
| Manganese, ppm Mn | 30 | - | 50 | 50 | - | 150 | |||
| Copper ppm Cu | 5 | - | 10 | 10 | - | 35 | |||
| Boron, ppm B | 10 | - | 15 | 15 | - | 30 | |||
| Nitrogen-to-sulfur ratio (N:S) | 15 | - | 18 | 10 | - | 14 | |||
| Sodium, % Na | 0.25 | - | 0.50 | ||||||
| Chloride, % Cl | 0.30 | - | 1.00 | ||||||
| Nitrate, ppm NO3-N | |||||||||
| Phosphate, ppm PO4-P | |||||||||
¶ Figure A.
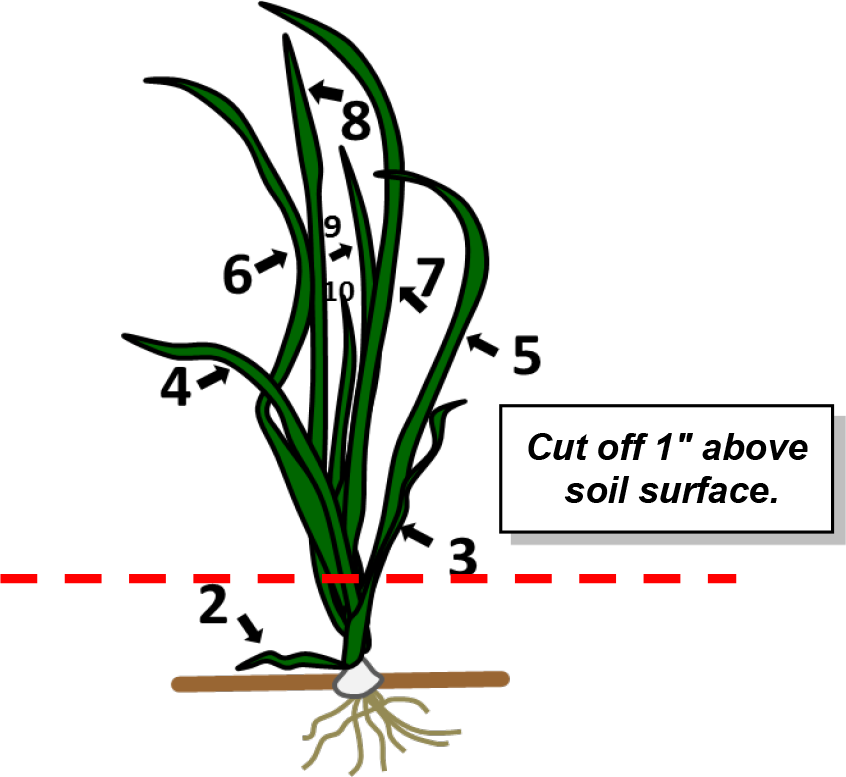
¶ B: Early bulbing (8-leaf to 10-leaf stage)
Plant Part: Whole tops
Sampling Procedure: Collect whole tops (green portion) from 20 to 25 plants. (At this stage, bulbs have begun to enlarge and may be about 1 to 1¼ inches in diameter.
| Analysis | Tissue Concentration Guidelines | ||||||||
| Low/Marginal Range | Sufficiency Range | Excessive, toxic? | |||||||
| Nitrogen, % N | 2.20 | - | 2.50 | 2.50 | - | 3.50 | |||
| Phosphorus, %P | 0.20 | - | 0.30 | 0.30 | - | 0.50 | |||
| Potassium, % K | 2.00 | - | 2.50 | 2.50 | - | 4.00 | |||
| Calcium, % Ca | 0.80 | - | 1.00 | 1.00 | - | 2.80 | |||
| Magnesium, % Mg | 0.25 | - | 0.30 | 0.30 | - | 0.50 | |||
| Sulfur, % S | 0.20 | - | 0.25 | 0.25 | - | 0.50 | |||
| Zinc, ppm Zn | 15 | - | 20 | 20 | - | 75 | |||
| Iron, ppm Fe | 35 | - | 50 | 50 | - | 200 | |||
| Manganese, ppm Mn | 30 | - | 50 | 50 | - | 200 | |||
| Copper ppm Cu | 5 | - | 10 | 10 | - | 35 | |||
| Boron, ppm B | 15 | - | 25 | 25 | - | 50 | |||
| Nitrogen-to-sulfur ratio (N:S) | 15 | - | 18 | 10 | - | 14 | |||
| Sodium, % Na | 0.25 | - | 0.50 | ||||||
| Chloride, % Cl | 0.30 | - | 1.00 | ||||||
| Nitrate, ppm NO3-N | |||||||||
| Phosphate, ppm PO4-P | |||||||||
¶ Figure B.
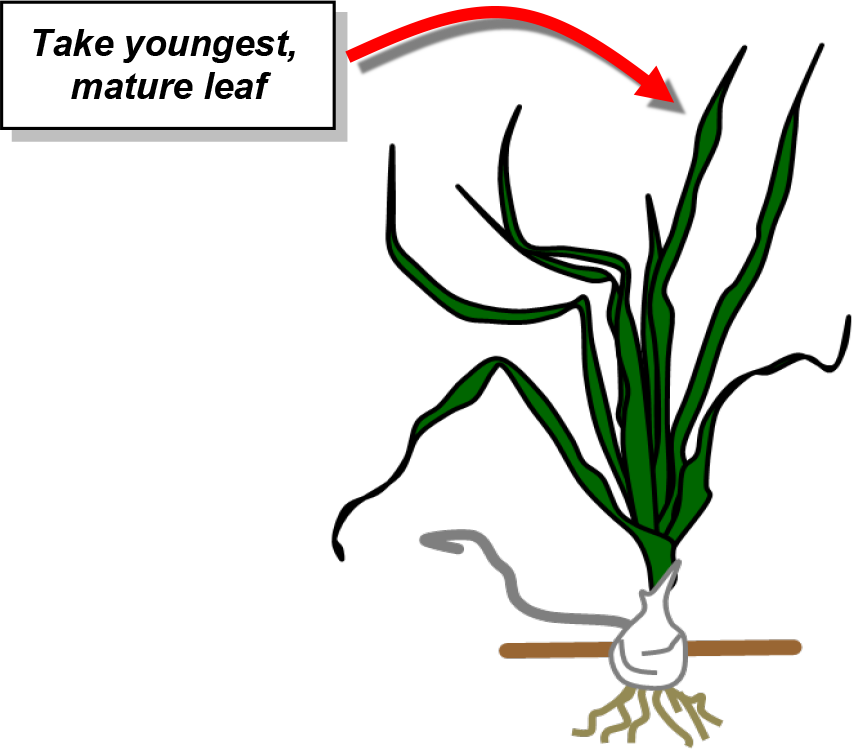
¶ C: Mid-growth, mid-bulbing (12-leaf to 13-leaf stage)
Plant Part: Youngest mature (tallest) leaves
Sampling Procedure: Collect most recently emerged, but fully mature, leaf from 30 to 40 plants. (At this stage, bulbs may be about 1½ to 3 inches in diameter.)
| Analysis | Tissue Concentration Guidelines | ||||||||
| Low/Marginal Range | Sufficiency Range | Excessive, toxic? | |||||||
| Nitrogen, % N | 2.60 | - | 3.00 | 3.00 | - | 5.50 | |||
| Phosphorus, %P | 0.25 | - | 0.35 | 0.35 | - | 0.50 | |||
| Potassium, % K | 2.70 | - | 3.00 | 3.00 | - | 5.00 | |||
| Calcium, % Ca | 0.80 | - | 1.30 | 1.30 | - | 2.80 | |||
| Magnesium, % Mg | 0.25 | - | 0.30 | 0.30 | - | 0.50 | |||
| Sulfur, % S | 0.20 | - | 0.25 | 0.25 | - | 0.50 | |||
| Zinc, ppm Zn | 15 | - | 25 | 25 | - | 100 | |||
| Iron, ppm Fe | 35 | - | 50 | 50 | - | 250 | |||
| Manganese, ppm Mn | 40 | - | 50 | 50 | - | 200 | |||
| Copper ppm Cu | 5 | - | 10 | 10 | - | 35 | |||
| Boron, ppm B | 20 | - | 25 | 25 | - | 60 | |||
| Nitrogen-to-sulfur ratio (N:S) | 15 | - | 18 | 10 | - | 14 | |||
| Sodium, % Na | 0.25 | - | 0.50 | ||||||
| Chloride, % Cl | 0.30 | - | 1.00 | ||||||
| Nitrate, ppm NO3-N | |||||||||
| Phosphate, ppm PO4-P | |||||||||
¶ Figure C.
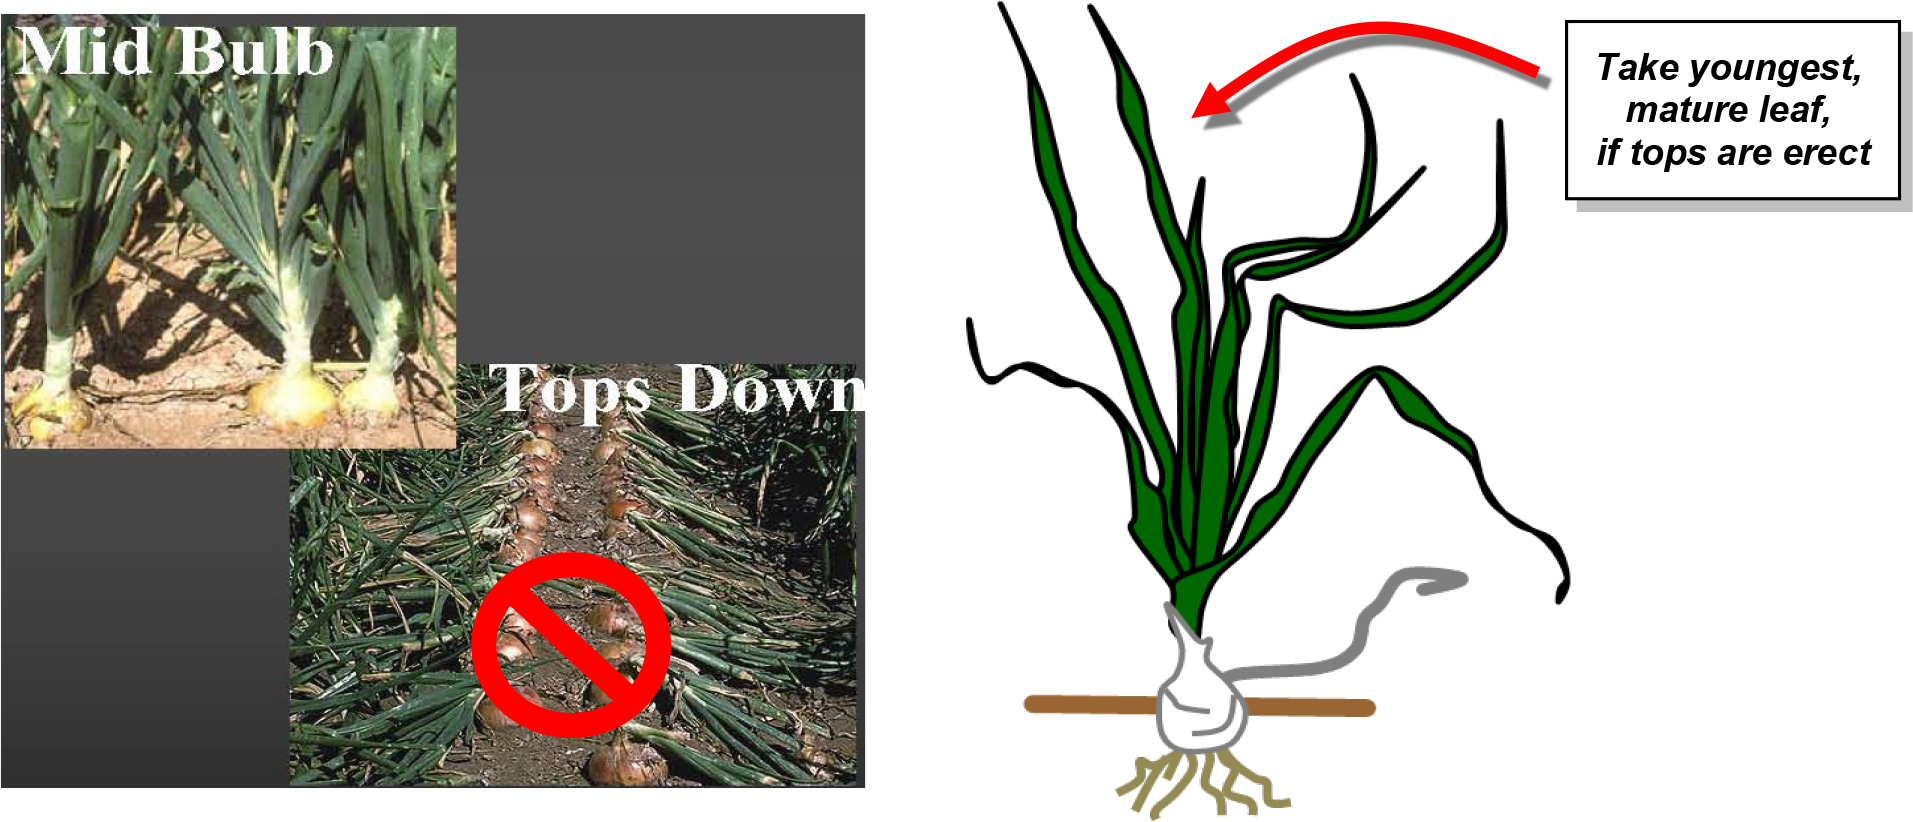
¶ D: Late-bulb to early maturity
Plant Part: Youngest mature (tallest) leaves
Sampling Procedure: Collect most recently emerged, but fully mature, leaf from 30 to 40 plants. (At this stage, bulbs are 3 inches or more in diameter and tops are still erect.)
| Analysis | Tissue Concentration Guidelines | ||||||||
| Low/Marginal Range | Sufficiency Range | Excessive, toxic? | |||||||
| Nitrogen, % N | 2.20 | - | 2.50 | 2.50 | - | 4.50 | |||
| Phosphorus, %P | 0.20 | - | 0.25 | 0.25 | - | 0.50 | |||
| Potassium, % K | 2.00 | - | 2.50 | 2.50 | - | 5.00 | |||
| Calcium, % Ca | 0.80 | - | 1.30 | 1.30 | - | 2.80 | |||
| Magnesium, % Mg | 0.20 | - | 0.25 | 0.25 | - | 0.45 | |||
| Sulfur, % S | 0.15 | - | 0.20 | 0.20 | - | 0.45 | |||
| Zinc, ppm Zn | 15 | - | 25 | 25 | - | 100 | |||
| Iron, ppm Fe | 35 | - | 50 | 50 | - | 250 | |||
| Manganese, ppm Mn | 40 | - | 50 | 50 | - | 200 | |||
| Copper ppm Cu | 5 | - | 10 | 10 | - | 35 | |||
| Boron, ppm B | 20 | - | 25 | 25 | - | 60 | |||
| Nitrogen-to-sulfur ratio (N:S) | 15 | - | 18 | 10 | - | 14 | |||
| Sodium, % Na | 0.25 | - | 0.50 | ||||||
| Chloride, % Cl | 0.30 | - | 1.00 | ||||||
| Nitrate, ppm NO3-N | |||||||||
| Phosphate, ppm PO4-P | |||||||||
¶ Figure D.
Note: Interpretations are based the relationship between nutrient levels in a particular part of a "standard" tissue in a specific time in the growing season.
These plant tissue ranges and interpretations are not considered valid with plant parts or growth stages other than those specified. These interpretations are developed from data collected across a wide range of crop, soil, and climate conditions.
Results from a single sample may be affected by time of day, climatic conditions, plant stress, age, or disease, that are not directly related to fertility status. Nutrient concentrations are not uniform throughout the plant and may change as the tissue matures.Tissue analysis trends should be evaluated by variety, growing season, and yield/quality goals. Collecting plant samples from the same location as soil samples allows comparison of soil nutrient availability with plant nutrient status.
Low nutrient levels may be due to deficiency or to dilution by intensive growth. High or excessive nutrient levels may be a sign of restricted growth allowing nutrients to accumulate in the plant tissue. Nutrient imbalance may be secondary to the primary problem.