⇦ Back to Soil Fertility and Plant Nutrition Home
¶ Romaine lettuce (Lactuca sativa var. longifolia) (also Cos lettuce)
| Table No: | Growth stage: | Plant part: |
| Table A | 8-leaf | Mature leaves |
| Table B | Mature leaves | Wrapper leaf |
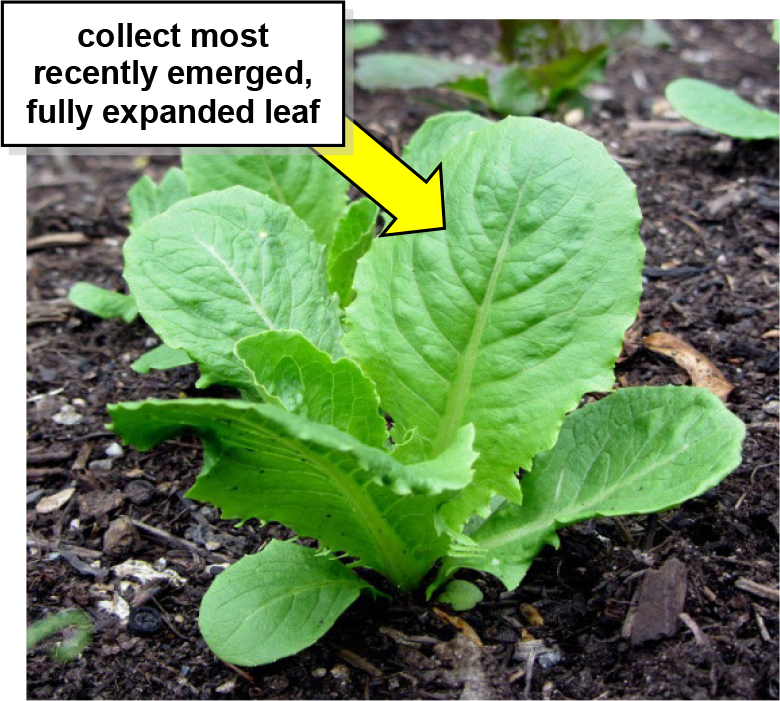
¶ A: 8-leaf
Plant Part: Oldest undamaged leaf
Sampling Procedure: Collect the most recently emerged, fully expanded leaf from 30 to 50 plants. Collect leaves that are free of disease or insect damage. At least a pint of loosely packed tissue (a ball about 4 to 5 inches in diameter) should be submitted for analysis. Place samples in a paper bag, not a plastic bag, for shipment to the laboratory.
| Analysis | Tissue Concentration Guidelines | ||||||||
| Low/Marginal Range | Sufficiency Range | Excessive, toxic? | |||||||
| Nitrogen, % N | 4.0 | - | 4.5 | 4.5 | - | 6.0 | |||
| Phosphorus, %P | 0.4 | - | 0.5 | 0.5 | - | 0.8 | |||
| Potassium, % K | 4.0 | - | 4.5 | 4.5 | - | 6.0 | |||
| Calcium, % Ca | 1.7 | - | 2.0 | 2.0 | - | 3.0 | |||
| Magnesium, % Mg | 0.3 | - | 0.3 | 0.3 | - | 0.7 | |||
| Sulfur, % S | - | - | |||||||
| Zinc, ppm Zn | 20 | - | 40 | 40 | - | 60 | |||
| Iron, ppm Fe | 40 | - | 50 | 50 | - | 100 | |||
| Manganese, ppm Mn | 10 | - | 15 | 15 | - | 25 | |||
| Copper ppm Cu | 4 | - | 5 | 5 | - | 10 | |||
| Boron, ppm B | 20.00 | - | 25.00 | 25.00 | - | 45 | |||
| Nitrogen-to-sulfur ratio (N:S) | 12.00 | - | 15.00 | 8.00 | - | 12 | |||
| Sodium, % Na | 0.25 | - | 0.50 | ||||||
| Chloride, % Cl | 0.30 | - | 1.00 | ||||||
| Nitrate, ppm NO3-N | |||||||||
| Phosphate, ppm PO4-P | |||||||||
¶ Figure A.
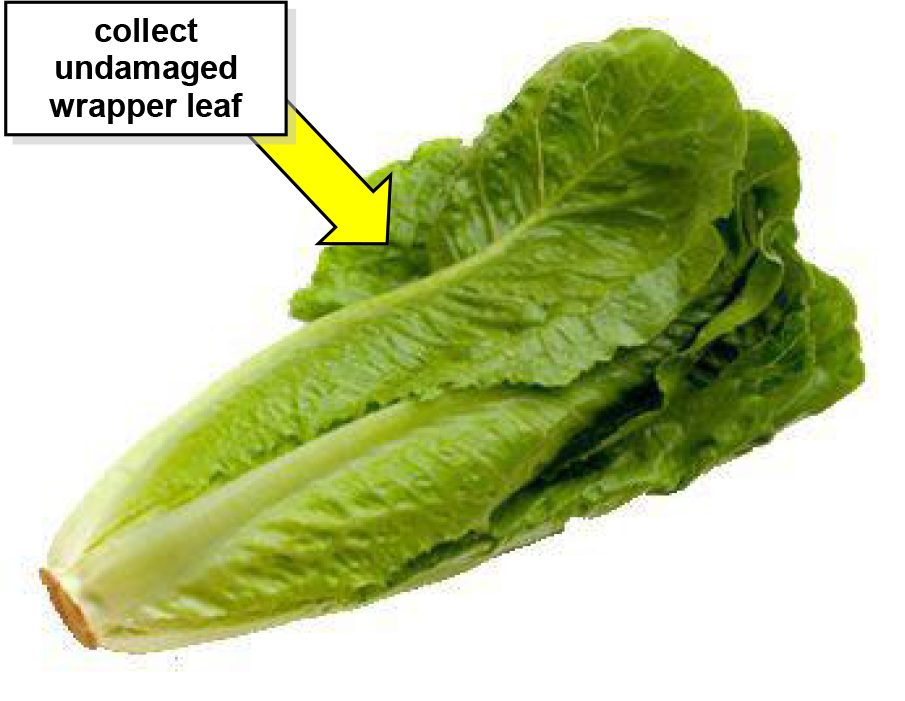
¶ B: Mature plants
Plant Part: Wrapper leaf
Sampling Procedure: Collect wrapper leaves from 25 to 30 plants. Collect leaves that are free of disease or insect damage. At least a pint of loosely packed tissue (a ball about 4 to 5 inches in diameter) should be submitted for analysis. Place samples in a paper bag, not a plastic bag, for shipment to the laboratory.
| Analysis | Tissue Concentration Guidelines | ||||||||
| Low/Marginal Range | Sufficiency Range | Excessive, toxic? | |||||||
| Nitrogen, % N | 1.50 | - | 2.30 | 2.30 | - | 4.00 | |||
| Phosphorus, %P | 0.25 | - | 0.35 | 0.35 | - | 0.60 | |||
| Potassium, % K | 2.50 | - | 4.00 | 4.00 | - | 8.00 | |||
| Calcium, % Ca | 1.70 | - | 2.00 | 2.00 | - | 2.80 | |||
| Magnesium, % Mg | 0.25 | - | 0.30 | 0.30 | - | 0.80 | |||
| Sulfur, % S | - | - | |||||||
| Zinc, ppm Zn | 20 | - | 30 | 30 | - | 250 | |||
| Iron, ppm Fe | 20 | - | 40 | 40 | - | 100 | |||
| Manganese, ppm Mn | 10 | - | 15 | 15 | - | 150 | 250 | ||
| Copper ppm Cu | 4 | - | 5 | 5 | - | 10 | |||
| Boron, ppm B | 20 | - | 25 | 25 | - | 60 | |||
| Nitrogen-to-sulfur ratio (N:S) | 12 | - | 15 | 8 | - | 12 | |||
| Sodium, % Na | 0.25 | - | 0.50 | ||||||
| Chloride, % Cl | 0.30 | - | 1.00 | ||||||
| Nitrate, ppm NO3-N | |||||||||
| Phosphate, ppm PO4-P | |||||||||
¶ Figure B.
Note: Leaf analysis can be a reliable indicator of a tree's nutrient status and used to diagnose problems occurring during the growing season. It is also useful to differentiate between nutritional problems and disease symptoms.
These plant analysis interpretations are developed from data collected across a wide range of conditions. Plant tissue levels can vary between varieties or be affected by conditions that affect nutrient uptake, Low nutrient levels may be due to deficiency or to dilution by intensive growth. High or excessive nutrient levels may be a sign of restricted growth allowing nutrients to accumulate in the plant tissue. Nutrient imbalance may be secondary to the primary problem.
Collecting "paired" samples (e.g.,"good" vs. "bad") greatly improves the diagnostic value of plant analysis. Paired sampling also allows comparison of the nutrient status of healthy trees to abnormal ones in situations outside the normal sampling routine.