⇦ Back to Soil Fertility and Plant Nutrition Home
¶ Head lettuce (Lactuca sativa)
| Table No: | Growth stage: | Plant part: |
| Table A | Rosette | Mature leaves |
| Table B | Heading | Wrapper leaf |
| Table C | Maturity | Wrapper leaf |
| Table D | Growing season | Midrib |
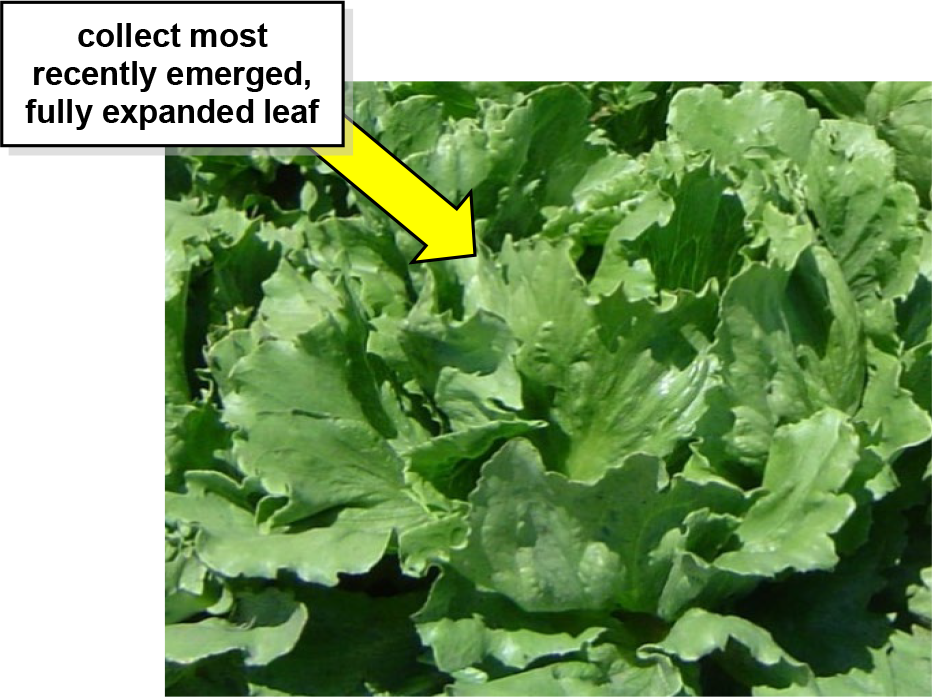
¶ A: Rosette
Plant Part: Most recently mature leaf
Sampling Procedure: Collect the youngest, but fully expanded leaves from 30 to 50 plants from a single planting block. Collect leaves that are free of insect or disease. At least a pint of loosely packed tissue (a ball about 4 to 5 inches in diameter) should be submitted for analysis. Place samples in paper bag, not plastic, for shipment.
| Analysis | Tissue Concentration Guidelines | ||||||||
| Low/Marginal Range | Sufficiency Range | Excessive, toxic? | |||||||
| Nitrogen, % N | 3.50 | - | 4.00 | 4.00 | - | 5.00 | |||
| Phosphorus, %P | 0.35 | - | 0.40 | 0.40 | - | 0.60 | |||
| Potassium, % K | 3.50 | - | 4.50 | 4.50 | - | 7.00 | |||
| Calcium, % Ca | 0.80 | - | 1.20 | 1.20 | - | 2.20 | |||
| Magnesium, % Mg | 0.30 | - | 0.40 | 0.40 | - | 0.70 | |||
| Sulfur, % S | 0.15 | - | 0.20 | 0.20 | - | 0.40 | |||
| Zinc, ppm Zn | 20 | - | 25 | 25 | - | 50 | |||
| Iron, ppm Fe | 40 | - | 50 | 50 | - | 150 | |||
| Manganese, ppm Mn | 15 | - | 20 | 20 | - | 50 | |||
| Copper ppm Cu | 4 | - | 5 | 5 | - | 10 | |||
| Boron, ppm B | 12 | - | 15 | 15 | - | 30 | |||
| Nitrogen-to-sulfur ratio (N:S) | |||||||||
| Sodium, % Na | |||||||||
| Chloride, % Cl | |||||||||
| Nitrate, ppm NO3-N | |||||||||
| Phosphate, ppm PO4-P | |||||||||
¶ Figure A.
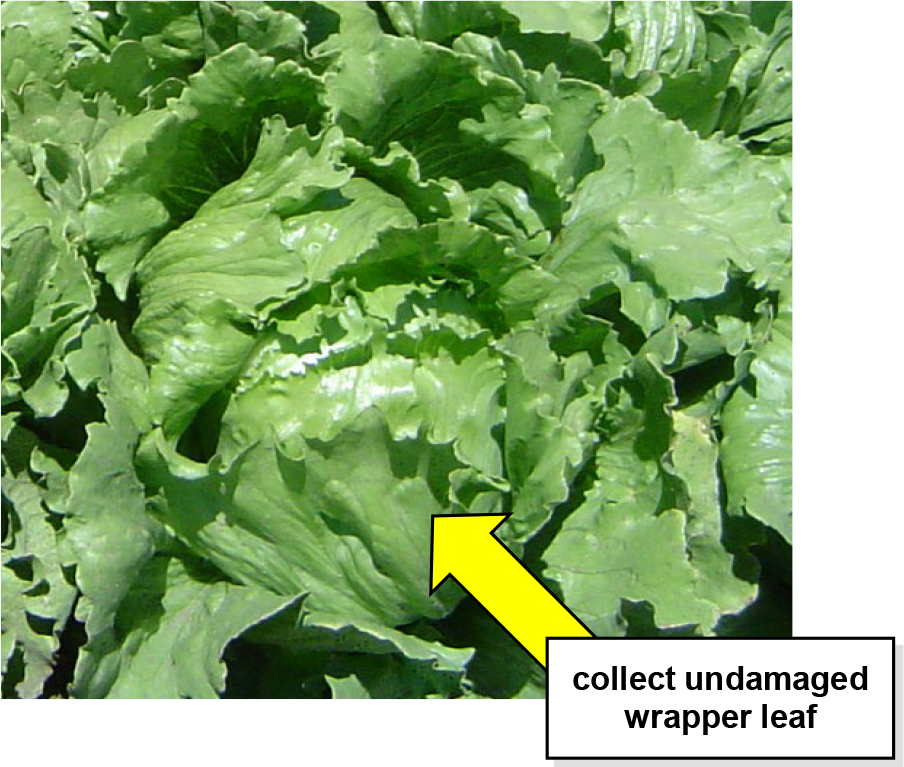
¶ B: Heading
Plant Part: Wrapper leaf
Sampling Procedure: Collect young, mature whole wrapper leaves from 25 to 40 plants. Samples should be collected from a single planting block. Collect leaves that are free of insect or disease. Place samples in a paper bag, not a plastic bag, for shipment to the laboratory.
| Analysis | Tissue Concentration Guidelines | ||||||||
| Low/Marginal Range | Sufficiency Range | Excessive, toxic? | |||||||
| Nitrogen, % N | 2.30 | - | 2.70 | 2.70 | - | 4.00 | |||
| Phosphorus, %P | 0.30 | - | 0.35 | 0.35 | - | 0.60 | |||
| Potassium, % K | 2.80 | - | 3.50 | 3.50 | - | 8.00 | |||
| Calcium, % Ca | 1.00 | - | 1.40 | 1.40 | - | 2.20 | |||
| Magnesium, % Mg | 0.25 | - | 0.30 | 0.30 | - | 0.70 | |||
| Sulfur, % S | 0.20 | - | 0.30 | 0.30 | - | 0.50 | |||
| Zinc, ppm Zn | 20 | - | 25 | 25 | - | 80 | |||
| Iron, ppm Fe | 40 | - | 50 | 50 | - | 350 | |||
| Manganese, ppm Mn | 20 | - | 30 | 30 | - | 80 | |||
| Copper ppm Cu | 4 | - | 5 | 5 | - | 10 | |||
| Boron, ppm B | 12 | - | 15 | 15 | - | 80 | |||
| Nitrogen-to-sulfur ratio (N:S) | |||||||||
| Sodium, % Na | |||||||||
| Chloride, % Cl | |||||||||
| Nitrate, ppm NO3-N | |||||||||
| Phosphate, ppm PO4-P | |||||||||
¶ Figure B.
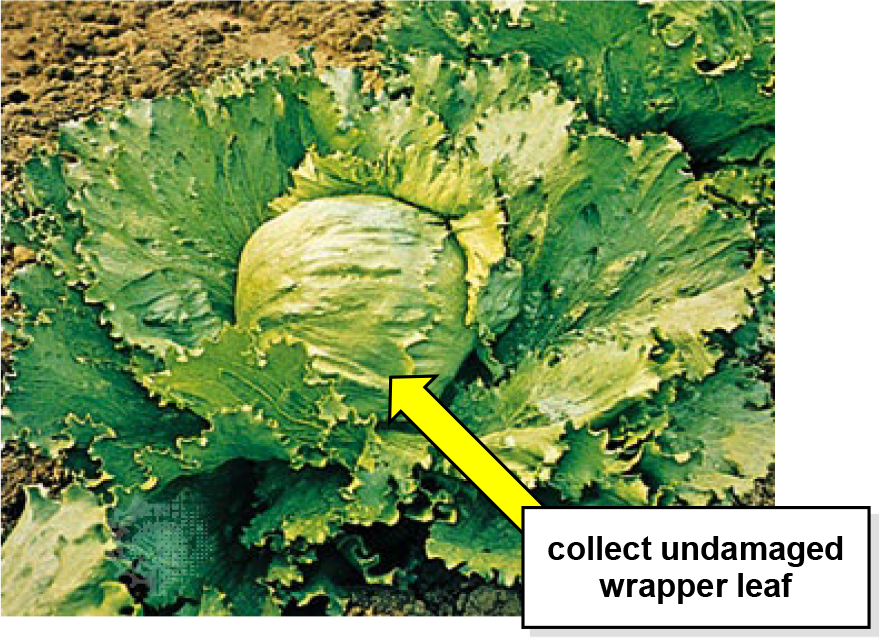
¶ C: Maturity
Plant Part: Wrapper leaves
Sampling Procedure: Collect whole wrapper leaves from 25 to 40 plants. Samples should be collected from a single planting block. Collect leaves that are free of insect or disease. Place samples in a paper bag, not a plastic bag, for shipment to the laboratory.
| Analysis | Tissue Concentration Guidelines | ||||||||
| Low/Marginal Range | Sufficiency Range | Excessive, toxic? | |||||||
| Nitrogen, % N | 2.00 | - | 3.00 | 3.00 | - | 5.00 | |||
| Phosphorus, %P | 0.25 | - | 0.30 | 0.30 | - | 0.60 | |||
| Potassium, % K | 2.80 | - | 3.50 | 3.50 | - | 9.00 | |||
| Calcium, % Ca | 1.20 | - | 1.40 | 1.40 | - | 2.30 | |||
| Magnesium, % Mg | 0.25 | - | 0.30 | 0.30 | - | 1.80 | |||
| Sulfur, % S | 0.20 | - | 0.25 | 0.25 | - | 0.50 | |||
| Zinc, ppm Zn | 20 | - | 25 | 25 | - | 150 | |||
| Iron, ppm Fe | 40 | - | 50 | 50 | - | 350 | |||
| Manganese, ppm Mn | 20 | - | 30 | 30 | - | 180 | |||
| Copper ppm Cu | 4 | - | 5 | 5 | - | 25 | |||
| Boron, ppm B | 12 | - | 20 | 20 | - | 70 | |||
| Nitrogen-to-sulfur ratio (N:S) | |||||||||
| Sodium, % Na | |||||||||
| Chloride, % Cl | |||||||||
| Nitrate, ppm NO3-N | |||||||||
| Phosphate, ppm PO4-P | |||||||||
¶ Figure C.
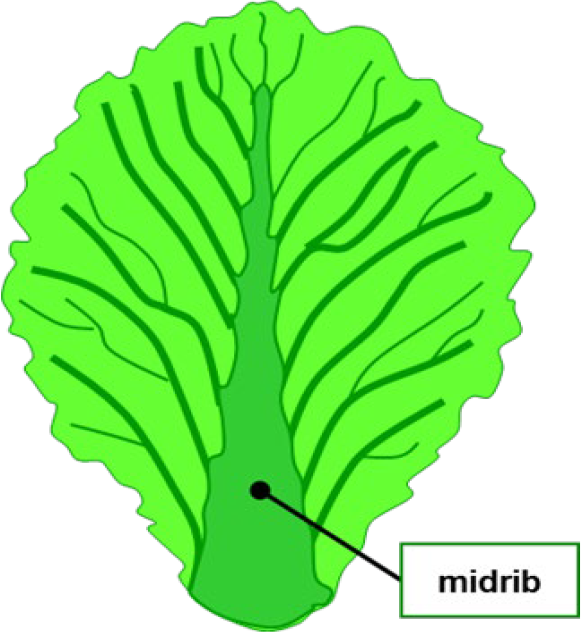
¶ D: Growing season
Plant Part: Midrib
Sampling Procedure: Collect the youngest, but full-sized leaves from 30 to 50 plants. Collect wrapper leaves during early heading. Separate the thickened midribs (mid-vein) from the center of the leaf and discard the remainding leaf blade. Collect leaves that are free of disease or insect damage.
| Analysis | Tissue Concentration Guidelines | |||||
| Rosette | Heading | |||||
| Nitrate, ppm NO3-N | ||||||
| severely deficient | <3000 | <2000 | ||||
| deficient | 3000 | - | 6000 | 2000 | - | 2800 |
| warning | 6000 | - | 8000 | 2800 | - | 3500 |
| adequate above 55°F | 8000 | - | 10000 | 3500 | - | 5000 |
| adequate below 55°F | >10000 | - | ||||
| Phosphate, ppm PO4-P | ||||||
| severely deficient | >1500 | <1200 | ||||
| deficient | 1500 | - | 1800 | 1200 | - | 1500 |
| warning | 1800 | - | 2200 | 1500 | - | 1800 |
| adequate above 55°F | 2200 | - | 3000 | 1800 | - | 2500 |
| Potassium, % K | ||||||
| severely deficient | < 4.20 | < 3.50 | ||||
| deficient | 4.20 | - | 4.50 | 3.50 | - | 3.90 |
| warning | 4.50 | - | 4.80 | 3.90 | - | 4.30 |
| adequate above 55°F | 4.80 | - | 6.00 | 4.30 | - | 5.50 |
¶ Figure D.
Note: Interpretations are based the relationship between nutrient levels in a particular part of a "standard" tissue in a specific time in the growing season.
These plant tissue ranges and interpretations are not considered valid with plant parts or growth stages other than those specified. These interpretations are developed from data collected across a wide range of crop, soil, and climate conditions.
Results from a single sample may be affected by time of day, climatic conditions, plant stress, age, or disease, that are not directly related to fertility status. Nutrient concentrations are not uniform throughout the plant and may change as the tissue matures.Tissue analysis trends should be evaluated by variety, growing season, and yield/quality goals. Collecting plant samples from the same location as soil samples allows comparison of soil nutrient availability with plant nutrient status.
Low nutrient levels may be due to deficiency or to dilution by intensive growth. High or excessive nutrient levels may be a sign of restricted growth allowing nutrients to accumulate in the plant tissue. Nutrient imbalance may be secondary to the primary problem.
Midrib analysisis considered to be a measure of recent crop nutrient uptake, because the measurement is made on the tissue that transports nutrients to the leaves, and the measurement is of 'unassimilated' nitrogen and phosphorous forms (NO3-N and PO4-P are the common chemical forms that are taken up from the soil, and have not yet been assimilated by the plant into organic compounds).
Whole leaf analysisprovides a more reliable estimate of crop nutrient status than midrib analysis because it measures all forms of N and P. Leaf nutrient concentrations also change more slowly than midribs and therefore provide a more stable basis upon which to base fertilization decisions.