⇦ Back to Soil Fertility and Plant Nutrition Home
¶ Lemon (Citrus limon)
¶ A: Spring cycle trees (Sept-Oct)
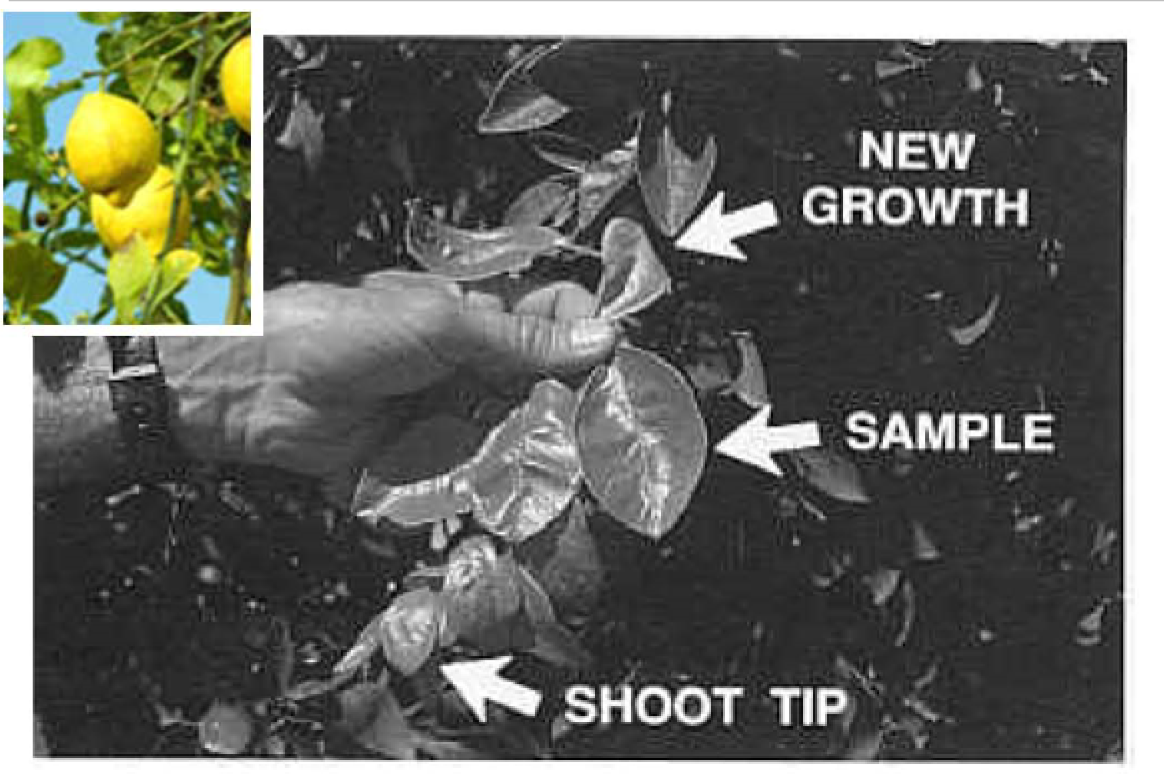
Plant Part: Four- to six-month old terminal leaves from nonfruiting shoots.
Sampling Procedure: Collect one leaf from at least 50 to 60 different healthy, undamaged trees of similar age and of same variety and rootstock from area of about five to ten acres within the orchard. Collect leaves from exposed nonfruiting and nonflushing shoots 3 to 5 feet above the ground. Be sure that the sample includes leaves picked from each side (NS-EW) of the trees.
| Analysis | Tissue Concentration Guidelines | ||||||||
| Low/Marginal Range | Sufficiency Range | Excessive, toxic? | |||||||
| Nitrogen, % N | 2.00 | - | 2.20 | 2.20 | - | 2.50 | |||
| Phosphorus, %P | 0.09 | - | 0.12 | 0.12 | - | 0.16 | |||
| Potassium, % K | 0.50 | - | 0.75 | 0.75 | - | 1.50 | |||
| Calcium, % Ca | 1.60 | - | 3.00 | 3.00 | - | 5.50 | |||
| Magnesium, % Mg | 0.15 | - | 0.25 | 0.25 | - | 0.60 | |||
| Sulfur, % S | 0.15 | - | 0.20 | 0.20 | - | 0.40 | |||
| Zinc, ppm Zn | 15 | - | 25 | 25 | - | 100 | 300 | ||
| Iron, ppm Fe | 35 | - | 60 | 60 | - | 125 | 250* | ||
| Manganese, ppm Mn | 10 | - | 25 | 25 | - | 100 | 500 | ||
| Copper ppm Cu | 3 | - | 5 | 5 | - | 15 | 50 | ||
| Boron, ppm B | 20 | - | 35 | 35 | - | 100 | 250 | ||
| Nitrogen-to-sulfur ratio (N:S) | 15 | - | 20 | 10 | - | 15 | |||
| Sodium, % Na | 0.25 | - | 0.50 | ||||||
| Chloride, % Cl | 0.25 | - | 0.50 | ||||||
| Nitrate, ppm NO3-N | |||||||||
| Phosphate, ppm PO4-P | |||||||||
¶ Figure A.
Note: Leaf analysis can be a reliable indicator of a tree's nutrient status and used to diagnose problems occurring during the growing season. It is also useful to differentiate between nutritional problems and disease symptoms.
These plant analysis interpretations are developed from data collected across a wide range of conditions. Plant tissue levels can vary between varieties or be affected by conditions that affect nutrient uptake, Low nutrient levels may be due to deficiency or to dilution by intensive growth. High or excessive nutrient levels may be a sign of restricted growth allowing nutrients to accumulate in the plant tissue. Nutrient imbalance may be secondary to the primary problem.
Collecting "paired" samples (e.g.,"good" vs. "bad") greatly improves the diagnostic value of plant analysis. Paired sampling also allows comparison of the nutrient status of healthy trees to abnormal ones in situations outside the normal sampling routine.