⇦ Back to Crop Management Home
¶ Grain sorghum (Sorghum bicolor)
| Table No: | Growth stage: | Plant part: |
| Table A | Emergence to 4-leaf | Whole plant |
| Table B | Six-leaf to 10-leaf | Youngest mature leaves |
| Table C | Boot stage | 2nd whole leaf from top |
| Table D | Heading to early bloom | 2nd whole leaf from top |
| Table E | Late bloom to maturity | 2nd whole leaf from top |
| Table F | Dough stage | 2nd whole leaf from top |
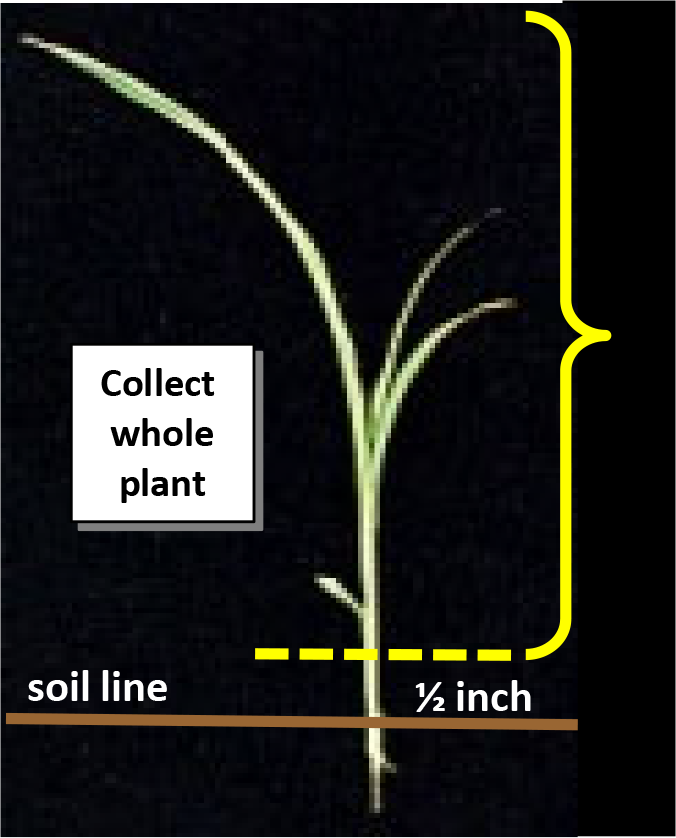
¶ A. Growth Stage: Emergence to 4-Leaf
Plant part: Whole plant
Sampling procedure: Collect 15 to 20 whole plants. Cut plants off about one-half inch above ground level. Do not include soil or roots in the sample.
| Analysis | Tissue Concentration Guidelines (from long-term survey data) | ||||||||
| Very Low to Low | Typical Range | High to Very High | |||||||
| Nitrogen, % N | 3.15 | - | 3.50 | 3.50 | - | 4.55 | 4.55 | - | 5.00 |
| Phosphorus, % P | 0.28 | - | 0.32 | 0.32 | - | 0.45 | 0.45 | - | 0.55 |
| Potassium, % K | 2.45 | - | 2.80 | 2.80 | - | 3.95 | 3.95 | - | 4.40 |
| Calcium, % Ca | 0.18 | - | 0.20 | 0.20 | - | 0.25 | 0.25 | - | 0.30 |
| Magnesium, % Mg | 0.34 | - | 0.40 | 0.40 | - | 0.60 | 0.60 | - | 0.80 |
| Sulfur, % S | 0.19 | - | 0.25 | 0.25 | - | 0.45 | 0.45 | - | 0.50 |
| Zinc, ppm Zn | 28 | - | 35 | 35 | - | 90 | 90 | - | 115 |
| Iron, ppm Fe | 154.7 | - | 195 | 195 | - | 525 | 525 | - | 890 |
| Manganese, ppm Mn | 50 | - | 70 | 70 | - | 130 | 130 | - | 165 |
| Copper ppm Cu | 10 | - | 11.4 | 11.4 | - | 16 | 16 | - | 18 |
| Boron, ppm B | 6 | - | 7 | 7 | - | 14 | 14 | - | 20 |
| Nitrogen-to-sulfur ratio (N:S) | 15 | - | 16 | 16 | - | 19 | 19 | - | 20 |
| Nitrogen-to-potassium (N:K) | 0.85 | - | 0.95 | 0.95 | - | 1.35 | 1.35 | - | 1.67 |
| Sodium, % Na | ---- | 0.010 | - | 0.015 | 0.015 | - | 0.027 | ||
| Chloride, % Cl | 0.12 | - | 0.26 | 0.26 | - | 0.80 | 0.80 | - | 1.35 |
¶ Figure A.
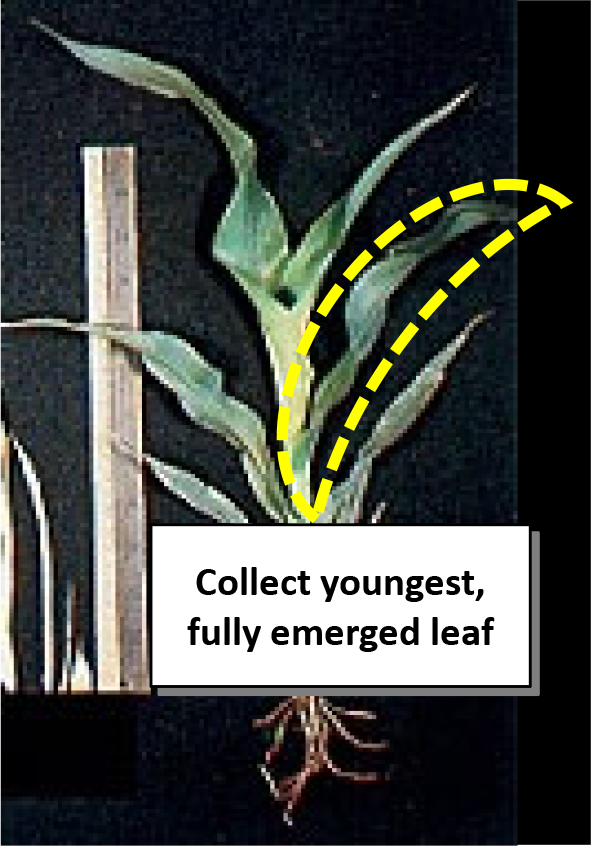
¶ B. Growth Stage: Six-Leaf to 10-Leaf
Plant part: Youngest mature leaf
Sampling procedure: Collect 15 to 20 leaves. Start at the top of the whorl and remove the first leaf with a fully exposed collar (i.e., the "joint" between the leaf and the stem sheath). Discard the collar.
| Analysis | Tissue Concentration Guidelines (from long-term survey data) | ||||||||
| Very Low to Low | Typical range | High to Very High | |||||||
| Nitrogen, % N | 2.60 | - | 2.90 | 2.90 | - | 3.90 | 3.90 | - | 4.40 |
| Phosphorus, % P | 0.20 | - | 0.23 | 0.23 | - | 0.36 | 0.36 | - | 0.43 |
| Potassium, % K | 1.85 | - | 2.10 | 2.10 | - | 3.10 | 3.10 | - | 3.55 |
| Calcium, % Ca | 0.15 | - | 0.17 | 0.17 | - | 0.23 | 0.23 | - | 0.27 |
| Magnesium, % Mg | 0.25 | - | 0.30 | 0.30 | - | 0.50 | 0.50 | - | 0.65 |
| Sulfur, % S | 0.14 | - | 0.16 | 0.16 | - | 0.30 | 0.30 | - | 0.40 |
| Zinc, ppm Zn | 18 | - | 20 | 20 | - | 35 | 35 | - | 55 |
| Iron, ppm Fe | 110 | - | 125 | 125 | - | 230 | 230 | - | 350 |
| Manganese, ppm Mn | 35 | - | 40 | 40 | - | 75 | 75 | - | 115 |
| Copper ppm Cu | 8 | - | 9 | 9 | - | 14 | 14 | - | 17 |
| Boron, ppm B | 5 | - | 6 | 6 | - | 14 | 14 | - | 26 |
| Nitrogen-to-sulfur ratio (N:S) | 14 | - | 15 | 15 | - | 18 | 18 | - | 20 |
| Nitrogen-to-potassium (N:K) | 0.95 | - | 1.10 | 1.10 | - | 1.50 | 1.50 | - | 1.80 |
| Sodium, % Na | ----- | ----- | 0.010 | - | 0.021 | ||||
| Chloride, % Cl | 0.55 | - | 0.60 | 0.60 | - | 0.75 | 0.75 | - | 0.78 |
¶ Figure B.
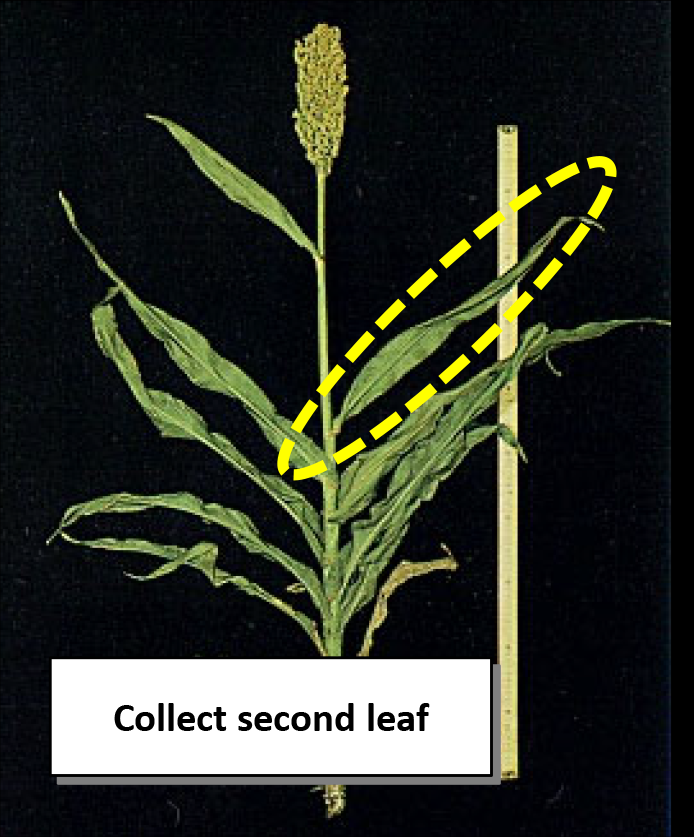
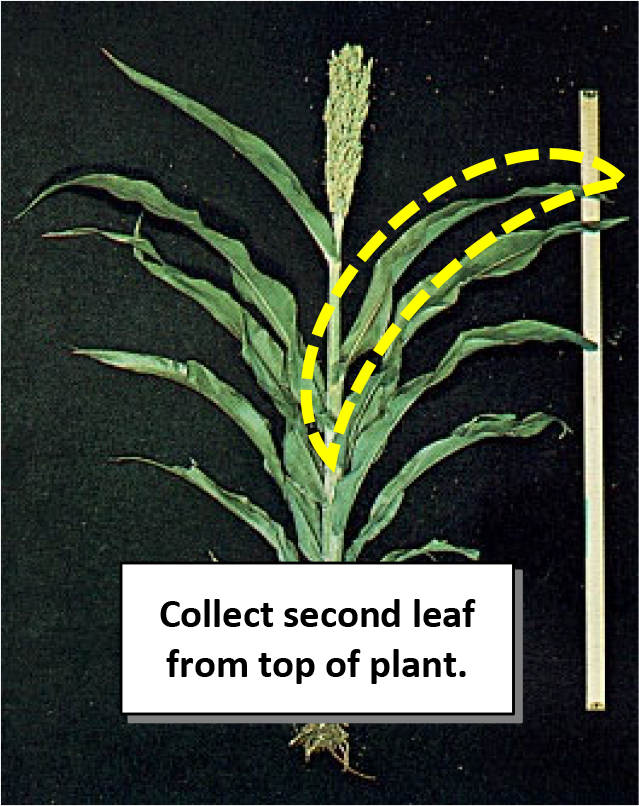
¶ C. Growth Stage: Boot Stage
Plant part: Youngest mature leaf
Sampling procedure: Collect leaves from 15 to 20 representative plants. Collect the second leaf from the top of the plant. Discard the leaf collar.
| Analysis | Tissue Concentration Guidelines (from long-term survey data) | ||||||||
| Very Low to Low | Typical range | High to Very High | |||||||
| Nitrogen, % N | 2.50 | - | 2.70 | 2.70 | - | 3.35 | 3.35 | - | 3.75 |
| Phosphorus, % P | 0.22 | - | 0.25 | 0.25 | - | 0.35 | 0.35 | - | 0.40 |
| Potassium, % K | 1.55 | - | 1.70 | 1.70 | - | 2.45 | 2.45 | - | 3.00 |
| Calcium, % Ca | 0.14 | - | 0.15 | 0.15 | - | 0.19 | 0.19 | - | 0.22 |
| Magnesium, % Mg | 0.22 | - | 0.25 | 0.25 | - | 0.45 | 0.45 | - | 0.55 |
| Sulfur, % S | 0.14 | - | 0.16 | 0.16 | - | 0.27 | 0.27 | - | 0.36 |
| Zinc, ppm Zn | 18 | - | 19.75 | 19.75 | - | 30 | 30 | - | 40 |
| Iron, ppm Fe | 110 | - | 120 | 120 | - | 180 | 180 | - | 240 |
| Manganese, ppm Mn | 31 | - | 35 | 35 | - | 59.5 | 59.5 | - | 80 |
| Copper ppm Cu | 8 | - | 9 | 9 | - | 13 | 13 | - | 16 |
| Boron, ppm B | 5 | - | 7 | 7 | - | 16 | 16 | - | 25 |
| Nitrogen-to-sulfur ratio (N:S) | 15 | - | 16 | 16 | - | 19 | 19 | - | 20 |
| Nitrogen-to-potassium (N:K) | 1.05 | - | 1.15 | 1.15 | - | 1.60 | 1.60 | - | 1.95 |
| Sodium, % Na | ----- | ----- | ----- | ||||||
| Chloride, % Cl | ----- | ----- | ----- | ||||||
¶ Figure C.
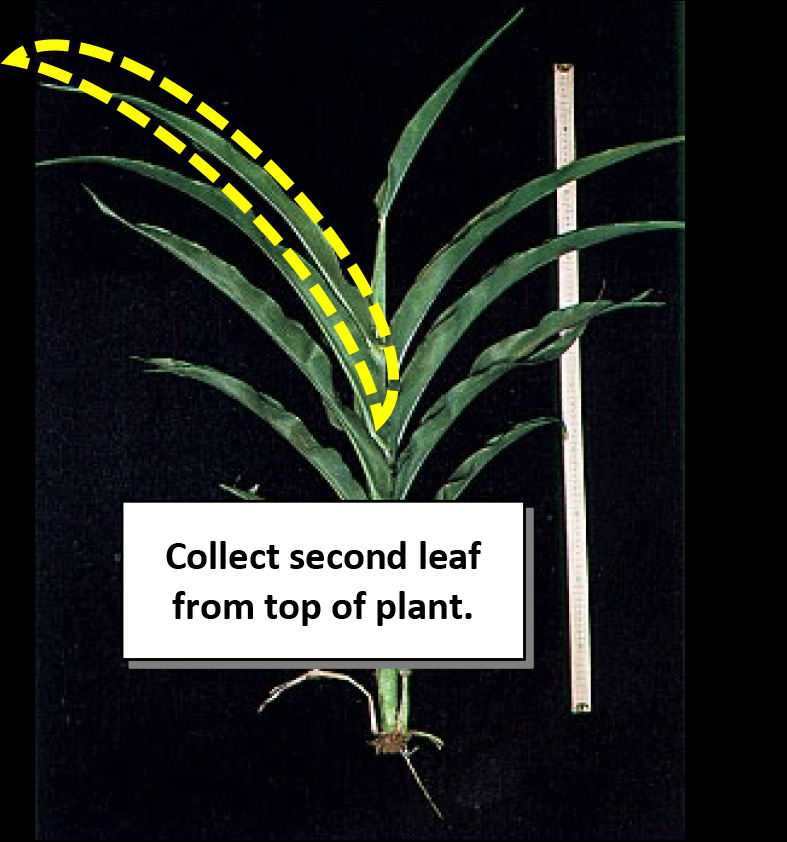
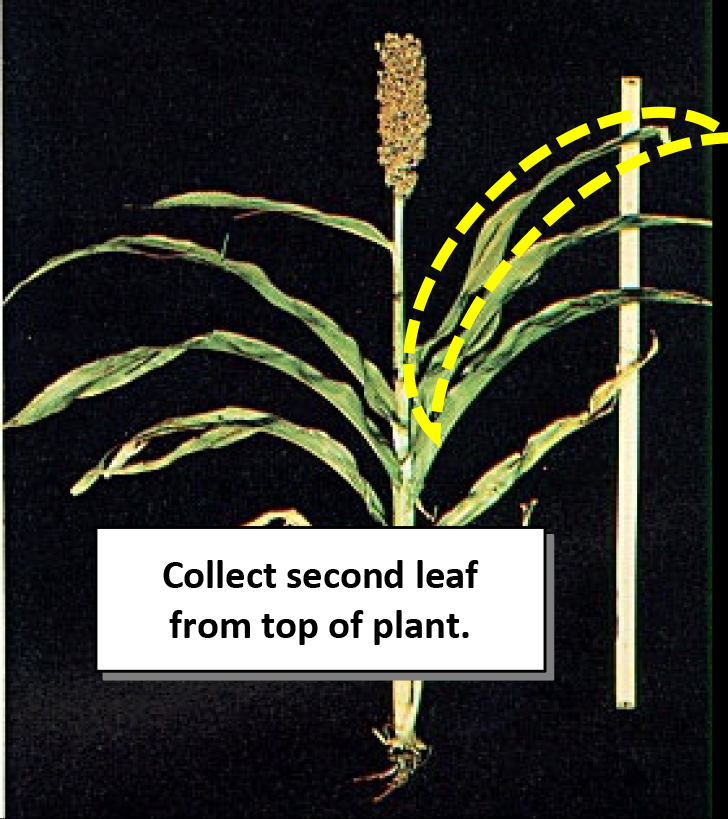
¶ D. Growth Stage: Heading to Early Bloom
Plant part: Youngest mature leaf
Sampling procedure: Collect leaves from 15 to 20 representative plants. Collect the second leaf from the top of the plant. Discard the leaf collar.
| Analysis | Tissue Concentration Guidelines (from long-term survey data) | ||||||||
| Very Low to Low | Typical range | High to Very High | |||||||
| Nitrogen, % N | 2.27 | - | 2.50 | 2.50 | - | 3.30 | 3.30 | - | 3.60 |
| Phosphorus, % P | 0.20 | - | 0.23 | 0.23 | - | 0.35 | 0.35 | - | 0.40 |
| Potassium, % K | 1.45 | - | 1.55 | 1.55 | - | 2.10 | 2.10 | - | 2.40 |
| Calcium, % Ca | 0.13 | - | 0.14 | 0.14 | - | 0.19 | 0.19 | - | 0.20 |
| Magnesium, % Mg | 0.33 | - | 0.40 | 0.40 | - | 0.60 | 0.60 | - | 0.80 |
| Sulfur, % S | 0.15 | - | 0.17 | 0.17 | - | 0.25 | 0.25 | - | 0.35 |
| Zinc, ppm Zn | 16 | - | 18 | 18 | - | 30 | 30 | - | 40 |
| Iron, ppm Fe | 105 | - | 120 | 120 | - | 185 | 185 | - | 265 |
| Manganese, ppm Mn | 35 | - | 40 | 40 | - | 75 | 75 | - | 100 |
| Copper ppm Cu | 6.1 | - | 8 | 8 | - | 12 | 12 | - | 16 |
| Boron, ppm B | 5 | - | 6 | 6 | - | 20 | 20 | - | 40 |
| Nitrogen-to-sulfur ratio (N:S) | 15 | - | 16 | 16 | - | 19 | 19 | - | 20 |
| Nitrogen-to-potassium (N:K) | 1.10 | - | 1.25 | 1.25 | - | 1.85 | 1.85 | - | 2.20 |
| Sodium, % Na | ----- | ----- | ----- | ||||||
| Chloride, % Cl | ----- | ----- | ----- | ||||||
¶ Figure D.
¶ E. Growth Stage: Late Bloom to Maturity
Plant part: Youngest mature leaf
Sampling procedure: Collect leaves from 15 to 20 representative plants. Collect the second leaf from the top of the plant. Discard the leaf collar.
| Analysis | Tissue Concentration Guidelines (from long-term survey data) | ||||||||
| Very Low to Low | Typical range | High to Very High | |||||||
| Nitrogen, % N | 1.75 | - | 2.10 | 2.10 | - | 2.95 | 2.95 | - | 3.25 |
| Phosphorus, % P | 0.16 | - | 0.20 | 0.20 | - | 0.30 | 0.30 | - | 0.40 |
| Potassium, % K | 1.30 | - | 1.45 | 1.45 | - | 2.00 | 2.00 | - | 2.25 |
| Calcium, % Ca | 0.12 | - | 0.13 | 0.13 | - | 0.17 | 0.17 | - | 0.19 |
| Magnesium, % Mg | 0.38 | - | 0.45 | 0.45 | - | 0.70 | 0.70 | - | 0.90 |
| Sulfur, % S | 0.14 | - | 0.16 | 0.16 | - | 0.25 | 0.25 | - | 0.32 |
| Zinc, ppm Zn | 16 | - | 18 | 18 | - | 24 | 24 | - | 32 |
| Iron, ppm Fe | 120 | - | 135 | 135 | - | 245 | 245 | - | 335 |
| Manganese, ppm Mn | 40 | - | 50 | 50 | - | 90 | 90 | - | 114.5 |
| Copper ppm Cu | 7 | - | 8 | 8 | - | 12 | 12 | - | 14 |
| Boron, ppm B | 7 | - | 9 | 9 | - | 30 | 30 | - | 55 |
| Nitrogen-to-sulfur ratio (N:S) | 14 | - | 15 | 15 | - | 18 | 18 | - | 19 |
| Nitrogen-to-potassium (N:K) | 1.00 | - | 1.10 | 1.10 | - | 1.80 | 1.80 | - | 2.20 |
| Sodium, % Na | ----- | ----- | ----- | ||||||
| Chloride, % Cl | ----- | ----- | ----- | ||||||
¶ Figure E.
¶ F. Growth Stage: Dough Stage
Plant part: Whole leaves
Sampling procedure: Collect leaves from 15 to 20 representative plants. Collect the second leaf from the top of the plant. Discard the leaf collar.
| Analysis | Tissue Concentration Guidelines (from long-term survey data) | ||||||||
| Very Low to Low | Typical range | High to Very High | |||||||
| Nitrogen, % N | 1.70 | - | 1.95 | 1.95 | - | 2.75 | 2.75 | - | 3.05 |
| Phosphorus, % P | 0.14 | - | 0.17 | 0.17 | - | 0.27 | 0.27 | - | 0.35 |
| Potassium, % K | 1.25 | - | 1.40 | 1.40 | - | 1.90 | 1.90 | - | 2.00 |
| Calcium, % Ca | 0.12 | - | 0.12 | 0.12 | - | 0.17 | 0.17 | - | 0.20 |
| Magnesium, % Mg | 0.50 | - | 0.60 | 0.60 | - | 0.85 | 0.85 | - | 1.05 |
| Sulfur, % S | 0.13 | - | 0.17 | 0.17 | - | 0.30 | 0.30 | - | 0.35 |
| Zinc, ppm Zn | 14.85 | - | 16 | 16 | - | 30 | 30 | - | 40 |
| Iron, ppm Fe | 125 | - | 145 | 145 | - | 245.25 | 245.25 | - | 370 |
| Manganese, ppm Mn | 47 | - | 55 | 55 | - | 90 | 90 | - | 115 |
| Copper ppm Cu | 7 | - | 8 | 8 | - | 12 | 12 | - | 15 |
| Boron, ppm B | 6.05 | - | 9 | 9 | - | 29.75 | 29.75 | - | 50 |
| Nitrogen-to-sulfur ratio (N:S) | 13 | - | 14 | 14 | - | 17 | 17 | - | 18 |
| Nitrogen-to-potassium (N:K) | 0.85 | - | 1.05 | 1.05 | - | 1.80 | 1.80 | - | 2.15 |
| Sodium, % Na | ----- | ----- | ----- | ||||||
| Chloride, % Cl | ----- | ----- | ----- | ||||||
¶ Figure F.