⇦ Back to Soil Fertility and Plant Nutrition Home
¶ Cranberry (Vaccinium macrocarpon)
| Table No: | Growth stage: | Plant part: |
| Table A | June (late spring) | Upright tips: new growth |
| Table B | Mid-August to mid-September (stable growth) | Upright tips: new growth |
¶ A: June (late spring)
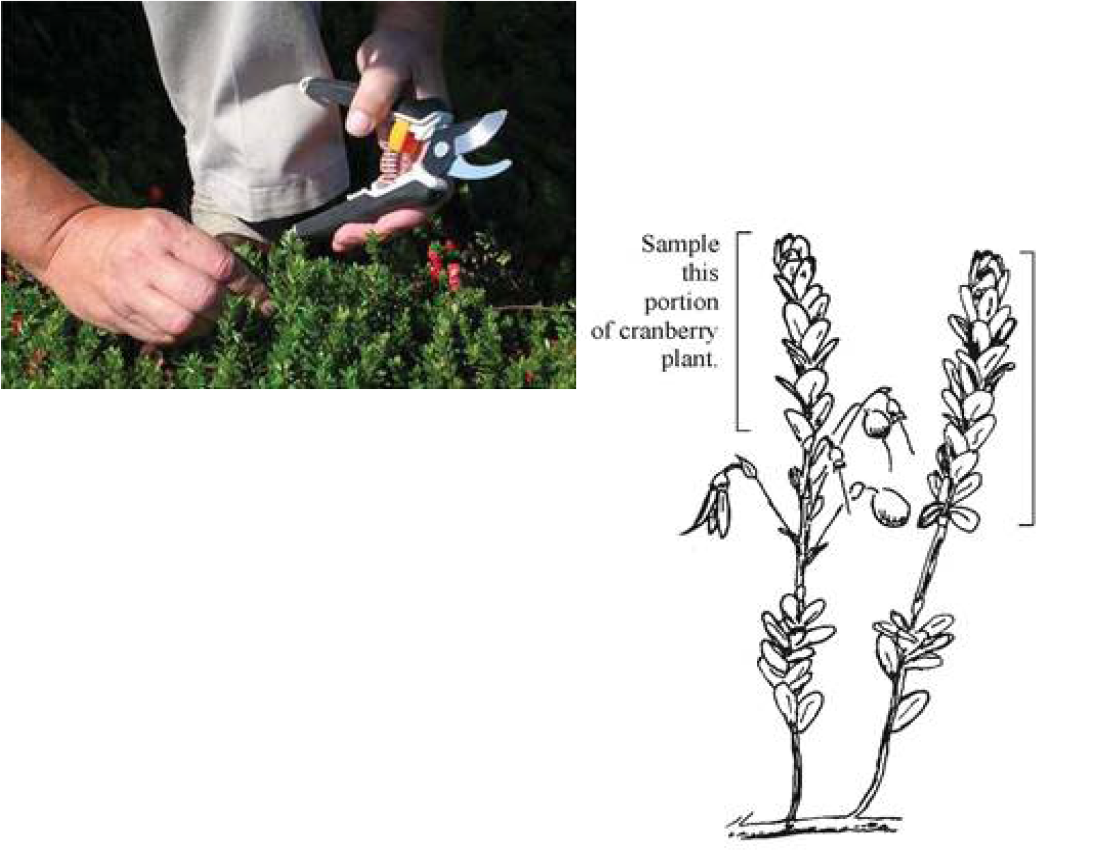
Plant Part: Upright tips: new growth, including leaves
Sampling Procedure: Collect at least 60 to 80 uprights randomly to represent the planting in a single bed. Collect the top 2 inches of the new growth uprights from about 15 to 20 locations within the bed. Do not include last season's growth or dormant plants. Clip just above berries or above bud-break location. The sample should contain a representative mix of vegetative and flowering uprights.
| Analysis | Tissue Concentration Guidelines | ||||||||
| Low/Marginal Range | Sufficiency Range | Excessive, toxic? | |||||||
| Nitrogen, % N | 0.90 | - | 1.20 | 1.20 | - | 1.50 | |||
| Phosphorus, %P | 0.12 | - | 0.15 | 0.15 | - | 0.25 | |||
| Potassium, % K | 0.65 | - | 0.70 | 0.70 | - | 0.90 | |||
| Calcium, % Ca | 0.25 | - | 0.30 | 0.30 | - | 0.80 | |||
| Magnesium, % Mg | 0.12 | - | 0.15 | 0.15 | - | 0.25 | |||
| Sulfur, % S | 0.05 | - | 0.08 | 0.08 | - | 0.25 | |||
| Zinc, ppm Zn | 12 | - | 15.0 | 15 | - | 30 | |||
| Iron, ppm Fe | 20 | - | 30 | 30 | - | 120 | |||
| Manganese, ppm Mn | 10 | - | 25 | 25 | - | 150 | 500 | - | 600 |
| Copper ppm Cu | 3 | - | 5 | 5 | - | 10 | |||
| Boron, ppm B | 12 | - | 15 | 15 | - | 60 | |||
| Nitrogen-to-sulfur ratio (N:S) | |||||||||
| Sodium, % Na | |||||||||
| Chloride, % Cl | |||||||||
| Nitrate, ppm NO3-N | |||||||||
| Phosphate, ppm PO4-P | |||||||||
¶ Figure A.
¶ B: Mid-August to mid-September (stable growth)
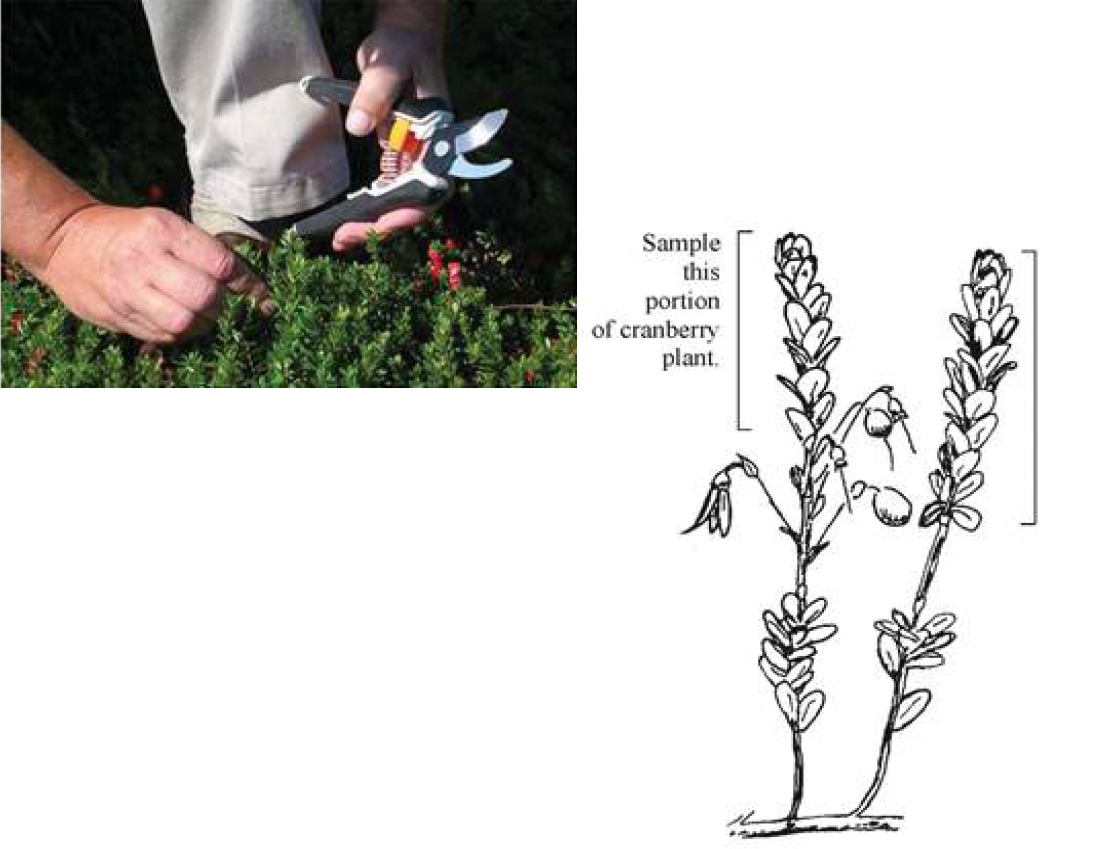
Plant Part: Upright tips: new growth, including leaves
Sampling Procedure: Collect at least 60 to 80 uprights randomly to represent the planting in a single bed. Collect the top 2 inches of the new growth uprights from about 15 to 20 locations within the bed. Do not include last season's growth or dormant plants. Clip just above berries or above bud-break location. The sample should contain a representative mix of vegetative and flowering uprights.
| Analysis | Tissue Concentration Guidelines | ||||||||
| Low/Marginal Range | Sufficiency Range | Excessive, toxic? | |||||||
| Nitrogen, % N | 0.75 | - | 0.90 | 0.90 | - | 1.10 | > 1.30 * | ||
| Phosphorus, %P | 0.08 | - | 0.10 | 0.10 | - | 0.20 | |||
| Potassium, % K | 0.32 | - | 0.40 | 0.40 | - | 0.75 | |||
| Calcium, % Ca | 0.25 | - | 0.30 | 0.30 | - | 0.80 | |||
| Magnesium, % Mg | 0.12 | - | 0.15 | 0.15 | - | 0.25 | |||
| Sulfur, % S | 0.05 | - | 0.08 | 0.08 | - | 0.25 | |||
| Zinc, ppm Zn | 12 | - | 15.0 | 15 | - | 30 | |||
| Iron, ppm Fe | 20 | - | 30 | 30 | - | 120 | |||
| Manganese, ppm Mn | 10 | - | 25 | 25 | - | 150 | 500 | - | 600 |
| Copper ppm Cu | 3 | - | 5 | 5 | - | 10 | |||
| Boron, ppm B | 12 | - | 15 | 15 | - | 60 | |||
| Nitrogen-to-sulfur ratio (N:S) | |||||||||
| Sodium, % Na | |||||||||
| Chloride, % Cl | |||||||||
| Nitrate, ppm NO3-N | |||||||||
| Phosphate, ppm PO4-P | |||||||||
¶ Figure B.
Note: Interpretations are based the relationship between nutrient levels in a particular part of a "standard" tissue in a specific time in the growing season.
These plant tissue ranges and interpretations are not considered valid with plant parts or growth stages other than those specified. These interpretations are developed from data collected across a wide range of crop, soil, and climate conditions.
Results from a single may be affected by time of day, climatic conditions, plant stress, age, or disease, that are not directly related to fertility status. Nutrient concentrations are not uniform throughout the plant and may change as the tissue matures
Tissue analysis trends should be evaluated by variety, growing season, and yield/quality goals. Collecting plant samples from the same location as soil samples allows comparison of soil nutrient availability with plant nutrient status.Low nutrient levels may be due to deficiency or to dilution by intensive growth. High or excessive nutrient levels may be a sign of restricted growth allowing nutrients to accumulate in the plant tissue. Nutrient imbalance may be secondary to the primary problem.