⇦ Back to Soil Fertility and Plant Nutrition Home
¶ Cowpeas (Vigna unguiculata)
| Table No: | Growth stage: | Plant part: |
| Table A | Pre-bloom | Mature trifoliate |
| Table B | First bloom | Mature trifoliate |
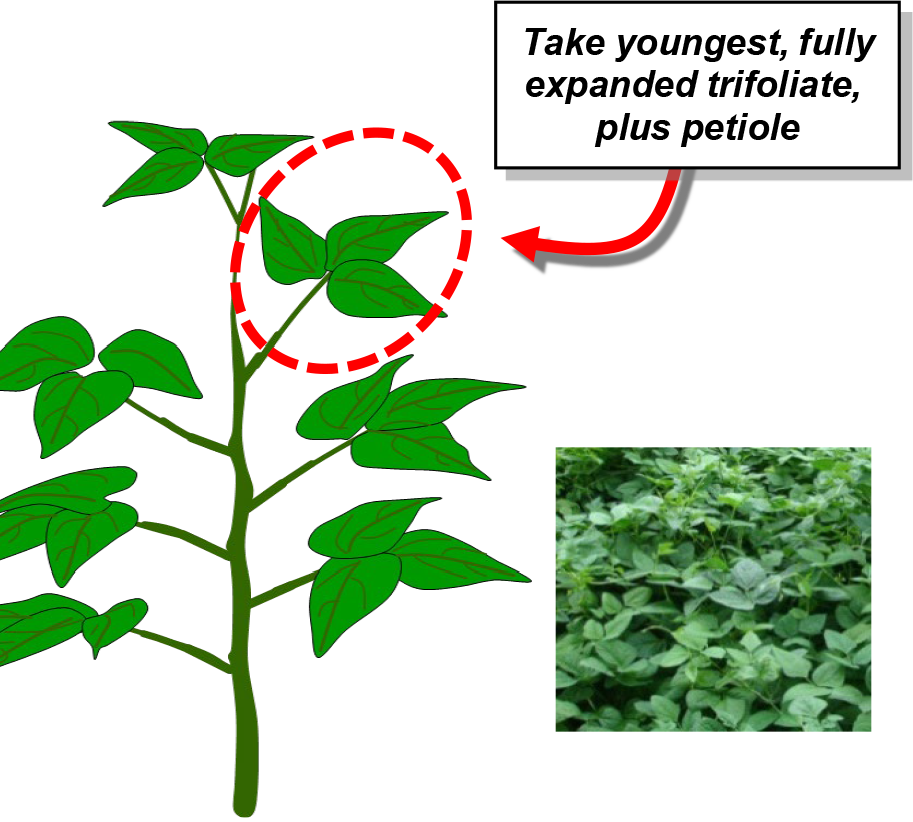
¶ A: Pre bloom
Plant Part: Youngest, fully-developed leaves
Sampling Procedure: Begin from top of plant and collect most recently, fully expanded trifoliates from 15 to 20 plants. Include both leaf blades and petiole. Collect leaves that are free of insect or disease. Submit at least a pint of loosely packed tissue (a ball about 4 to 5 inches in diameter). Place samples in paper bag, not plastic, for shipment.
| Analysis | Tissue Concentration Guidelines | ||||||||
| Low/Marginal Range | Sufficiency Range | Excessive, toxic? | |||||||
| Nitrogen, % N | 3.20 | - | 3.50 | 3.50 | - | 5.00 | |||
| Phosphorus, %P | 0.27 | - | 0.30 | 0.30 | - | 0.80 | |||
| Potassium, % K | 1.80 | - | 2.00 | 2.00 | - | 4.00 | |||
| Calcium, % Ca | 0.80 | - | 1.00 | 1.00 | - | 1.50 | |||
| Magnesium, % Mg | 0.25 | - | 0.30 | 0.30 | - | 0.50 | |||
| Sulfur, % S | 0.18 | - | 0.20 | 0.20 | - | 0.40 | |||
| Zinc, ppm Zn | 17 | - | 20.0 | 20 | - | 40 | |||
| Iron, ppm Fe | 25 | - | 30 | 30 | - | 100 | |||
| Manganese, ppm Mn | 25 | - | 30 | 30 | - | 100 | |||
| Copper ppm Cu | 3 | - | 5 | 5 | - | 10 | |||
| Boron, ppm B | 12 | - | 15 | 15 | - | 25 | |||
| Nitrogen-to-sulfur ratio (N:S) | |||||||||
| Sodium, % Na | |||||||||
| Chloride, % Cl | |||||||||
¶ Figure A.
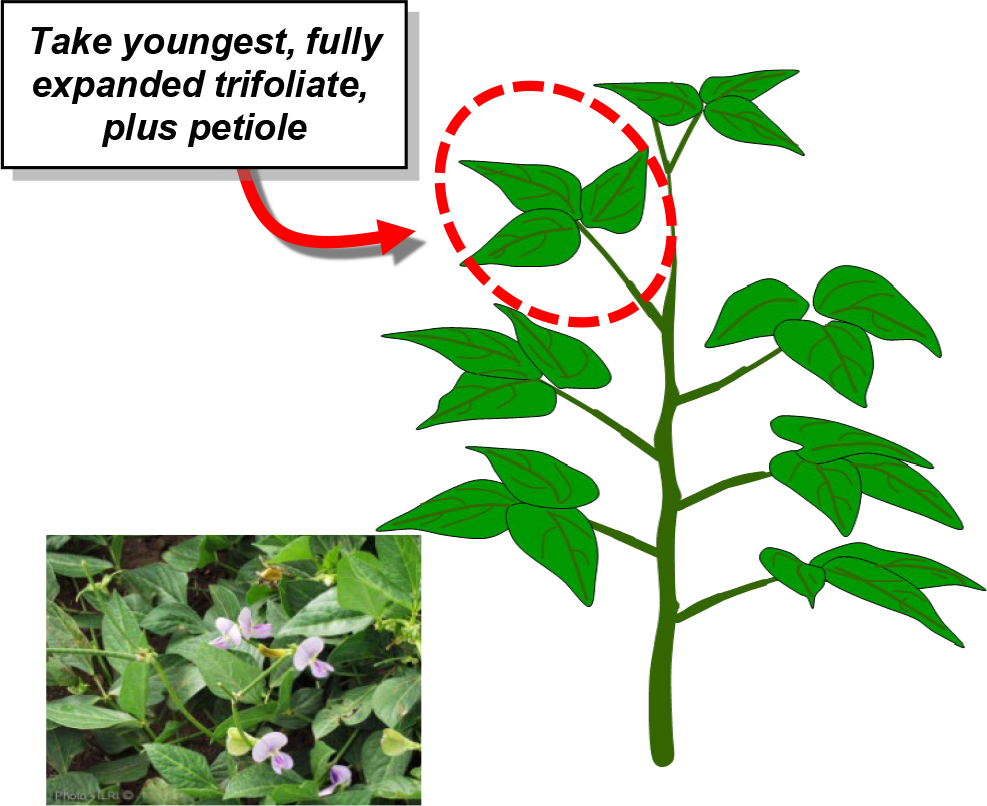
¶ B: First bloom
Plant Part: Youngest, fully developed trifoliate
Sampling Procedure: Begin from top of plant and collect most recently, fully expanded trifoliates from 15 to 20 plants. Include both leaf blades and petiole. Collect leaves that are free of insect or disease. Submit at least a pint of loosely packed tissue (a ball about 4 to 5 inches in diameter). Place samples in paper bag, not plastic, for shipment.
| Analysis | Tissue Concentration Guidelines | ||||||||
| Low/Marginal Range | Sufficiency Range | Excessive, toxic? | |||||||
| Nitrogen, % N | 2.20 | - | 2.50 | 2.50 | - | 4.00 | |||
| Phosphorus, %P | 0.17 | - | 0.20 | 0.20 | - | 0.40 | |||
| Potassium, % K | 1.80 | - | 2.00 | 2.00 | - | 4.00 | |||
| Calcium, % Ca | 0.80 | - | 1.00 | 1.00 | - | 1.50 | |||
| Magnesium, % Mg | 0.25 | - | 0.30 | 0.30 | - | 0.50 | |||
| Sulfur, % S | 0.18 | - | 0.20 | 0.20 | - | 0.40 | |||
| Zinc, ppm Zn | 17 | - | 20.0 | 20 | - | 40 | |||
| Iron, ppm Fe | 25 | - | 30 | 30 | - | 100 | |||
| Manganese, ppm Mn | 25 | - | 30 | 30 | - | 300 | |||
| Copper ppm Cu | 3 | - | 5 | 5 | - | 10 | |||
| Boron, ppm B | 12 | - | 15 | 15 | - | 25 | |||
| Nitrogen-to-sulfur ratio (N:S) | |||||||||
| Sodium, % Na | |||||||||
| Chloride, % Cl | |||||||||
¶ Figure B.
Note: Interpretations are based the relationship between nutrient levels in a particular part of a "standard" tissue in a specific time in the growing season. These plant tissue ranges and interpretations are not considered valid with plant parts or growth stages other than those specified. These interpretations are developed from data collected across a wide range of crop, soil, and climate conditions.
Results from a single sample may be affected by time of day, climatic conditions, plant stress, age, or disease, that are not directly related to fertility status. Nutrient concentrations are not uniform throughout the plant and may change as the tissue matures.Tissue analysis trends should be evaluated by variety, growing season, and yield/quality goals. Collecting plant samples from the same location as soil samples allows comparison of soil nutrient availability with plant nutrient status.Low nutrient levels may be due to deficiency or to dilution by intensive growth. High or excessive nutrient levels may be a sign of restricted growth allowing nutrients to accumulate in the plant tissue. Nutrient imbalance may be secondary to the primary problem.