⇦ Back to Soil Fertility and Plant Nutrition Home
¶ Cotton (Gossypium hirsutum)
| Table No: | Growth stage: | Plant part: |
| Table A | Emergence to match-head square | Leaf blade |
| Table B | Match-head square to first bloom | Leaf blade |
| Table C | First bloom | Leaf blade |
| Table D | Early flowering to peak bloom | Leaf blade |
| Table E | Peak bloom to boll-fill | Leaf blade |
| Table F | Boll-fill | Leaf blade |
| Table G | Seasonal monitoring, "Arkansas interpretation" | Petiole |
| Table H | Seasonal monitoring, "Georgia interpretation" | Petiole |
| Table I | Seasonal monitoring, "Texas interpretation" | Petiole |
| Table J | Cotton Nutrient Uptake |
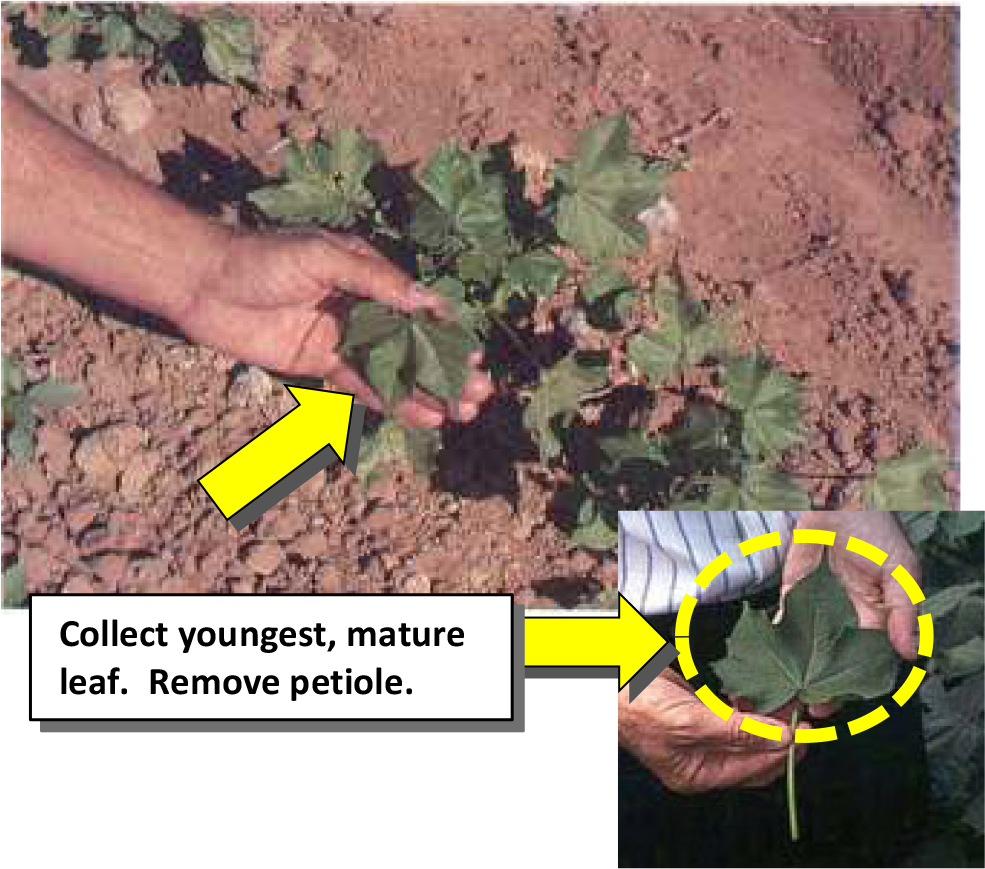
¶ A. Emergence to Match-Head Square
Plant Part: Leaf blade
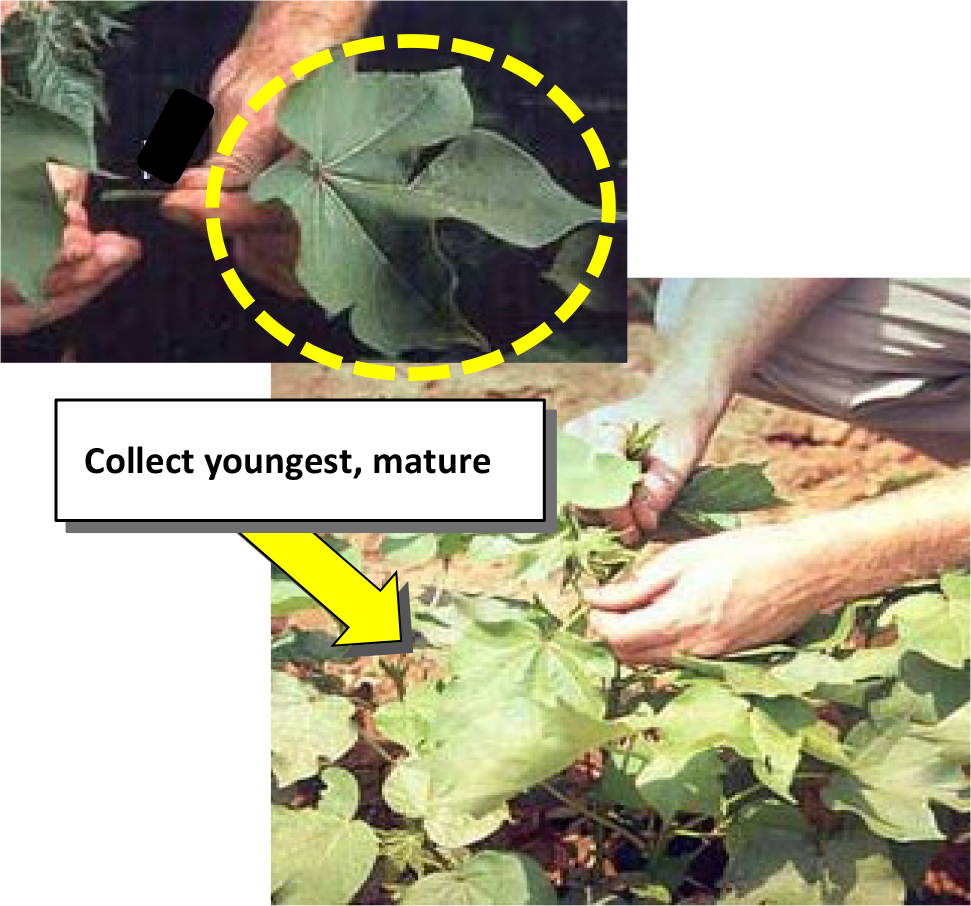
Sampling Procedure: Collect uppermost, mature leaf blade from the vegetative stem.It is better to collect a slightly older leaf than one that is too young.Discard the petiole. Collect leaves from 25 to 35 plants.
| Analysis | Tissue Concentration Guidelines | ||||||||
| Low/Marginal Range | Sufficiency Range | High/Excessive | |||||||
| Nitrogen, % N | 3.20 | - | 3.50 | 3.50 | - | 4.50 | |||
| Phosphorus, %P | 0.28 | - | 0.30 | 0.30 | - | 0.50 | |||
| Potassium, % K | 1.30 | - | 1.50 | 1.50 | - | 3.00 | |||
| Calcium, % Ca | 1.80 | - | 2.00 | 2.00 | - | 3.50 | |||
| Magnesium, % Mg | 0.25 | - | 0.30 | 0.30 | - | 0.90 | |||
| Sulfur, % S | 0.20 | - | 0.25 | 0.25 | - | 1.00 | |||
| Zinc, ppm Zn | 15 | - | 20 | 20 | - | 100 | |||
| Iron, ppm Fe | 40 | - | 50 | 50 | - | 300 | 500 | - | 1000* |
| Manganese, ppm Mn | 10 | - | 25 | 25 | - | 300 | |||
| Copper ppm Cu | 3 | - | 5 | 5 | - | 25 | |||
| Boron, ppm B | 15 | - | 20 | 20 | - | 60 | |||
| Nitrogen-to-sulfur ratio (N:S) | 8 | - | 12 | 12 | - | 18 | |||
| Sodium, % Na | - | - | 0.25 | - | 0.50 | ||||
| Chloride, % Cl | - | - | 0.30 | - | 1.00 | ||||
* Excess iron indicates "iron chlorosis".
¶ Figure A.
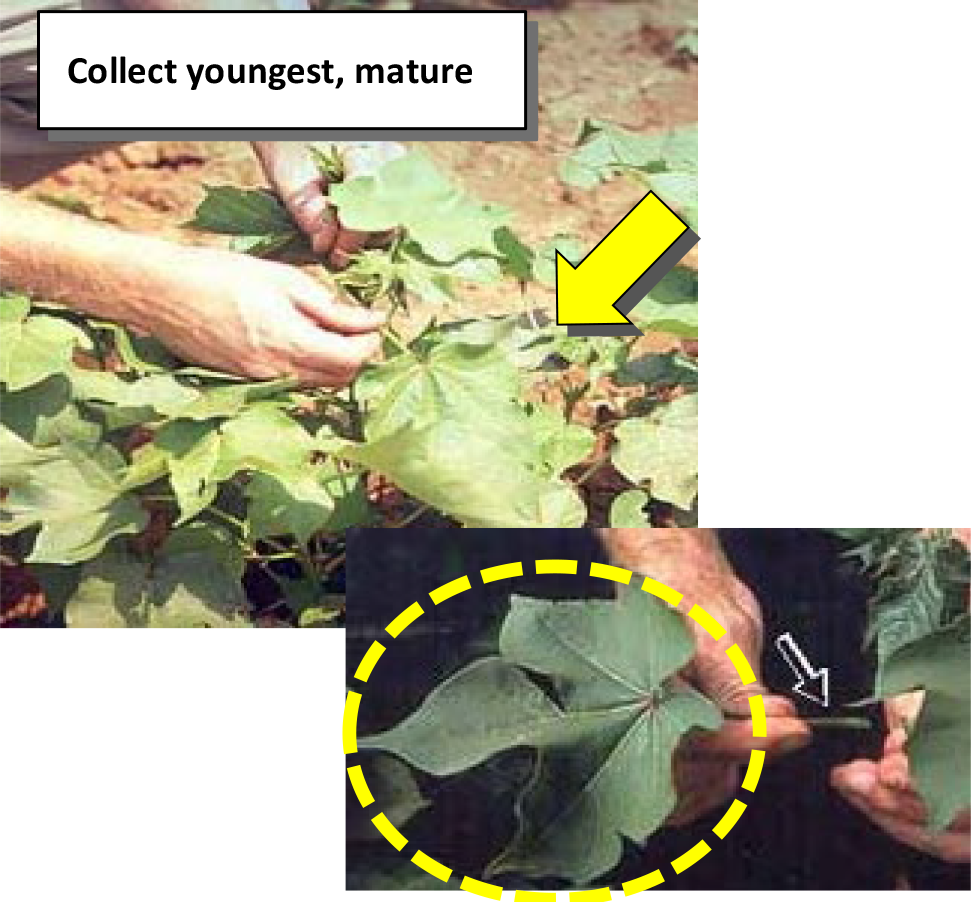
¶ B. Match-head square to first bloom
Plant Part: Leaf blade
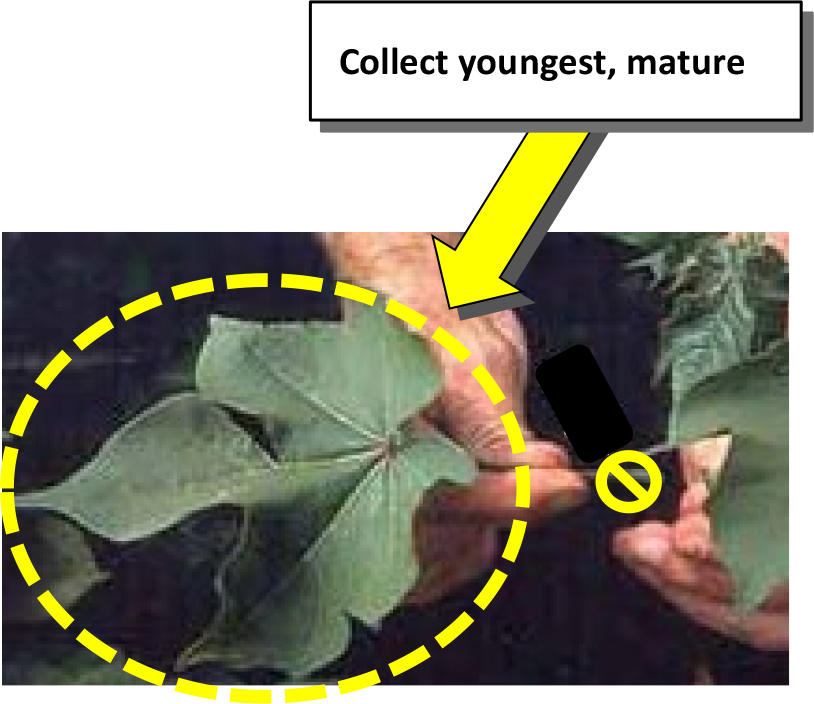
Sampling Procedure: Collect uppermost, mature leaf blade from the vegetative stem, usually the 3rd to 5th leaf from the terminal.It is better to collect a slightly older leaf than one that is too young.Discard the petiole. Collect leaves from 25 to 35 plants.
| Analysis | Tissue Concentration Guidelines | ||||||||
| Low/Marginal Range | Sufficiency Range | High/Excessive | |||||||
| Nitrogen, % N | 3.00 | - | 3.30 | 3.30 | - | 4.50 | |||
| Phosphorus, %P | 0.27 | - | 0.30 | 0.30 | - | 0.50 | |||
| Potassium, % K | 1.00 | - | 1.20 | 1.20 | - | 2.50 | |||
| Calcium, % Ca | 2.00 | - | 2.20 | 2.20 | - | 3.50 | |||
| Magnesium, % Mg | 0.25 | - | 0.30 | 0.30 | - | 0.90 | |||
| Sulfur, % S | 0.20 | - | 0.25 | 0.25 | - | 0.80 | |||
| Zinc, ppm Zn | 15 | - | 20 | 20 | - | 200 | |||
| Iron, ppm Fe | 40 | - | 50 | 50 | - | 250 | 500 | - | 1000* |
| Manganese, ppm Mn | 10 | - | 25 | 25 | - | 300 | |||
| Copper ppm Cu | 3 | - | 5 | 5 | - | 25 | |||
| Boron, ppm B | 15 | - | 20 | 20 | - | 60 | |||
| Nitrogen-to-sulfur ratio (N:S) | 8 | - | 12 | 12 | - | 18 | |||
| Sodium, % Na | - | - | 0.25 | - | 0.50 | ||||
| Chloride, % Cl | - | - | 0.30 | - | 1.00 | ||||
* Excess iron indicates "iron chlorosis".
¶ Figure B.
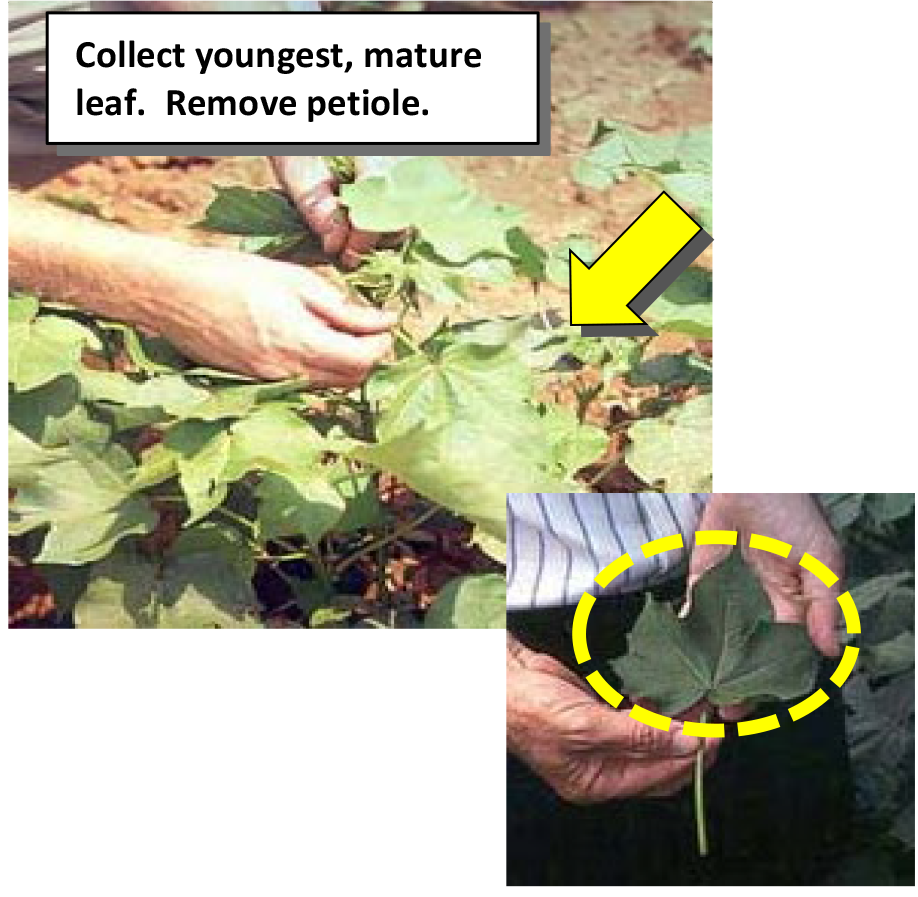
¶ C. First Bloom
Plant Part: Leaf blade
Sampling Procedure: Collect uppermost, mature leaf blade from the vegetative stem, usually the 3rd to 5th leaf from the terminal. It is better to collect a slightly older leaf than one that is too young.Discard the petiole. Collect leaves from 25 to 35 plants.
| Analysis | Tissue Concentration Guidelines | ||||||||
| Low/Marginal Range | Sufficiency Range | High/Excessive | |||||||
| Nitrogen, % N | 3.40 | - | 3.70 | 3.70 | - | 4.50 | |||
| Phosphorus, %P | 0.25 | - | 0.30 | 0.30 | - | 0.50 | |||
| Potassium, % K | 1.60 | - | 2.00 | 2.00 | - | 3.00 | |||
| Calcium, % Ca | 1.50 | - | 2.00 | 2.00 | - | 3.00 | |||
| Magnesium, % Mg | 0.30 | - | 0.50 | 0.50 | - | 0.90 | |||
| Sulfur, % S | 0.15 | - | 0.20 | 0.20 | - | 0.50 | |||
| Zinc, ppm Zn | 15 | - | 20 | 20 | - | 60 | 150 | ||
| Iron, ppm Fe | 40 | - | 50 | 50 | - | 300 | 1000* | ||
| Manganese, ppm Mn | 15 | - | 30 | 30 | - | 200 | 500 | ||
| Copper ppm Cu | 3 | - | 5 | 5 | - | 20 | 50 | ||
| Boron, ppm B | 15 | - | 20 | 20 | - | 60 | 100 | ||
| Nitrogen-to-sulfur ratio (N:S) | 15 | - | 20 | 10 | - | 15 | |||
| Sodium, % Na | - | - | 0.10 | - | 0.20 | ||||
| Chloride, % Cl | - | - | 0.30 | - | 1.00 | ||||
¶ Figure C.
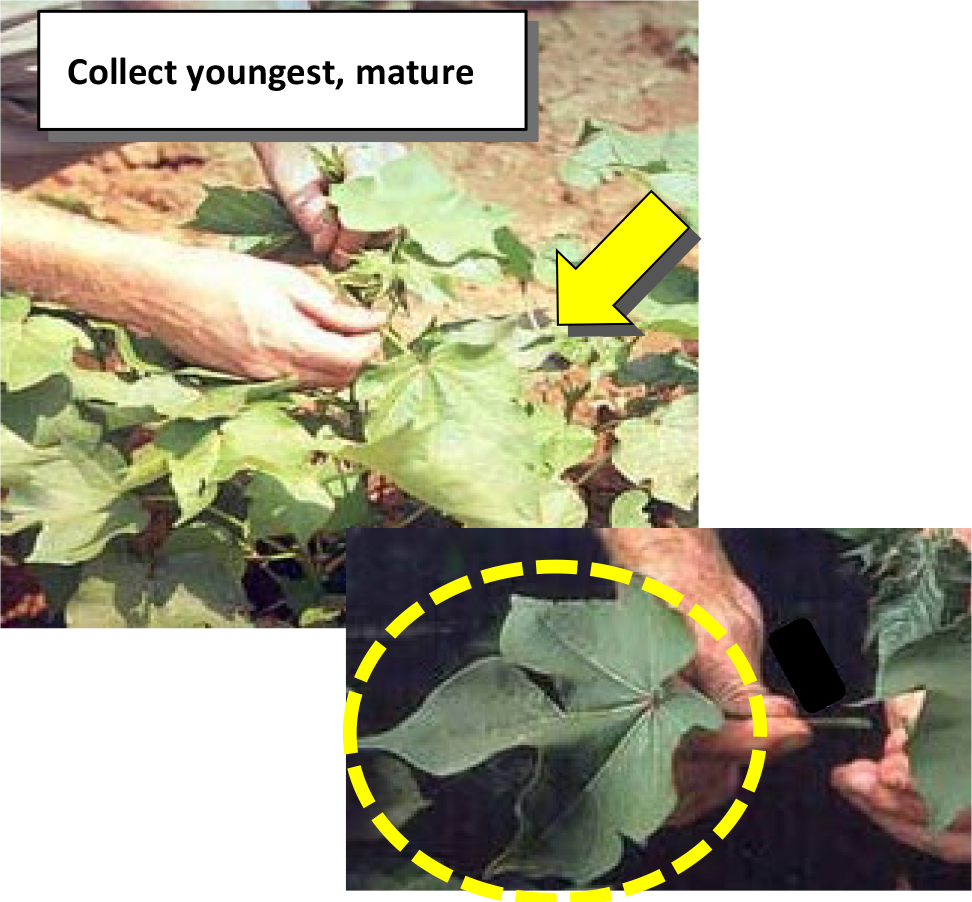
¶ D. Early Flowering to Peak Bloom
Plant Part: Leaf blade
Sampling Procedure: Collect uppermost, mature leaf blade from the vegetative stem, usually the 3rd to 5th leaf from the terminal. It is better to collect a slightly older leaf than one that is too young.Discard the petiole. Collect leaves from 25 to 35 plants.
| Analysis | Tissue Concentration Guidelines | ||||||||
| Low/Marginal Range | Sufficiency Range | High/Excessive | |||||||
| Nitrogen, % N | 2.70 | - | 3.00 | 3.00 | - | 4.30 | |||
| Phosphorus, %P | 0.25 | - | 0.30 | 0.30 | - | 0.65 | |||
| Potassium, % K | 0.80 | - | 1.00 | 1.00 | - | 2.00 | |||
| Calcium, % Ca | 1.70 | - | 2.20 | 2.20 | - | 3.50 | |||
| Magnesium, % Mg | 0.20 | - | 0.30 | 0.30 | - | 0.80 | |||
| Sulfur, % S | 0.15 | - | 0.20 | 0.20 | - | 0.50 | |||
| Zinc, ppm Zn | 15 | - | 20 | 20 | - | 60 | 150 | ||
| Iron, ppm Fe | 30 | - | 40 | 40 | - | 300 | 1000* | ||
| Manganese, ppm Mn | 15 | - | 30 | 30 | - | 200 | 500 | ||
| Copper ppm Cu | 3 | - | 5 | 5 | - | 20 | 50 | ||
| Boron, ppm B | 15 | - | 20 | 20 | - | 60 | 100 | ||
| Nitrogen-to-sulfur ratio (N:S) | 15 | - | 20 | 10 | - | 15 | |||
| Sodium, % Na | - | - | 0.25 | - | 0.50 | ||||
| Chloride, % Cl | - | - | 0.30 | - | 1.00 | ||||
¶ Figure D.
¶ E. Peak Bloom to Boll-Fill
Plant Part: Leaf blade
Sampling Procedure: Collect uppermost, mature leaf blade from the vegetative stem, usually the 3rd to 5th leaf from the terminal. It is better to collect a slightly older leaf than one that is too young.Discard the petiole. Collect leaves from 25 to 35 plants.
| Analysis | Tissue Concentration Guidelines | ||||||||
| Low/Marginal Range | Sufficiency Range | High/Excessive | |||||||
| Nitrogen, % N | 2.70 | - | 3.00 | 3.00 | - | 4.00 | |||
| Phosphorus, %P | 0.23 | - | 0.25 | 0.25 | - | 0.50 | |||
| Potassium, % K | 0.75 | - | 0.90 | 0.90 | - | 2.00 | |||
| Calcium, % Ca | 1.00 | - | 1.25 | 1.25 | - | 3.00 | |||
| Magnesium, % Mg | 0.20 | - | 0.25 | 0.25 | - | 0.70 | |||
| Sulfur, % S | 0.20 | - | 0.25 | 0.25 | - | 0.80 | |||
| Zinc, ppm Zn | 15 | - | 20 | 20 | - | 100 | |||
| Iron, ppm Fe | 40 | - | 50 | 50 | - | 200 | |||
| Manganese, ppm Mn | 10 | - | 25 | 25 | - | 300 | |||
| Copper ppm Cu | 3 | - | 5 | 5 | - | 25 | |||
| Boron, ppm B | 15 | - | 20 | 20 | - | 60 | |||
| Nitrogen-to-sulfur ratio (N:S) | 8 | - | 12 | 12 | - | 15 | |||
| Sodium, % Na | - | - | 0.25 | - | 0.50 | ||||
| Chloride, % Cl | - | - | 0.30 | - | 1.00 | ||||
¶ Figure E.
¶ F. Boll-Fill
Plant Part: Leaf blade
Sampling Procedure: Collect uppermost, mature leaf blade from the vegetative stem, usually the 3rd to 5th leaf from the terminal. It is better to collect a slightly older leaf than one that is too young.Discard the petiole. Collect leaves from 25 to 35 plants.
| Analysis | Tissue Concentration Guidelines | ||||||||
| Low/Marginal Range | Sufficiency Range | High/Excessive | |||||||
| Nitrogen, % N | 2.50 | - | 2.80 | 2.80 | - | 3.50 | |||
| Phosphorus, %P | 0.12 | - | 0.15 | 0.15 | - | 0.50 | |||
| Potassium, % K | 0.65 | - | 0.75 | 0.75 | - | 2.50 | |||
| Calcium, % Ca | 0.90 | - | 1.25 | 1.25 | - | 3.00 | |||
| Magnesium, % Mg | 0.20 | - | 0.25 | 0.25 | - | 0.50 | |||
| Sulfur, % S | 0.20 | - | 0.25 | 0.25 | - | 0.80 | |||
| Zinc, ppm Zn | 15 | - | 20 | 20 | - | 40 | |||
| Iron, ppm Fe | 40 | - | 50 | 50 | - | 150 | 400 | - | 1000* |
| Manganese, ppm Mn | 10 | - | 25 | 25 | - | 300 | |||
| Copper ppm Cu | 3 | - | 5 | 5 | - | 25 | |||
| Boron, ppm B | 15 | - | 20 | 20 | - | 60 | |||
| Nitrogen-to-sulfur ratio (N:S) | 8 | - | 12 | 12 | - | 15 | |||
| Sodium, % Na | - | - | 0.25 | - | 0.50 | ||||
| Chloride, % Cl | - | - | 0.30 | - | 1.00 | ||||
¶ Figure F.
¶ G. Seasonal Monitoring, "Arkansas Interpretation"
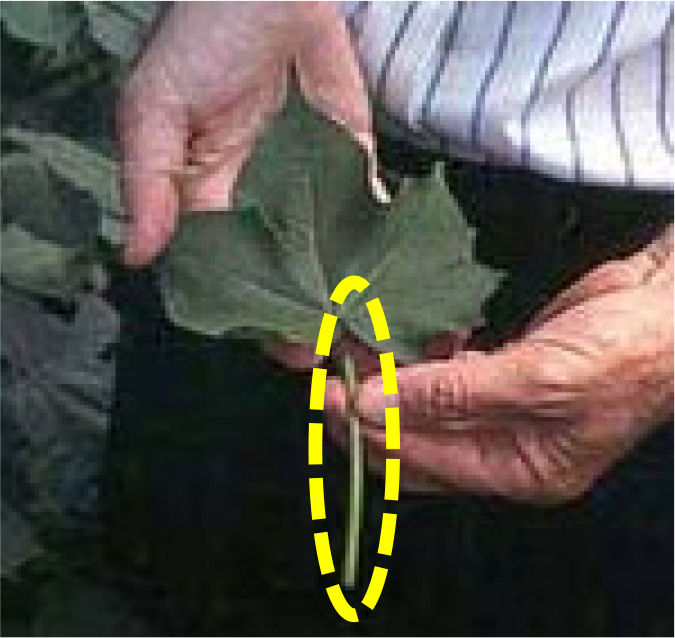
Plant Part: Petiole
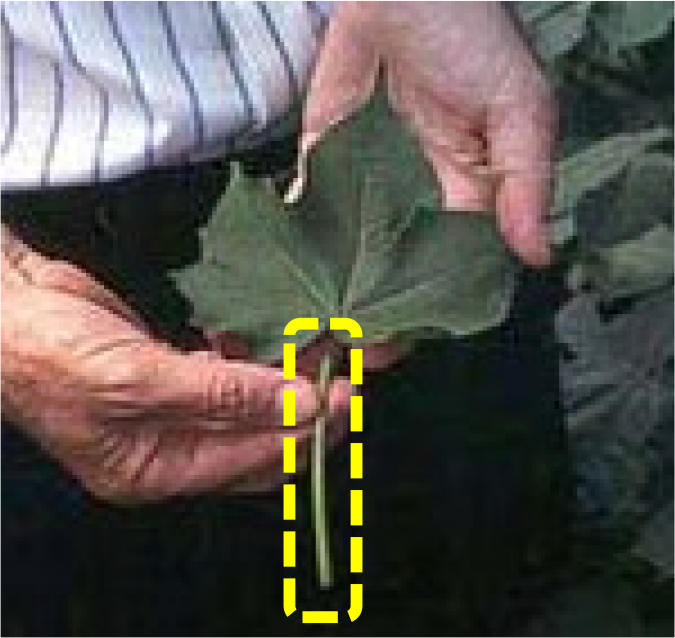
Sampling Procedure: Collect petiole from the uppermost, mature leaf, usually the 3rd to 5th leaf from the terminal. It is better to collect a slightly older leaf than one that is too young. Discard the leaf blade. Collect petioles from 25 to 35 plants.
Note: The "Arkansas Interpretation" may be more appropriate for loess and other fine-textured soils of the mid-South. The "Georgia Interpretation" was developed for the coarser textured soils of the Atlantic and Gulf Coastal Plain.
| Analysis | Tissue Concentration Guidelines | ||||||||
| Nitrate, ppm NO3-N | Phosphorus, ppm PO4-P | Potassium, %K** | |||||||
| Week of first bloom | 10,000 | - | 35,000 | >800 | 4.00 | - | 5.50 | ||
| Bloom + 1 week | 9,000 | - | 30,000 | * | - | - | - | ||
| Bloom + 2 weeks | 7,000 | - | 25,000 | * | - | - | - | ||
| Bloom + 3 weeks | 5,000 | - | 20,000 | * | - | - | - | ||
| Bloom + 4 weeks | 3,000 | - | 13,000 | * | 3.00 | - | 4.00 | ||
| Bloom + 5 weeks | 2,000 | - | 8,000 | * | - | - | - | ||
| Bloom + 6 weeks | 1,000 | - | 5,000 | - | 1.50 | - | 2.50 | ||
| Bloom + 7 weeks | 100 | - | 5,000 | - | - | - | - | ||
| Bloom + 8 weeks | 100 | - | 5,000 | - | 1.00 | - | 2.00 | ||
Reference: Mitchell & Baker. 2000. Sufficiency ranges for plant analysis: Cotton. Southern Coop Series Bull #394.
* A decrease of more than 300 ppm PO4-P from the previous week usually indicates moisture stress.
** "California" petiole K interpretation.
¶ Figure G.
¶ H. Seasonal Monitoring, "Georgia Interpretation"
Plant Part: Petiole
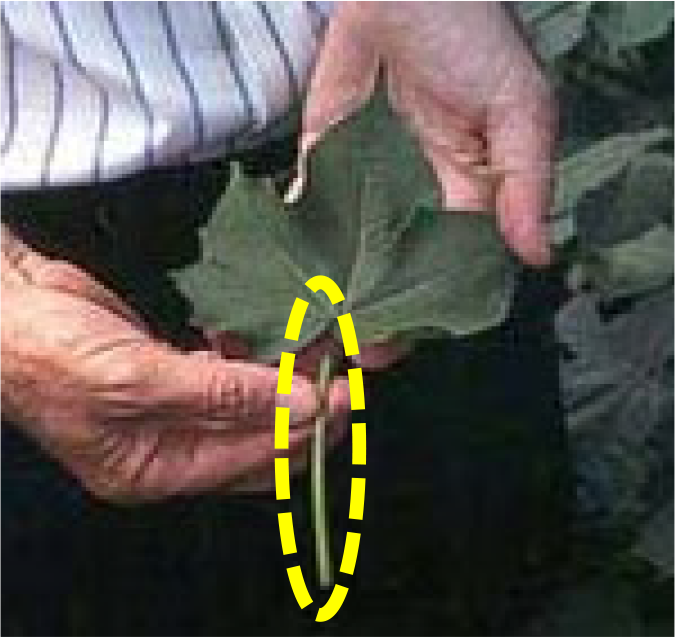
Sampling Procedure: Collect petiole from the uppermost, mature leaf, usually the 3rd to 5th leaf from the terminal. It is better to collect a slightly older leaf than one that is too young. Discard the leaf blade. Collect petioles from 25 to 35 plants.
Note: The "Georgia Interpretation" was developed for the coarser textured soils of the Atlantic and Gulf Coastal Plain. The "Arkansas Interpretation" may be more appropriate for loess-derived soils and other fine-textured soils of the mid-South.
| Analysis | Tissue Concentration Guidelines | ||||||||
| Nitrate, ppm NO3-N | Phosphorus, ppm PO4-P | Potassium, %K** | |||||||
| Week before first bloom | 7,000 | - | 13,000 | >800 | - | - | - | ||
| Week of first bloom | 4,500 | - | 12,500 | >800 | 4.00 | - | 5.50 | ||
| Bloom + 1 week | 3,500 | - | 11,000 | * | - | - | - | ||
| Bloom + 2 weeks | 2,500 | - | 9,500 | * | - | - | - | ||
| Bloom + 3 weeks | 1,500 | - | 7,500 | * | - | - | - | ||
| Bloom + 4 weeks | 1,000 | - | 7,000 | * | 3.00 | - | 4.00 | ||
| Bloom + 5 weeks | 1,000 | - | 6,000 | * | - | - | - | ||
| Bloom + 6 weeks | 500 | - | 4,000 | - | 1.50 | - | 2.50 | ||
| Bloom + 7 weeks | 500 | - | 4,000 | - | - | - | - | ||
| Bloom + 8 weeks | 500 | 4,000 | - | 1.00 | 2.00 | ||||
Reference: Mitchell & Baker. 2000. Sufficiency ranges for plant analysis: Cotton. Southern Coop Series Bull #394.
* A decrease of more than 300 ppm PO4-P from the previous week usually indicates moisture stress.
** "California" petiole K interpretation.
¶ Figure H.
¶ I. Seasonal Monitoring, "Texas Interpretation"
Plant Part: Petiole
Sampling Procedure: Collect petiole from the uppermost, mature leaf, usually the 3rd to 5th leaf from the terminal. It is better to collect a slightly older leaf than one that is too young. Discard the leaf blade. Collect petioles from 25 to 35 plants. First samples should be collected one week prior to bloom, which is normally 50 to 55 days after emergence.
Note: Interpretations suited for producers with center pivot irrigation systems that are plumbed for N injection and for flood irrigation systems in the Lower Rio Grande Valley. Use caution when interpreting results from fields with a potential for late-season nitrogen availability from organic sources (e.g., manured fields).
| Analysis | Tissue Concentration Guidelines | ||||||||
| Nitrate, ppm NO3-N | Phosphorus, ppm PO4-P | Potassium, %K** | |||||||
| Week of first bloom | 9,000 | - | 23,000 | >800 | - | - | - | ||
| Bloom + 1 week | 8,000 | - | 20,000 | >800 | 4 | - | 5.5 | ||
| Bloom + 2 weeks | 6,000 | - | 15,000 | * | - | - | - | ||
| Bloom + 3 weeks | 5,000 | - | 13,000 | * | 3 | - | 4 | ||
| Bloom + 4 weeks | 4,000 | - | 10,000 | * | - | - | - | ||
| Bloom + 5 weeks | 4,000 | - | 8,000 | * | 1.5 | - | 2.5 | ||
| Bloom + 6 weeks | 2,000 | - | 6,500 | - | - | - | - | ||
Reference: TAEX. 1996. Using Petiole Analysis for Nitrogen Management in Cotton. Hickey, Stichler, & Livingston.
* A decrease of more than 300 ppm PO4-P from the previous week usually indicates moisture stress.
** "California" petiole K interpretation.
¶ Figure I.
¶ J. Typical Nutrient Contents (in pounds) Required to Produce One Bale of Lint (NCC, 1996)
| Element / Nutrient | Above Ground Plant (leaves, stems, & fruit) |
Seed Cotton | Lint |
| Oxygen | 2100 | 700 | 250 |
| Carbon | 1650 | 550 | 190 |
| Hydrogen | 360 | 120 | 35 |
| Nitrogen | 62 | 35 to 40 | 1 |
| Phosphate, as P205 | 22 | 13 to 20 | 0.3 |
| Phosphorus, as P | 10 | 6 to 9 | 0.13 |
| Potash, as K20 | 61 | 15 | 3 |
| Potassium, as K | 52.5862069 | 12.93103448 | 2.586206897 |
| Calcium | 27 to 62 | 1 | 0.2 |
| Magnesium | 11 to 27 | 5 | 0.3 |
| Sulphur | 8 to 16 | 1 to 2 | trace |
| Other Nutrients | less than 3 | trace | trace |
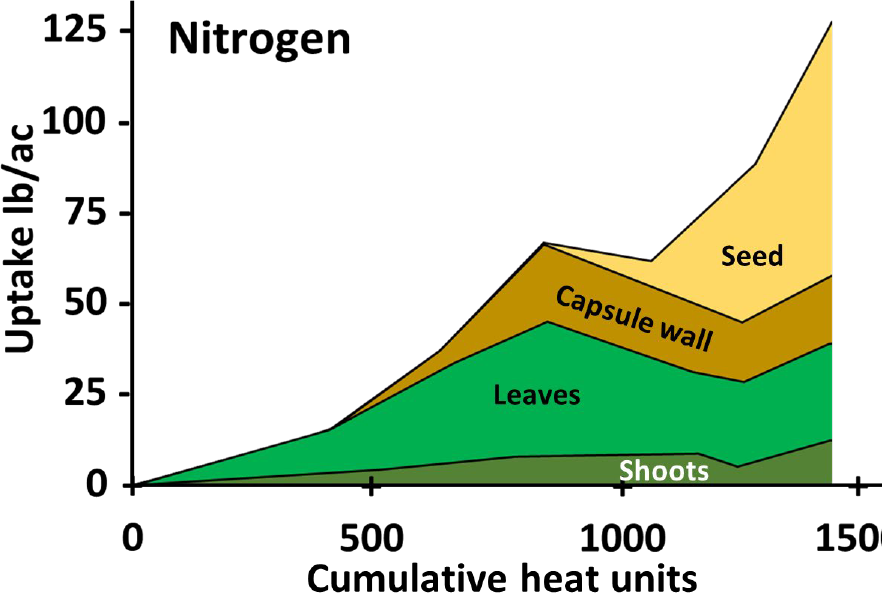
¶ Figure 10a. Nitrogen Uptake
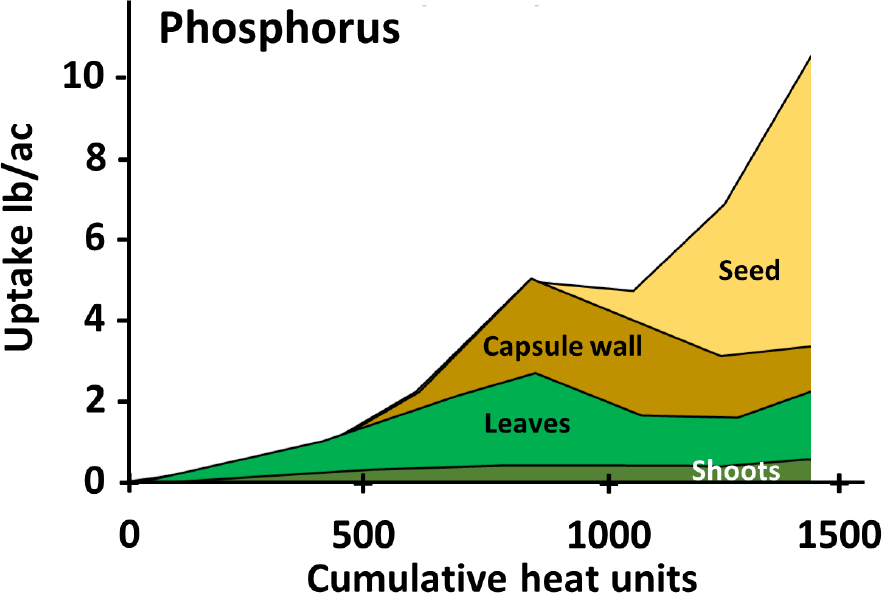
¶ Figure 10b.Phosphorus Uptake
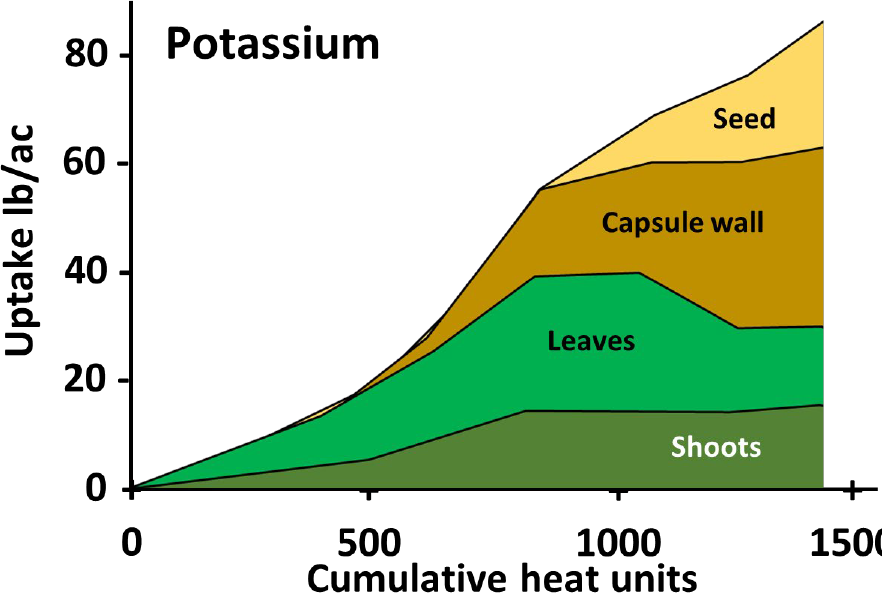
¶ Figure 10c. Potassium Uptake
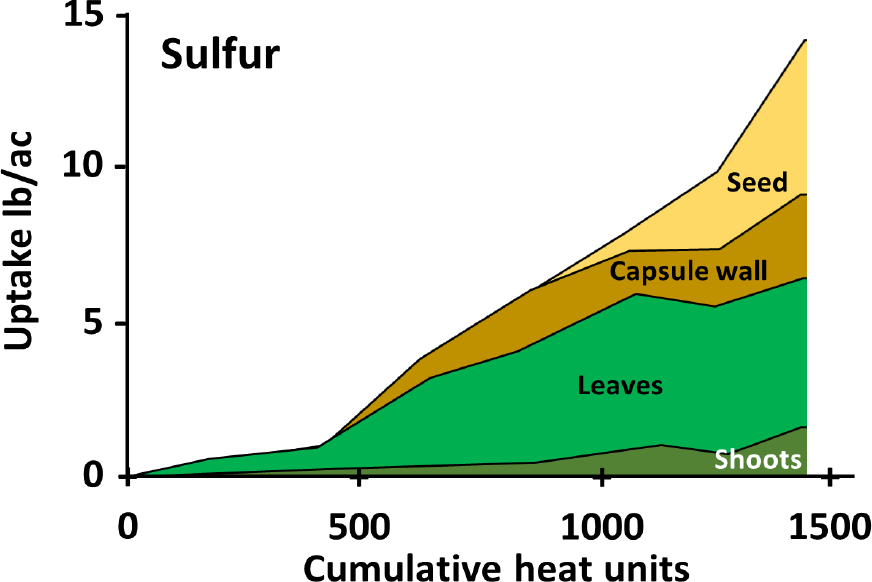
¶ Figure 10d. Sulfur Uptake
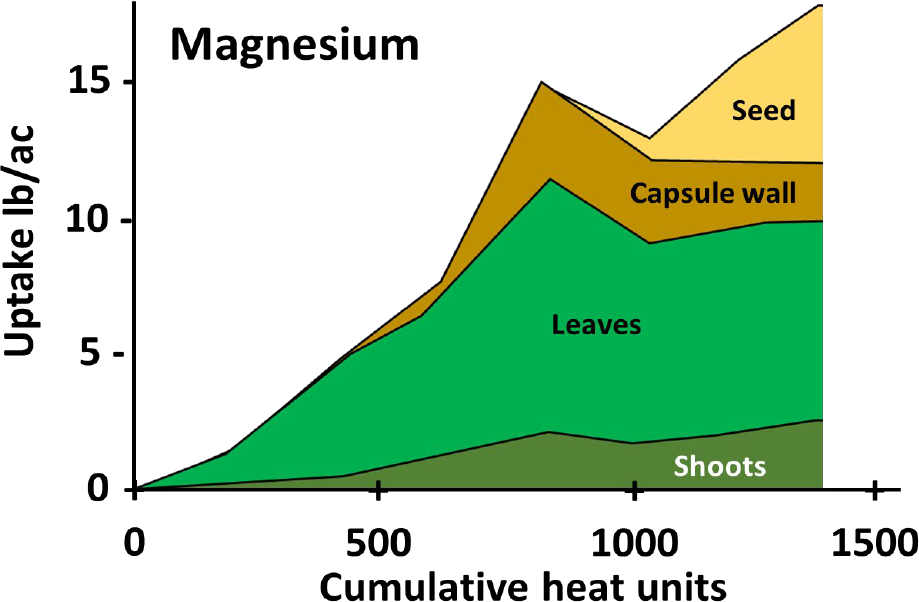
¶ Figure 10e. Magnesium Uptake
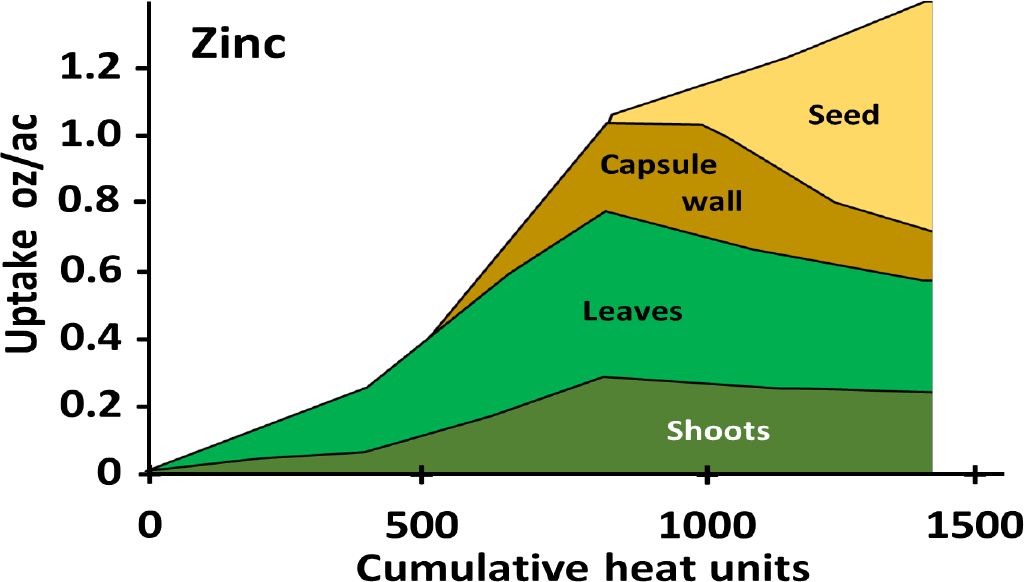
¶ Figure 10f. Zinc Uptake
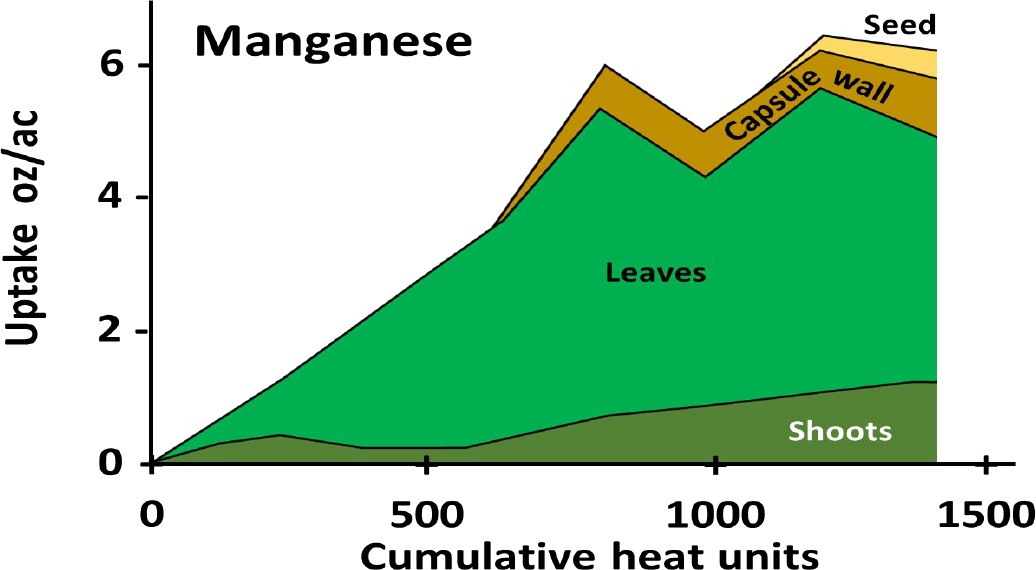
¶ Figure 10g. Manganese Uptake
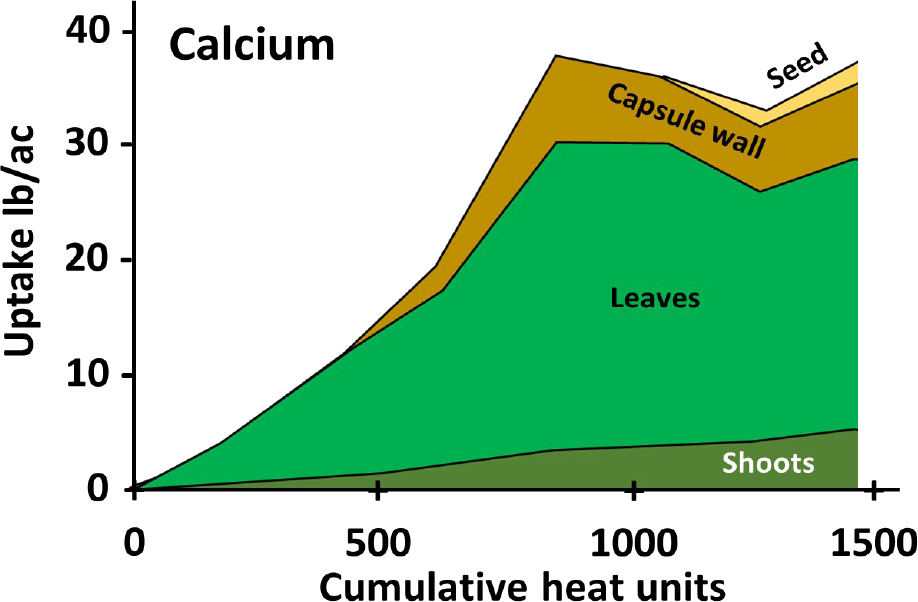
¶ Figure 10h. Calcium Uptake
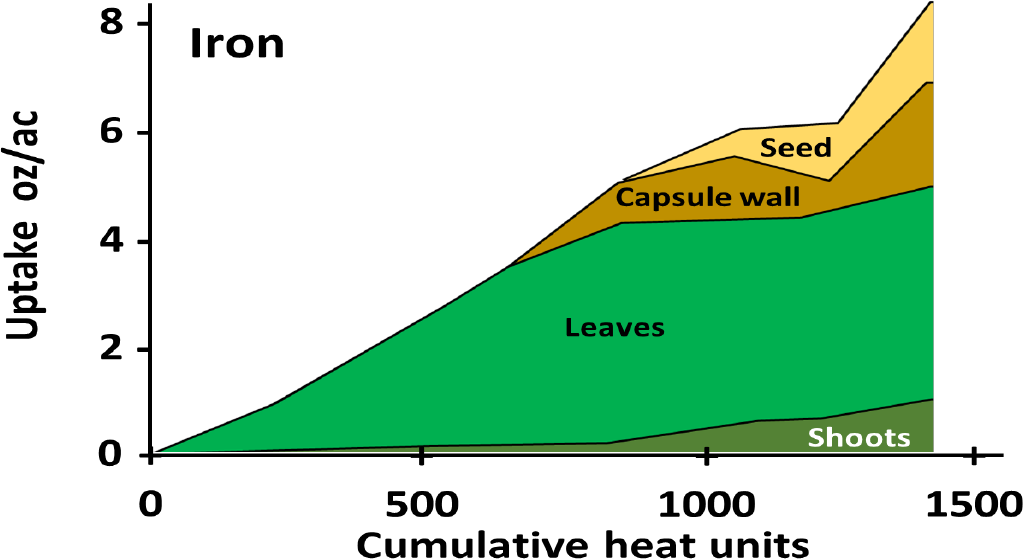
¶ Figure 10i. Iron Uptake
¶ Figure 10j. Copper Uptake
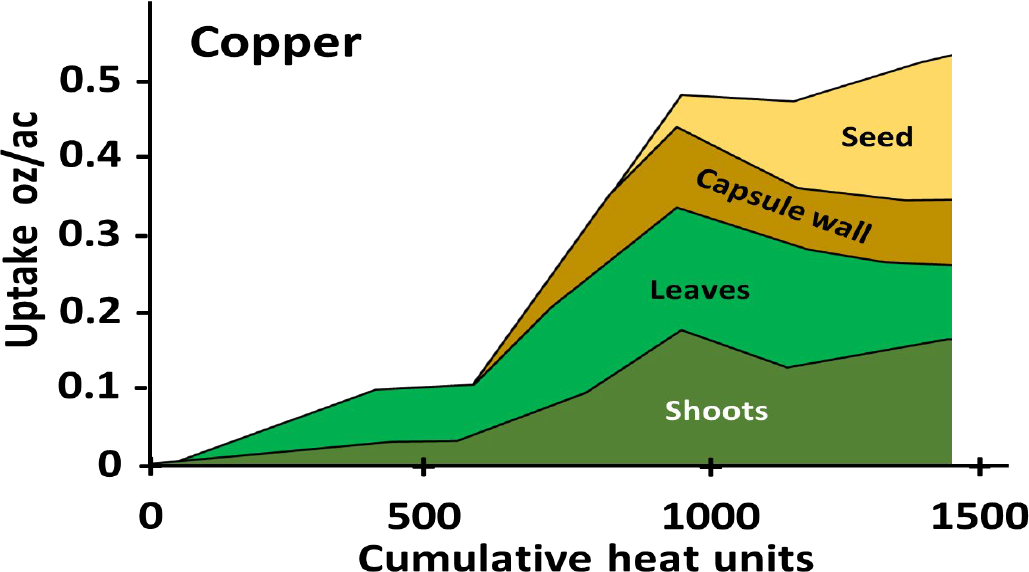
The nutrient uptake values presented in this Crop File are based on whole plant samples collected from two Alabama locations during the 1986 and 1987 growing seasons. Samples were collected every two weeks, then separated into the four components. Populations were 64,000 plants per acre. Final yields averaged 1930 ± 300 pounds per acre.
¶ References
* after "Figure 2. Seasonal demands for various macronutrient and micronutrients (Mullins and Burmester, 1991, 1992, 1993a, 1993b)"; in Advancing Cotton Education, National Cotton Council, http://www.cotton.org/tech/ace/soil-fertility.cfm accessed 13Apr2018