⇦ Back to Soil Fertility and Plant Nutrition Home
¶ Cauliflower (Brassica oleracea var. botrytis)
| Table No | Growth Stage | Plant Part |
| Table A | Buttoning | Mature leaf blades |
| Table B | Heading | Mature leaf blades |
| Table C | Growing season | Mid-rib |
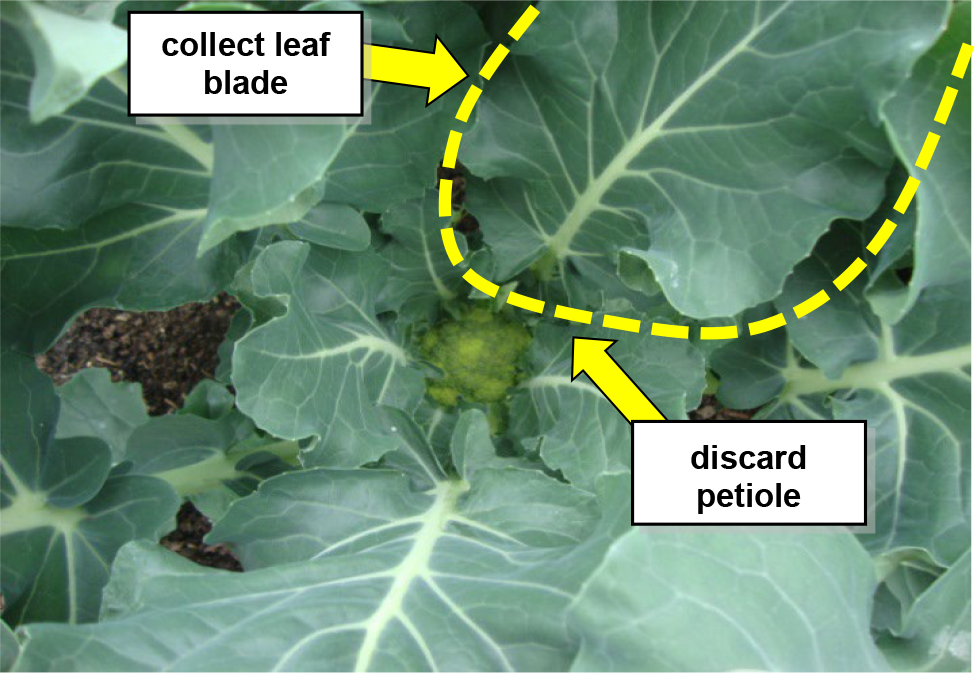
¶ A: Buttoning
Plant Part: Youngest mature leaf blade
Sampling Procedure: Collect leaves from 25 to 30 plants. Begin at the button and move outward to the youngest, but fully-expanded leaf. Discard the petiole, but retain the leaf blade. Collect leaves that are free of disease or insect damage. Collect a separate set of leaves for nitrate analysis of midribs. Place samples in a paper bag, not a plastic bag, for shipment to the laboratory
| Analysis | Tissue Concentration Guidelines | ||||||||
| Low/Marginal Range | Sufficiency Range | Excessive, toxic? | |||||||
| Nitrogen, % N | 2.60 | - | 3.00 | 3.00 | - | 5.00 | |||
| Phosphorus, %P | 0.30 | - | 0.40 | 0.40 | - | 0.70 | |||
| Potassium, % K | 1.50 | - | 2.00 | 2.00 | - | 4.00 | |||
| Calcium, % Ca | 0.80 | - | 1.00 | 1.00 | - | 2.00 | |||
| Magnesium, % Mg | 0.20 | - | 0.25 | 0.25 | - | 0.60 | |||
| Sulfur, % S | 0.50 | - | 0.60 | 0.60 | - | 1.00 | |||
| Zinc, ppm Zn | 25 | - | 30 | 30 | - | 50 | 100 | ||
| Iron, ppm Fe | 25 | - | 30 | 30 | - | 250 | 600 | ||
| Manganese, ppm Mn | 25 | - | 30 | 30 | - | 80 | |||
| Copper ppm Cu | 3 | - | 5 | 5 | - | 10 | |||
| Boron, ppm B | 25 | - | 30 | 30 | - | 50 | |||
| Nitrogen-to-sulfur ratio (N:S) | |||||||||
| Sodium, % Na | |||||||||
| Chloride, % Cl | |||||||||
¶ Figure A.
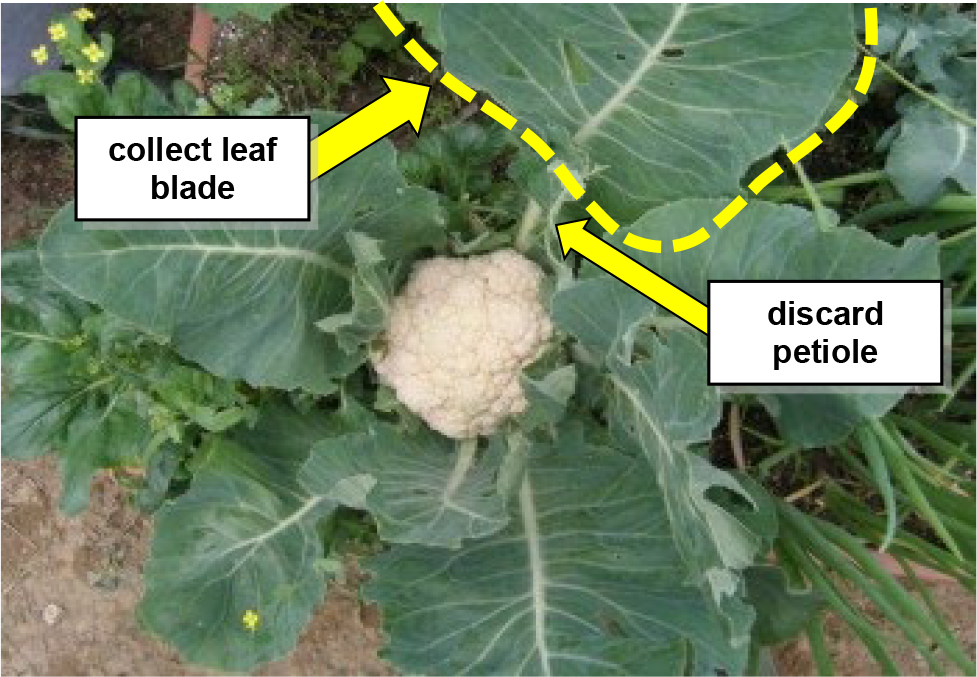
¶ B: Heading
Plant Part: Youngest mature leaf blade
Sampling Procedure: Collect leaves from 25 to 30 plants. Begin at the button and move outward to the youngest, but fully-expanded leaf. Discard the petiole, but retain the leaf blade. Collect leaves that are free of disease or insect damage. Collect a separate set of leaves for nitrate analysis of midribs. Place samples in a paper bag, not a plastic bag, for shipment to the laboratory.
| Analysis | Tissue Concentration Guidelines | ||||||||
| Low/Marginal Range | Sufficiency Range | Excessive, toxic? | |||||||
| Nitrogen, % N | 2.0 | - | 3.3 | 3.3 | - | 4.5 | |||
| Phosphorus, %P | 0.3 | - | 0.3 | 0.3 | - | 0.8 | |||
| Potassium, % K | 1.5 | - | 2.6 | 2.6 | - | 3.5 | |||
| Calcium, % Ca | 1.0 | - | 2.0 | 2.0 | - | 3.5 | |||
| Magnesium, % Mg | 0.3 | - | 0.3 | 0.3 | - | 0.6 | |||
| Sulfur, % S | 0.5 | - | 0.6 | 0.6 | - | 1.0 | |||
| Zinc, ppm Zn | 20 | - | 30 | 30 | - | 50 | 250 | ||
| Iron, ppm Fe | 30 | - | 60 | 60 | - | 200 | 600 | ||
| Manganese, ppm Mn | 25 | - | 50 | 50 | - | 80 | 250 | ||
| Copper ppm Cu | 4 | - | 5 | 5 | - | 15 | |||
| Boron, ppm B | 25 | - | 30 | 30 | - | 50 | |||
| Nitrogen-to-sulfur ratio (N:S) | |||||||||
| Sodium, % Na | |||||||||
| Chloride, % Cl | |||||||||
¶ Figure B.
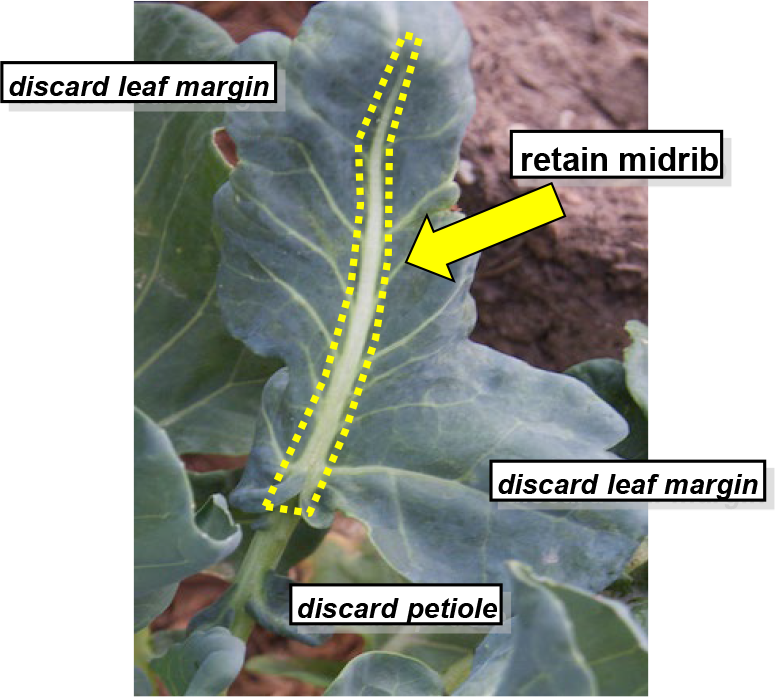
¶ C: Growing season
Plant Part: Mid-rib
Sampling Procedure: Collect the youngest, but full-sized leaves from 30 to 50 plants. Separate the thickened mid-ribs (mid-vein) from the center of the leaf and discard the remainding leaf blade. Collect leaves that are free of disease or insect damage. Collect a separate set of leavesfor nutrient analysis, discarding petioles and retaining leaf blades. Place sample in a paper bag, not a plastic bag, for shipment to the laboratory.
| Growth Stage | Tissue Concentration Guidelines | ||||||||
| Deficient | Warning Range | Adequate | |||||||
| ------------------------ Nitrate-nitrogen, ppm NO3-N -------------------------- | |||||||||
| 4 - 6 leaves | 5000 | 5000 | - | 25000 | 11000 | - | 25000 | ||
| 10 - 12 leaves | 5000 | 5000 | - | 9000 | 9000 | - | 20000 | ||
| Folding | 5000 | 5000 | - | 7000 | 7000 | - | 17500 | ||
| Buttoning | 5000 | 5000 | - | 6000 | 6000 | - | 15000 | ||
| Curd Development | 2500 | - | 2500 | - | 10000 | ||||
| Pre-harvest | 1500 | - | 1500 | - | 7000 | ||||
¶ Figure C.
Note: Interpretations are based the relationship between nutrient levels in a particular part of a "standard" tissue in a specific time in the growing season. These plant tissue ranges and interpretations are not considered valid with plant parts or growth stages other than those specified. These interpretations are developed from data collected across a wide range of crop, soil, and climate conditions.
Results from a single sample may be affected by time of day, climatic conditions, plant stress, age, or disease, that are not directly related to fertility status. Nutrient concentrations are not uniform throughout the plant and may change as the tissue matures.Tissue analysis trends should be evaluated by variety, growing season, and yield/quality goals. Collecting plant samples from the same location as soil samples allows comparison of soil nutrient availability with plant nutrient status.Low nutrient levels may be due to deficiency or to dilution by intensive growth. High or excessive nutrient levels may be a sign of restricted growth allowing nutrients to accumulate in the plant tissue. Nutrient imbalance may be secondary to the primary problem.