⇦ Back to Soil Fertility and Plant Nutrition Home
¶ Canola (Brassica rapus)
| Table No: | Growth stage: | Plant part: |
| Table A | Rosette (2-leaf to pre-bud) | Whole plant |
| Table B | Budding to early flower | Leaf blades |
| Table C | Flowering | Leaf blades |
| Table D | Pod formation to maturity | Leaf blades |
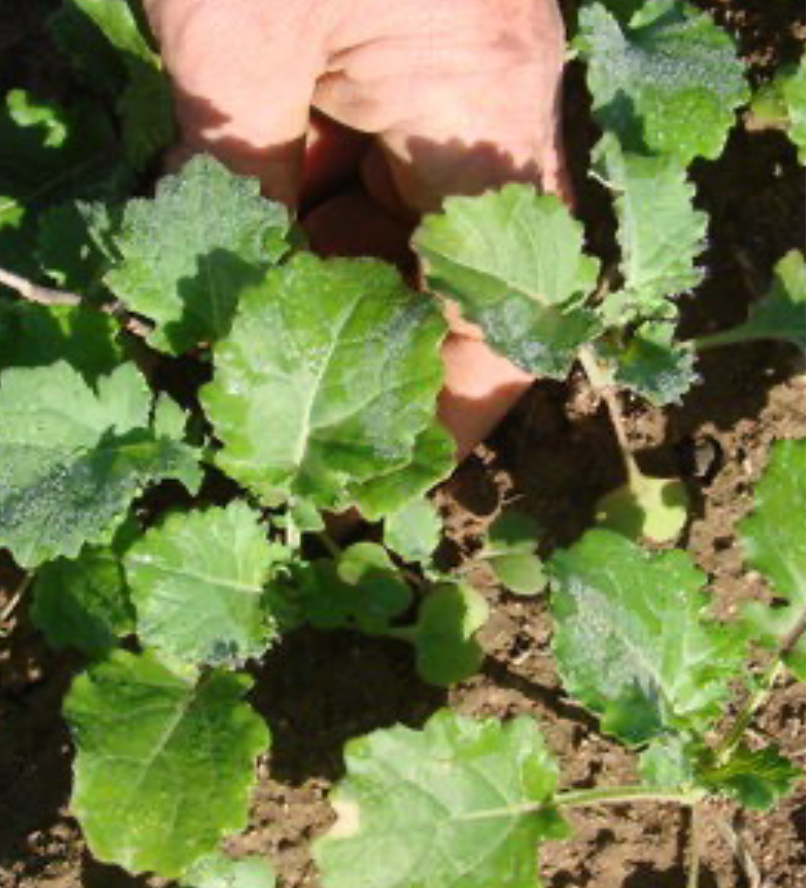
¶ A. Rosette (2-leaf to pre-bud)
Plant Part: Whole plant
Sampling Procedure: Collect 15 to 25 whole plants, depending on size. Cut off at ground level.
| Analysis | Tissue Concentration Guidelines | |||||||
| Low/Marginal Range | Sufficiency Range | Excessive, toxic? | ||||||
| Nitrogen, % N | 3.00 | - | 3.50 | 3.50 | - | 8.00 | ||
| Phosphorus, %P | 0.20 | - | 0.25 | 0.25 | - | 0.60 | ||
| Potassium, % K | 2.20 | - | 2.50 | 2.50 | - | 6.60 | ||
| Calcium, % Ca | 0.90 | - | 1.00 | 1.00 | - | 3.20 | ||
| Magnesium, % Mg | 0.20 | - | 0.28 | 0.28 | - | 0.85 | ||
| Sulfur, % S | 0.50 | - | 0.60 | 0.60 | - | 2.00 | ||
| Zinc, ppm Zn | 25 | - | 30 | 30 | - | 120 | ||
| Iron, ppm Fe | 40 | - | 50 | 50 | - | 500 | ||
| Manganese, ppm Mn | 20 | - | 25 | 25 | - | 200 | ||
| Copper ppm Cu | 4 | - | 5 | 5 | - | 25 | ||
| Boron, ppm B | 15 | - | 20 | 20 | - | 55 | ||
| Nitrogen-to-sulfur ratio (N:S) | n/a | n/a | ||||||
| Sodium, % Na | n/a | n/a | ||||||
| Chloride, % Cl | n/a | n/a | ||||||
¶ Figure A. Young Canola Plant
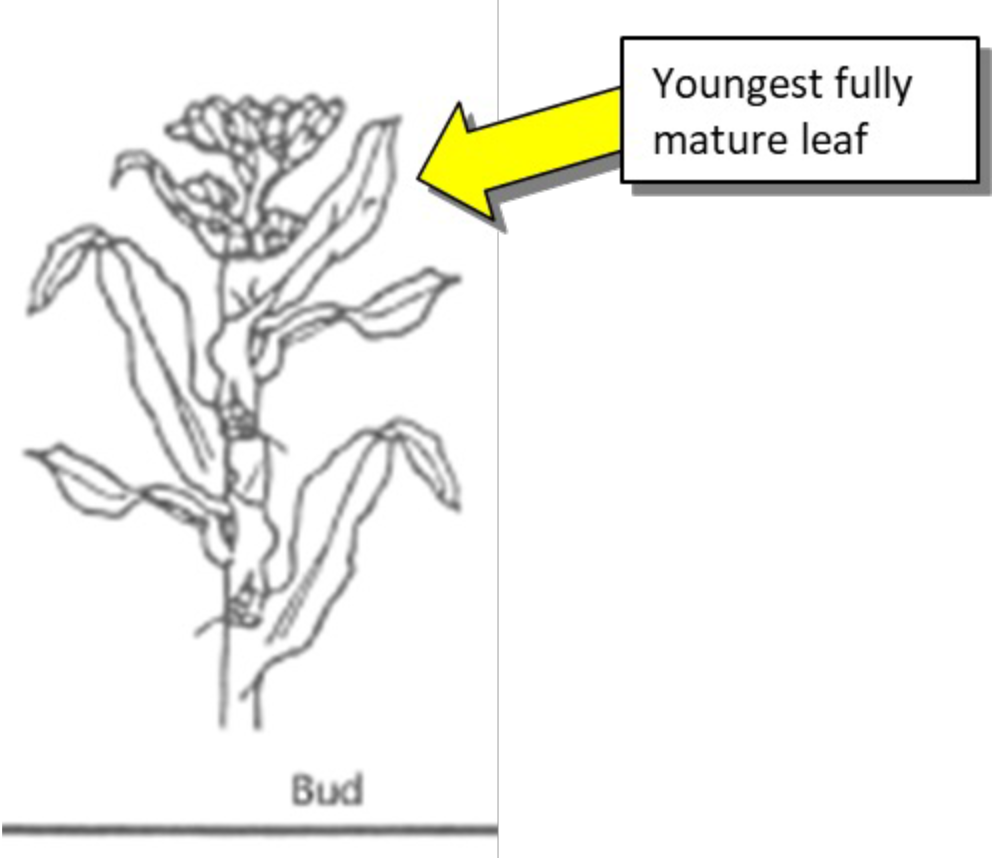
¶ B. Budding to Early Flower
Plant Part: Uppermost recently mature leaf blades
Sampling Procedure: Collect leaves from at least 25 to 30 plants. Collect one leaf per plant. Start from the top of the plant and collect the most recently expanded, fully mature leaf.
| Analysis | Tissue Concentration Guidelines | |||||||
| Low/Marginal Range | Sufficiency Range | Excessive, toxic? | ||||||
| Nitrogen, % N | 1.80 | - | 2.40 | 2.40 | - | 5.00 | ||
| Phosphorus, %P | 0.15 | - | 0.30 | 0.30 | - | 0.70 | ||
| Potassium, % K | 2.00 | - | 2.30 | 2.30 | - | 5.80 | ||
| Calcium, % Ca | 1.40 | - | 1.60 | 1.60 | - | 3.50 | ||
| Magnesium, % Mg | 0.15 | - | 0.20 | 0.20 | - | 0.60 | ||
| Sulfur, % S | 0.45 | - | 0.65 | 0.65 | - | 2.00 | ||
| Zinc, ppm Zn | 25 | - | 30 | 30 | - | 120 | ||
| Iron, ppm Fe | 40 | - | 50 | 50 | - | 400 | ||
| Manganese, ppm Mn | 22 | - | 30 | 30 | - | 200 | ||
| Copper ppm Cu | 4 | - | 5 | 5 | - | 25 | ||
| Boron, ppm B | 20 | - | 25 | 25 | - | 55 | ||
| Nitrogen-to-sulfur ratio (N:S) | n/a | n/a | ||||||
| Sodium, % Na | n/a | n/a | ||||||
| Chloride, % Cl | n/a | n/a | ||||||
¶ Figure B.
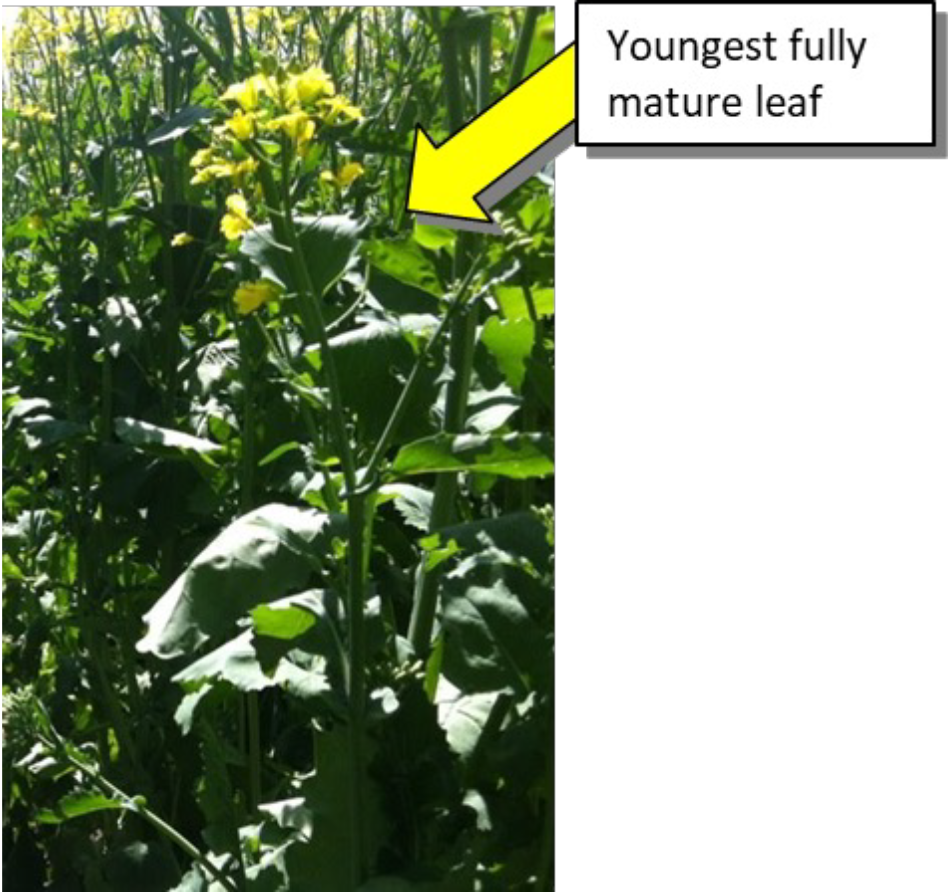
¶ C. Flowering
Plant Part: Uppermost recently mature leaf blades
Sampling Procedure: Collect leaves from at least 25 to 30 plants. Collect one leaf per plant. Start from the top of the plant and collect the most recently expanded, fully mature leaf.
| Analysis | Tissue Concentration Guidelines | |||||||
| Low/Marginal Range | Sufficiency Range | Excessive, toxic? | ||||||
| Nitrogen, % N | 1.80 | - | 2.40 | 2.40 | - | 5.00 | ||
| Phosphorus, %P | 0.13 | - | 0.23 | 0.23 | - | 0.60 | ||
| Potassium, % K | 2.00 | - | 2.30 | 2.30 | - | 5.80 | ||
| Calcium, % Ca | 0.30 | - | 0.50 | 0.50 | - | 4.20 | ||
| Magnesium, % Mg | 0.16 | - | 0.20 | 0.20 | - | 1.00 | ||
| Sulfur, % S | 0.40 | - | 0.60 | 0.60 | - | 1.80 | ||
| Zinc, ppm Zn | 15 | - | 20 | 20 | - | 120 | ||
| Iron, ppm Fe | 35 | - | 50 | 50 | - | 350 | ||
| Manganese, ppm Mn | 20 | - | 25 | 25 | - | 180 | ||
| Copper ppm Cu | 3 | - | 4 | 4 | - | 20 | ||
| Boron, ppm B | 25 | - | 30 | 30 | - | 80 | ||
| Nitrogen-to-sulfur ratio (N:S) | n/a | n/a | ||||||
| Sodium, % Na | n/a | n/a | ||||||
| Chloride, % Cl | n/a | n/a | ||||||
¶ Figure C.
¶ D. Pod Formation to Maturity
Plant Part: Uppermost recently mature leaf blades
Sampling Procedure: Uppermost recently mature leaf blades
| Analysis | Tissue Concentration Guidelines | |||||||
| Low/Marginal Range | Sufficiency Range | Excessive, toxic? | ||||||
| Nitrogen, % N | n/a | n/a | ||||||
| Phosphorus, %P | n/a | n/a | ||||||
| Potassium, % K | n/a | n/a | ||||||
| Calcium, % Ca | n/a | n/a | ||||||
| Magnesium, % Mg | n/a | n/a | ||||||
| Sulfur, % S | n/a | n/a | ||||||
| Zinc, ppm Zn | n/a | n/a | ||||||
| Iron, ppm Fe | n/a | n/a | ||||||
| Manganese, ppm Mn | n/a | n/a | ||||||
| Copper ppm Cu | n/a | n/a | ||||||
| Boron, ppm B | n/a | n/a | ||||||
| Nitrogen-to-sulfur ratio (N:S) | n/a | n/a | ||||||
| Sodium, % Na | n/a | n/a | ||||||
| Chloride, % Cl | n/a | n/a | ||||||
Note: During plant maturity, nutrients may be translocated from the leaf tissues to the reproductive tissues (grain, seeds, fruit, etc.) and may be quite variable. The interpretations provided above are best estimates of nutrient content.