⇦ Back to Soil Fertility and Plant Nutrition Home
¶ Cabbage (Brassica oleracea)
| Table No: | Growth stage: | Plant part: |
| Table A | Young plants, 2 - 6 weeks old | Whole plants |
| Table B | 5 weeks after transplanting | Mature leaves |
| Table C | 8 weeks after transplanting | Mature leaves |
| Table D | Heads half-grown | Wrapper leaf |
| Table E | Harvest | Harvest |
| Table E | Heading | Heading |
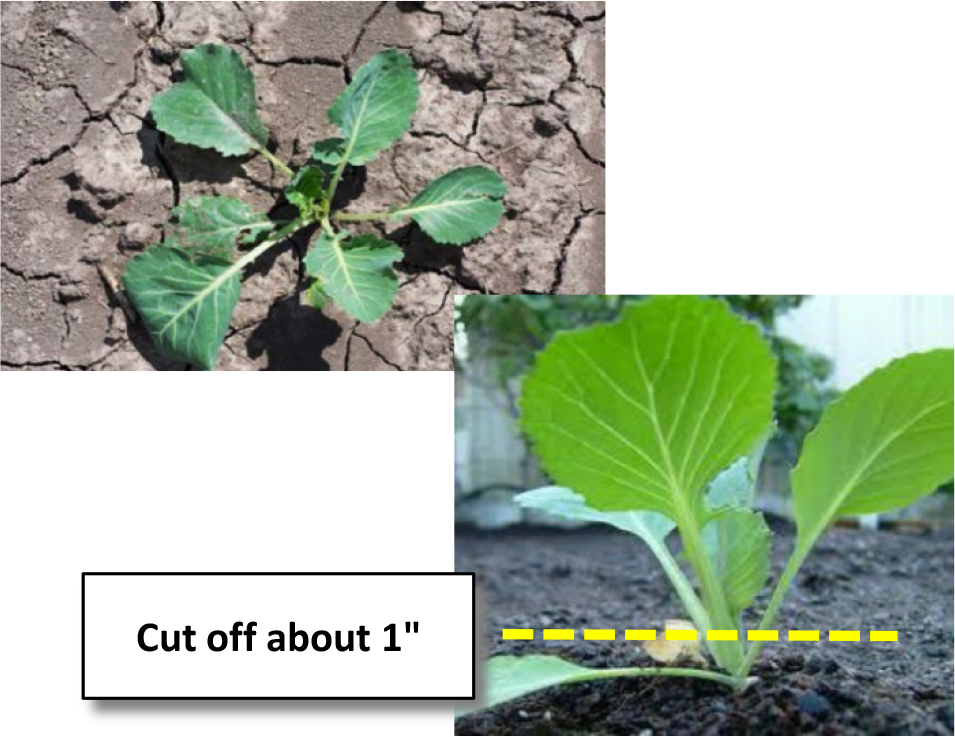
¶ A: Young plants, 2 - 6 weeks old
Plant Part: Whole plants
Sampling Procedure: Collect 20 to 25 whole plants by cutting from 1-inch above the soil line. Do not include roots. At least a pint of loosely packed tissue (a ball about 4 to 5 inches in diameter) should be submitted for analysis. Place sample in a paper bag, not a plastic bag, for shipment to the laboratory,
| Analysis | Tissue Concentration Guidelines | ||||||||
| Low/Marginal Range | Sufficiency Range | Excessive, toxic? | |||||||
| Nitrogen, % N | 3.20 | - | 3.60 | 3.60 | - | 6.0 | |||
| Phosphorus, %P | 0.30 | - | 0.35 | 0.35 | - | 0.8 | |||
| Potassium, % K | 2.80 | - | 3.50 | 3.50 | - | 6.0 | |||
| Calcium, % Ca | 2.20 | - | 3.00 | 3.00 | - | 4.5 | |||
| Magnesium, % Mg | 0.45 | - | 0.50 | 0.50 | - | 2.0 | |||
| Sulfur, % S | 0.25 | - | 0.30 | 0.30 | - | 0.8 | |||
| Zinc, ppm Zn | 25 | - | 30 | 30 | - | 200 | |||
| Iron, ppm Fe | 20 | - | 30 | 30 | - | 200 | |||
| Manganese, ppm Mn | 35 | - | 50 | 50 | - | 200 | |||
| Copper ppm Cu | 4 | - | 5 | 5 | - | 15 | |||
| Boron, ppm B | 20 | - | 25 | 25 | - | 75 | |||
| Nitrogen-to-sulfur ratio (N:S) | 15 | 18 | 10 | 15 | |||||
| Sodium, % Na | |||||||||
| Chloride, % Cl | |||||||||
¶ Figure A.
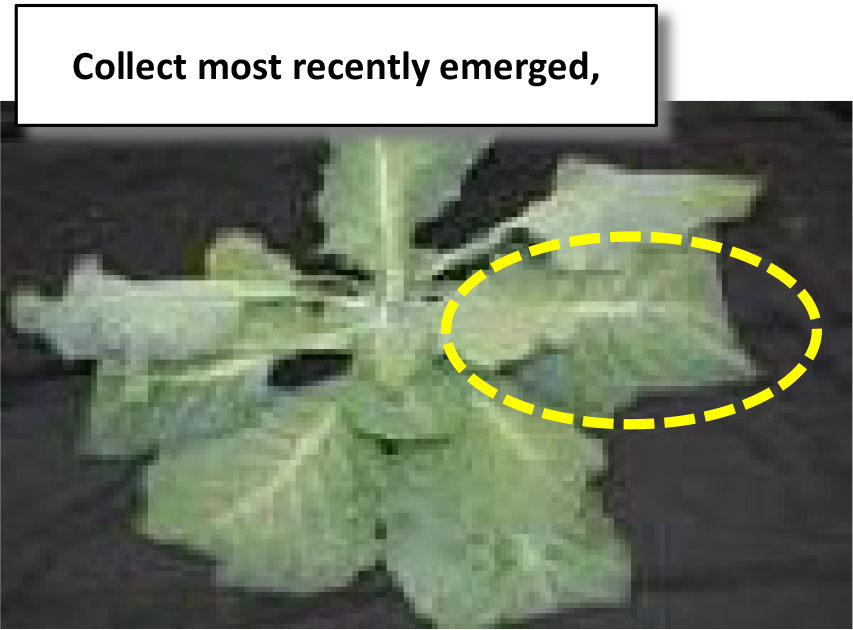
¶ B: 5 weeks after transplanting
Plant Part: Most recently matured leaf
Sampling Procedure: Collect leaves from 20 to 25 plants. Start from the top of the plant and select the most recently expanded, fully mature leaf.
| Analysis | Tissue Concentration Guidelines | ||||||||
| Low/Marginal Range | Sufficiency Range | Excessive, toxic? | |||||||
| Nitrogen, % N | 3.10 | - | 3.40 | 3.40 | - | 5.50 | |||
| Phosphorus, %P | 0.30 | - | 0.33 | 0.33 | - | 0.60 | |||
| Potassium, % K | 2.50 | - | 2.80 | 2.80 | - | 5.00 | |||
| Calcium, % Ca | 0.80 | - | 1.10 | 1.10 | - | 2.00 | |||
| Magnesium, % Mg | 0.20 | - | 0.25 | 0.25 | - | 0.60 | |||
| Sulfur, % S | 0.25 | - | 0.30 | 0.30 | - | 0.75 | |||
| Zinc, ppm Zn | 25 | - | 30 | 30 | - | 50 | |||
| Iron, ppm Fe | 20 | - | 30 | 30 | - | 60 | |||
| Manganese, ppm Mn | 15 | - | 20 | 20 | - | 40 | |||
| Copper ppm Cu | 3 | - | 4 | 4 | - | 15 | |||
| Boron, ppm B | 15 | - | 20 | 20 | - | 60 | |||
| Nitrogen-to-sulfur ratio (N:S) | 15 | 18 | 18 | 15 | |||||
| Sodium, % Na | |||||||||
| Chloride, % Cl | |||||||||
¶ Figure B.
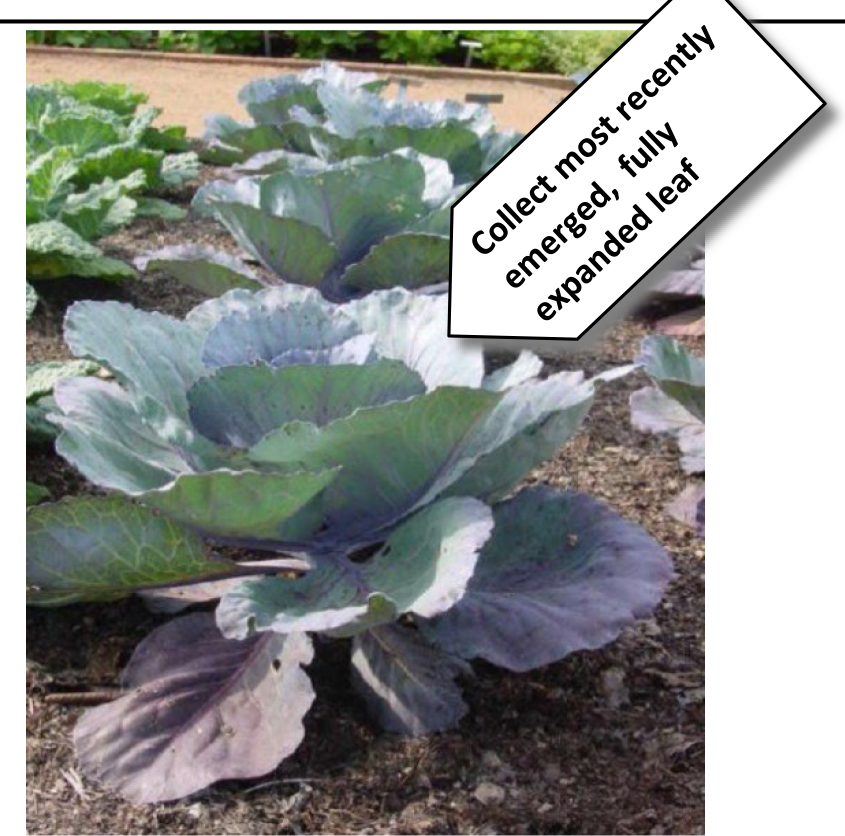
¶ C: 8 weeks after transplanting
Plant Part: Most recently matured leaf
Sampling Procedure: Collect leaves from 20 to 25 plants. Start from the top of the plant and select the most recently expanded, fully mature leaf.
| Analysis | Tissue Concentration Guidelines | ||||||||
| Low/Marginal Range | Sufficiency Range | Excessive, toxic? | |||||||
| Nitrogen, % N | 3.0 | - | 3.2 | 3.2 | - | 5.0 | |||
| Phosphorus, %P | 0.3 | - | 0.3 | 0.3 | - | 0.6 | |||
| Potassium, % K | 2.1 | - | 2.5 | 2.5 | - | 4.8 | |||
| Calcium, % Ca | 0.8 | - | 1.5 | 1.5 | - | 2.5 | |||
| Magnesium, % Mg | 0.2 | - | 0.3 | 0.3 | - | 0.6 | |||
| Sulfur, % S | 0.3 | - | 0.3 | 0.3 | - | 0.8 | |||
| Zinc, ppm Zn | 25 | - | 30 | 30 | - | 50 | |||
| Iron, ppm Fe | 20 | - | 30 | 30 | - | 60 | |||
| Manganese, ppm Mn | 15 | - | 20 | 20 | - | 40 | |||
| Copper ppm Cu | 3 | - | 4 | 4 | - | 15 | |||
| Boron, ppm B | 15 | - | 20 | 20 | - | 60 | |||
| Nitrogen-to-sulfur ratio (N:S) | 15 | 18 | 18 | 15 | |||||
| Sodium, % Na | |||||||||
| Chloride, % Cl | |||||||||
¶ Figure C.
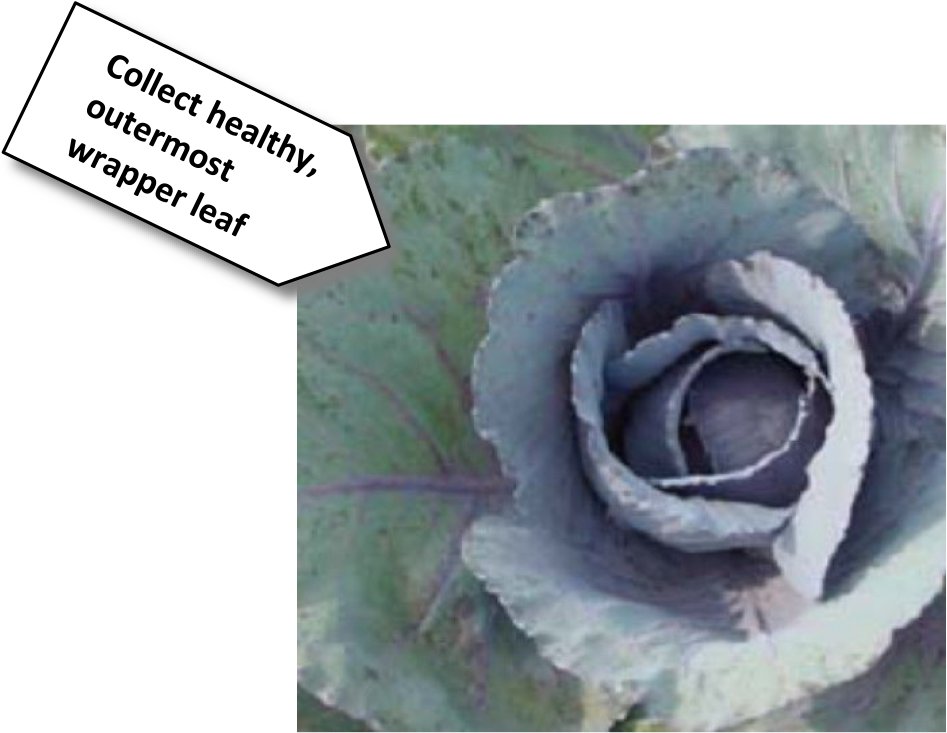
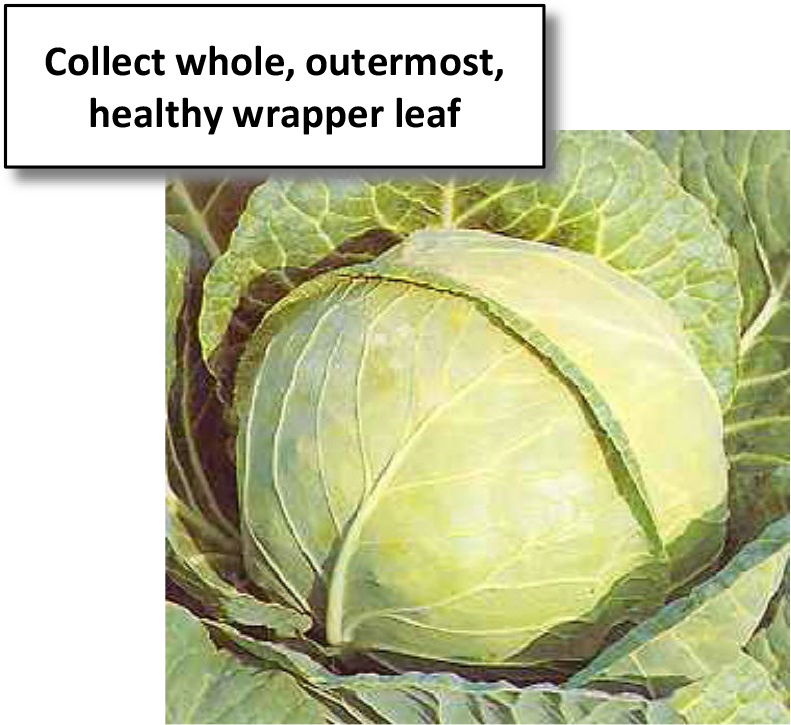
¶ D: Heads half-grown
Plant Part: Wrapper leaf
Sampling Procedure: Collect outermost, whole wrapper leaves from 15 to 20 plants. Collect leaves that are free of disease or insect damage.
| Analysis | Tissue Concentration Guidelines | ||||||||
| Low/Marginal Range | Sufficiency Range | Excessive, toxic? | |||||||
| Nitrogen, % N | 2.70 | - | 3.00 | 3.00 | - | 4.50 | |||
| Phosphorus, %P | 0.26 | - | 0.30 | 0.30 | - | 0.60 | |||
| Potassium, % K | 2.10 | - | 2.40 | 2.40 | - | 4.80 | |||
| Calcium, % Ca | 1.20 | - | 1.40 | 1.40 | - | 2.50 | |||
| Magnesium, % Mg | 0.25 | - | 0.30 | 0.30 | - | 0.60 | |||
| Sulfur, % S | 0.25 | - | 0.30 | 0.30 | - | 0.75 | |||
| Zinc, ppm Zn | 16 | - | 20 | 20 | - | 50 | |||
| Iron, ppm Fe | 25 | - | 30 | 30 | - | 60 | |||
| Manganese, ppm Mn | 15 | - | 20 | 20 | - | 40 | |||
| Copper ppm Cu | 3 | - | 4 | 4 | - | 15 | |||
| Boron, ppm B | 20 | - | 25 | 25 | - | 75 | |||
| Nitrogen-to-sulfur ratio (N:S) | 15 | 18 | 18 | 15 | |||||
| Sodium, % Na | |||||||||
| Chloride, % Cl | |||||||||
¶ Figure D.
¶ E: Harvest
Plant Part: Wrapper leaf
Sampling Procedure: Collect outermost, whole wrapper leaves from 15 to 20 plants. Collect leaves that are free of disease or insect damage.
| Analysis | Tissue Concentration Guidelines | ||||||||
| Low/Marginal Range | Sufficiency Range | Excessive, toxic? | |||||||
| Nitrogen, % N | 1.50 | - | 1.80 | 1.80 | - | 3.00 | |||
| Phosphorus, %P | 0.25 | - | 0.30 | 0.30 | - | 0.60 | |||
| Potassium, % K | 1.20 | - | 1.50 | 1.50 | - | 3.00 | |||
| Calcium, % Ca | 1.20 | - | 1.40 | 1.40 | - | 2.50 | |||
| Magnesium, % Mg | 0.25 | - | 0.30 | 0.30 | - | 0.60 | |||
| Sulfur, % S | 0.25 | - | 0.30 | 0.30 | - | 0.75 | |||
| Zinc, ppm Zn | 16 | - | 20 | 20 | - | 50 | |||
| Iron, ppm Fe | 15 | - | 20 | 20 | - | 50 | |||
| Manganese, ppm Mn | 15 | - | 20 | 20 | - | 40 | |||
| Copper ppm Cu | 3 | - | 4 | 4 | - | 15 | |||
| Boron, ppm B | 25 | - | 30 | 30 | - | 50 | |||
| Nitrogen-to-sulfur ratio (N:S) | 15 | 18 | 18 | 15 | |||||
| Sodium, % Na | |||||||||
| Chloride, % Cl | |||||||||
¶ Figure E.
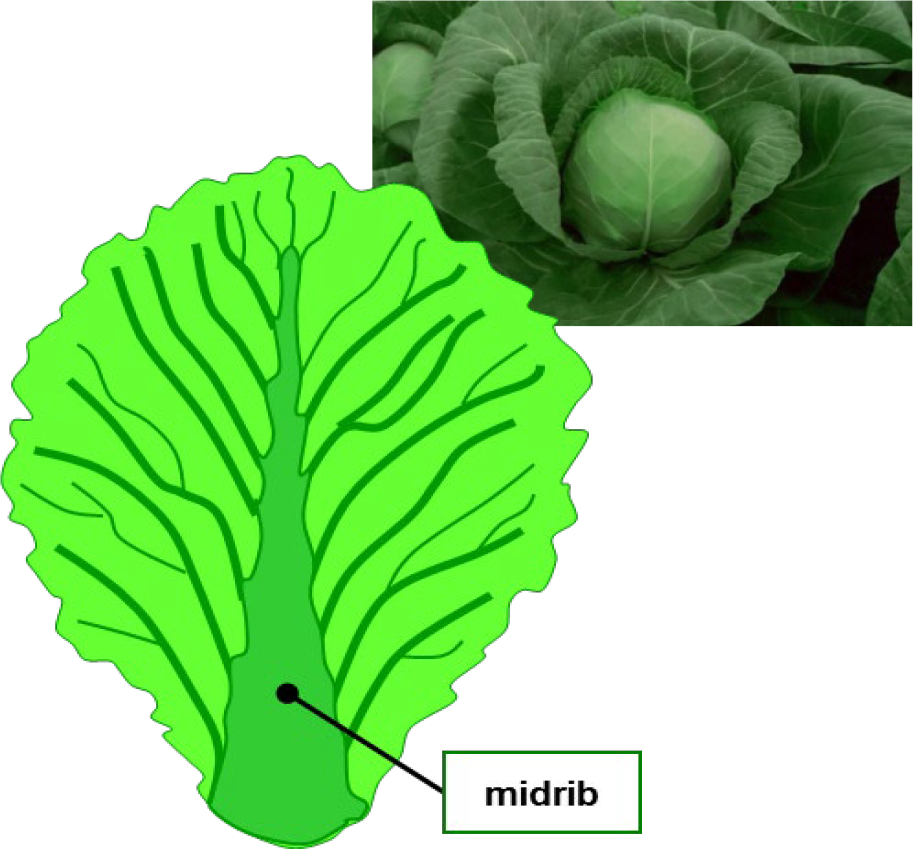
¶ F: Heading
Plant Part: Midrib of most recently matured wrapper leaf
Sampling Procedure: Collect outermost, whole wrapper leaves from 25 to 30 plants. Remove the leaf blade and keep the midribs. Collect midribs from leaves that are free of disease or insect damage.
| Analysis | Tissue Concentration Guidelines | ||||||||
| Low/Marginal Range | Sufficiency Range | Excessive, toxic? | |||||||
| Nitrogen, % N | 1.80 | - | 2.00 | 2.00 | - | 4.50 | |||
| Phosphorus, %P | 600 | - | 700 | 700 | - | 900 | |||
| Potassium, % K | 0.22 | - | 0.25 | 0.25 | - | 1.00 | |||
| Calcium, % Ca | 2.60 | - | 3.00 | 3.00 | - | 5.00 | |||
| Magnesium, % Mg | 0.75 | - | 1.00 | 1.00 | - | 2.00 | |||
| Sulfur, % S | 0.22 | - | 0.26 | 0.26 | - | 1.00 | |||
| Zinc, ppm Zn | 0.20 | - | 0.25 | 0.25 | - | 1.00 | |||
| Iron, ppm Fe | 16 | - | 20 | 20 | - | 200 | |||
| Manganese, ppm Mn | 30 | - | 40 | 40 | - | 200 | |||
| Copper ppm Cu | 30 | - | 40 | 40 | - | 200 | |||
| Boron, ppm B | 5 | - | 6 | 6 | - | 15 | |||
| Nitrogen-to-sulfur ratio (N:S) | 20 | 25 | 25 | 75 | |||||
| Sodium, % Na | 15 | 18 | 18 | 15 | |||||
| Chloride, % Cl | |||||||||
¶ Figure F.
Note: Leaf analysis can be a reliable indicator of a tree's nutrient status and used to diagnose problems occurring during the growing season. It is also useful to differentiate between nutritional problems and disease symptoms.
These plant analysis interpretations are developed from data collected across a wide range of conditions. Plant tissue levels can vary between varieties or be affected by conditions that affect nutrient uptake, Low nutrient levels may be due to deficiency or to dilution by intensive growth. High or excessive nutrient levels may be a sign of restricted growth allowing nutrients to accumulate in the plant tissue. Nutrient imbalance may be secondary to the primary problem.
Collecting "paired" samples (e.g.,"good" vs. "bad") greatly improves the diagnostic value of plant analysis. Paired sampling also allows comparison of the nutrient status of healthy trees to abnormal ones in situations outside the normal sampling routine.