⇦ Back to Soil Fertility and Plant Nutrition Home
¶ Broccoli (Brassica oleracea, var. italica)
| Table No: | Growth stage: | Plant part: |
| Table A | 4 - 6 leaves | Mature leaves & petiole |
| Table B | 10 - 12 leaves | Mature leaves & petiole |
| Table C | First buds | Mature leaves & petiole |
| Table D | Heading (head development) | Mature leaves & petiole |
| Table E | Pre-harvest | Mature leaves & petiole |
| Table E | Seasonal monitoring | Midribs |
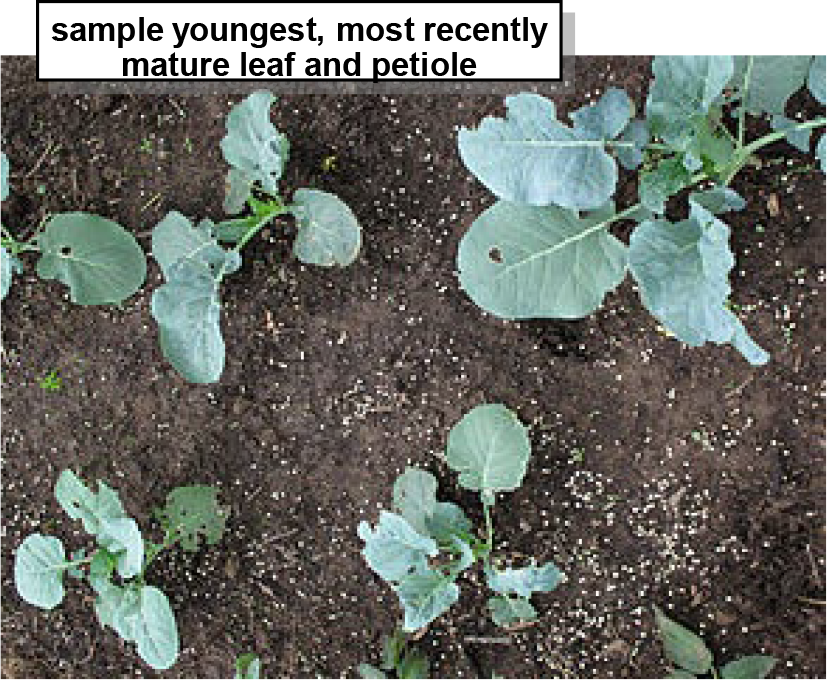
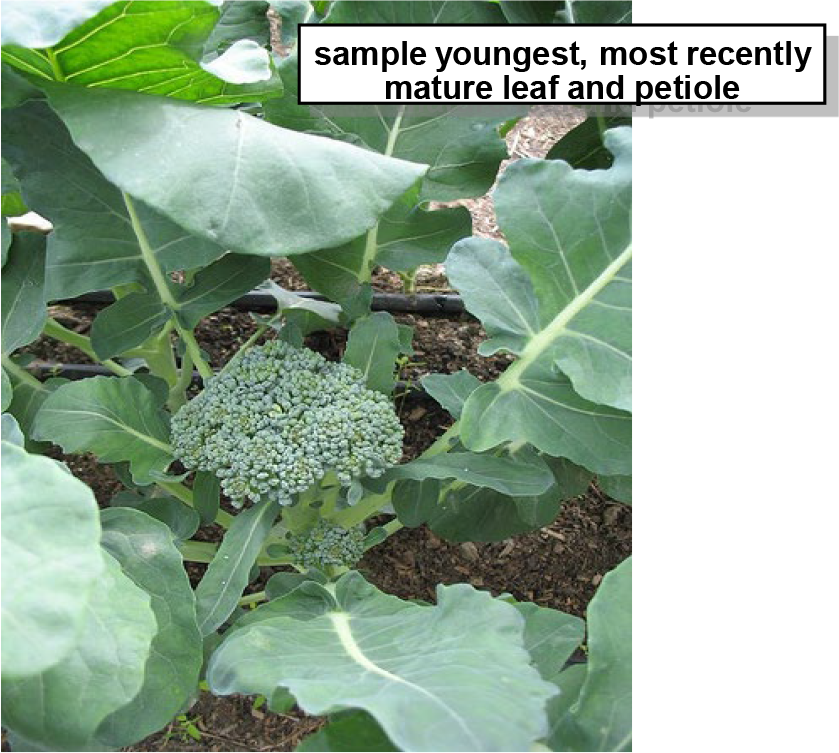
¶ A: 4 - 6 leaves
Plant Part: Most recently matured leaf, including petiole
Sampling Procedure: Collect leaves from 20 to 25 plants. Start from the top of the plant and select the most recently expanded, fully mature leaf including petiole
| Analysis | Tissue Concentration Guidelines | ||||||||
| Low/Marginal Range | Sufficiency Range | Excessive, toxic? | |||||||
| Nitrogen, % N | 4.50 | - | 5.50 | 5.50 | - | 6.50 | |||
| Phosphorus, %P | 0.40 | - | 0.50 | 0.50 | - | 0.80 | |||
| Potassium, % K | 3.00 | - | 3.50 | 3.50 | - | 6.50 | |||
| Calcium, % Ca | 1.50 | - | 2.00 | 2.00 | - | 3.50 | |||
| Magnesium, % Mg | 0.30 | - | 0.40 | 0.40 | - | 0.50 | |||
| Sulfur, % S | 0.45 | - | 0.55 | 0.55 | - | 0.65 | |||
| Zinc, ppm Zn | 25 | - | 45 | 45 | - | 95 | >100 | ||
| Iron, ppm Fe | 30 | - | 40 | 40 | - | 300 | 500 | ||
| Manganese, ppm Mn | 20 | - | 25 | 25 | - | 150 | >150 | ||
| Copper ppm Cu | 3 | - | 5 | 5 | - | 10 | >10 | ||
| Boron, ppm B | 20 | - | 30 | 30 | - | 50 | >100 | ||
| Nitrogen-to-sulfur ratio (N:S) | |||||||||
| Sodium, % Na | |||||||||
| Chloride, % Cl | |||||||||
¶ Figure A.
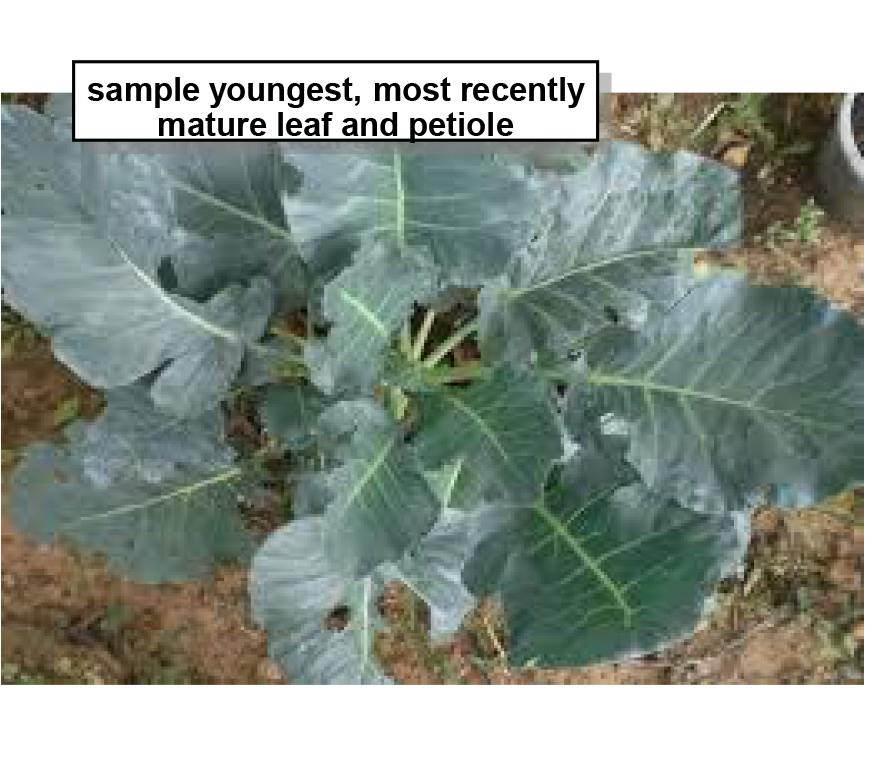
¶ B: 10 - 12 leaves
Plant Part: Most recently matured leaf, including petiole
Sampling Procedure: Collect leaves from 20 to 25 plants. Start from the top of the plant and select the most recently expanded, fully mature leaf including petiole
| Analysis | Tissue Concentration Guidelines | ||||||||
| Low/Marginal Range | Sufficiency Range | Excessive, toxic? | |||||||
| Nitrogen, % N | 4.50 | - | 5.50 | 5.50 | - | 6.50 | |||
| Phosphorus, %P | 0.40 | - | 0.50 | 0.50 | - | 0.80 | |||
| Potassium, % K | 3.00 | - | 3.50 | 3.50 | - | 6.50 | |||
| Calcium, % Ca | 1.50 | - | 2.00 | 2.00 | - | 3.50 | |||
| Magnesium, % Mg | 0.30 | - | 0.40 | 0.40 | - | 0.50 | |||
| Sulfur, % S | 0.45 | - | 0.55 | 0.55 | - | 0.65 | |||
| Zinc, ppm Zn | 25 | - | 45 | 45 | - | 95 | >100 | ||
| Iron, ppm Fe | 30 | - | 40 | 40 | - | 300 | 500 | ||
| Manganese, ppm Mn | 20 | - | 25 | 25 | - | 150 | >150 | ||
| Copper ppm Cu | 3 | - | 5 | 5 | - | 10 | >10 | ||
| Boron, ppm B | 20 | - | 30 | 30 | - | 50 | >100 | ||
| Nitrogen-to-sulfur ratio (N:S) | |||||||||
| Sodium, % Na | |||||||||
| Chloride, % Cl | |||||||||
¶ Figure B.
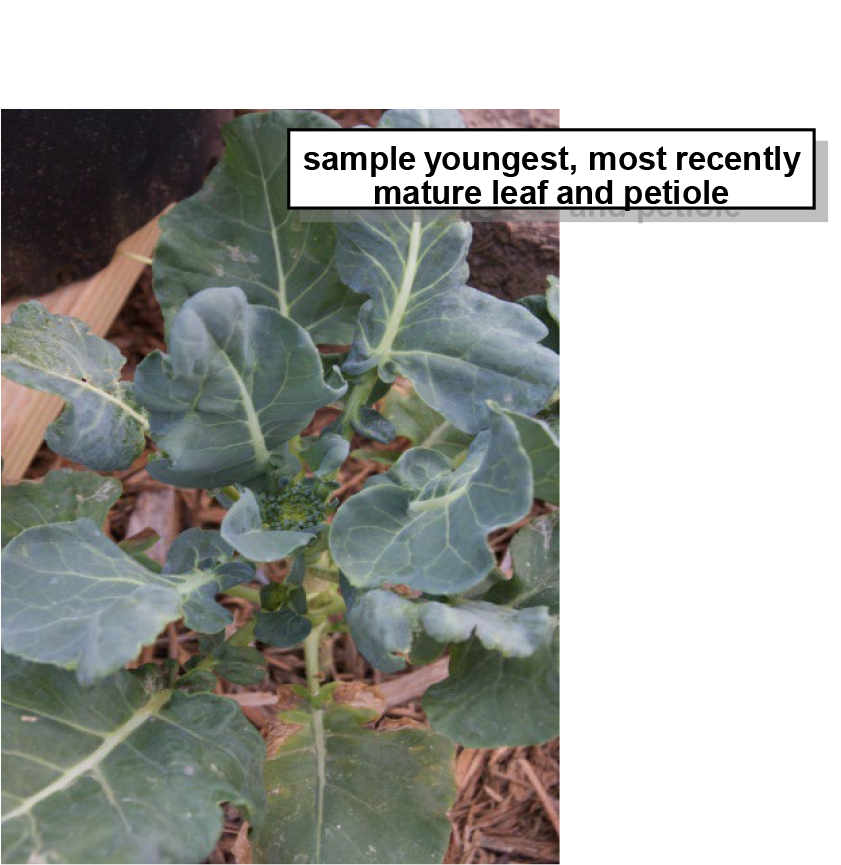
¶ C: First buds
Plant Part: Most recently matured leaf, including petiole
Sampling Procedure: Collect leaves from 20 to 25 plants. Start from the top of the plant and select the most recently expanded, fully mature leaf including petiole
| Analysis | Tissue Concentration Guidelines | ||||||||
| Low/Marginal Range | Sufficiency Range | Excessive, toxic? | |||||||
| Nitrogen, % N | 3.50 | - | 4.50 | 4.50 | - | 6.50 | |||
| Phosphorus, %P | 0.35 | - | 0.45 | 0.45 | - | 0.80 | |||
| Potassium, % K | 2.00 | - | 3.00 | 3.00 | - | 5.00 | |||
| Calcium, % Ca | 0.80 | - | 1.00 | 1.00 | - | 3.50 | |||
| Magnesium, % Mg | 0.15 | - | 0.20 | 0.20 | - | 0.45 | |||
| Sulfur, % S | 0.35 | - | 0.45 | 0.45 | - | 0.65 | |||
| Zinc, ppm Zn | 25 | - | 45 | 45 | - | 95 | >100 | ||
| Iron, ppm Fe | 30 | - | 40 | 40 | - | 300 | 500 | ||
| Manganese, ppm Mn | 20 | - | 25 | 25 | - | 150 | >150 | ||
| Copper ppm Cu | 3 | - | 5 | 5 | - | 10 | >10 | ||
| Boron, ppm B | 20 | - | 30 | 30 | - | 50 | >100 | ||
| Nitrogen-to-sulfur ratio (N:S) | |||||||||
| Sodium, % Na | |||||||||
| Chloride, % Cl | |||||||||
¶ Figure C.
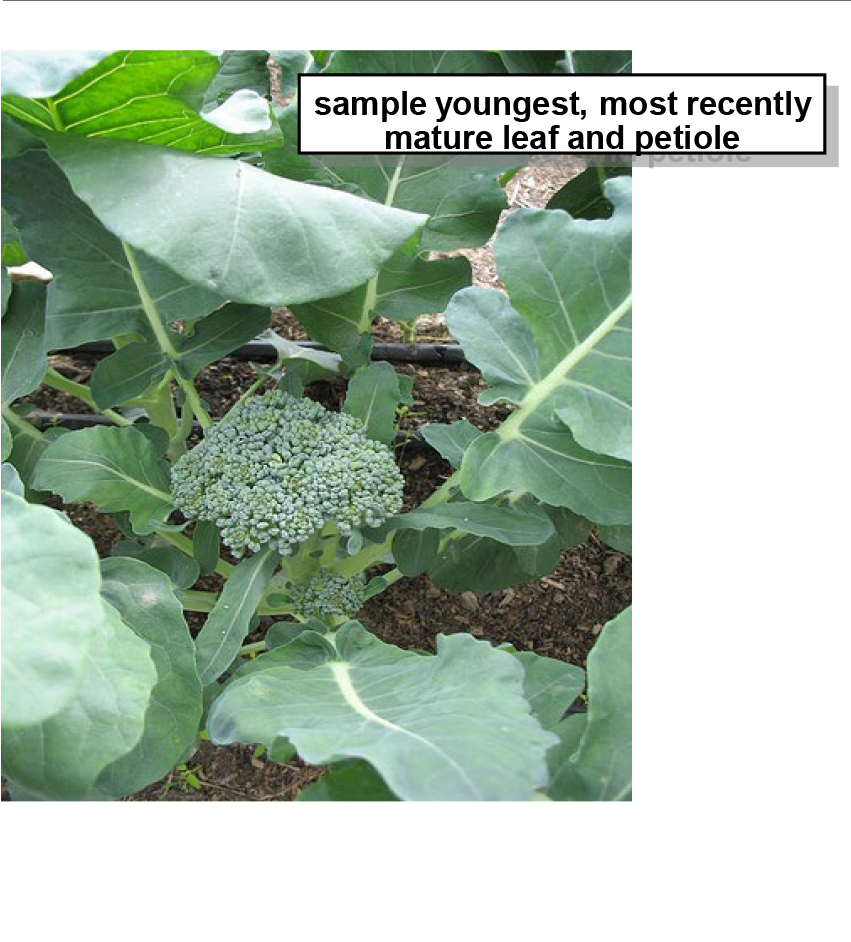
¶ D: Heading (head development)
Plant Part: Most recently matured leaf, including petiole
Sampling Procedure: Collect leaves from 20 to 25 plants. Start from the top of the plant and select the most recently expanded, fully mature leaf including petiole
| Analysis | Tissue Concentration Guidelines | ||||||||
| Low/Marginal Range | Sufficiency Range | Excessive, toxic? | |||||||
| Nitrogen, % N | 3.0 | - | 3.5 | 3.5 | - | 5.5 | |||
| Phosphorus, %P | 0.3 | - | 0.3 | 0.3 | - | 1.0 | |||
| Potassium, % K | 1.3 | - | 2.0 | 2.0 | - | 4.5 | |||
| Calcium, % Ca | 1.0 | - | 1.3 | 1.3 | - | 2.5 | |||
| Magnesium, % Mg | 0.3 | - | 0.3 | 0.3 | - | 0.8 | |||
| Sulfur, % S | 0.2 | - | 0.2 | 0.2 | - | 0.4 | |||
| Zinc, ppm Zn | 25 | - | 45 | 45 | - | 95 | >100 | ||
| Iron, ppm Fe | 30 | - | 40 | 40 | - | 300 | 500 | ||
| Manganese, ppm Mn | 20 | - | 25 | 25 | - | 150 | >150 | ||
| Copper ppm Cu | 3 | - | 5 | 5 | - | 10 | >10 | ||
| Boron, ppm B | 20 | - | 30 | 30 | - | 50 | >100 | ||
| Nitrogen-to-sulfur ratio (N:S) | |||||||||
| Sodium, % Na | |||||||||
| Chloride, % Cl | |||||||||
¶ Figure D.
¶ E: Pre-harvest
Plant Part: Most recently matured leaf, including petiole
Sampling Procedure: Collect leaves from 20 to 25 plants. Start from the top of the plant and select the most recently expanded, fully mature leaf including petiole
| Analysis | Tissue Concentration Guidelines | ||||||||
| Low/Marginal Range | Sufficiency Range | Excessive, toxic? | |||||||
| Nitrogen, % N | 2.50 | - | 3.00 | 3.00 | - | 4.50 | |||
| Phosphorus, %P | 0.35 | - | 0.45 | 0.45 | - | 0.70 | |||
| Potassium, % K | 1.10 | - | 1.50 | 1.50 | - | 4.00 | |||
| Calcium, % Ca | 0.60 | - | 1.00 | 1.00 | - | 2.50 | |||
| Magnesium, % Mg | 0.12 | - | 0.18 | 0.18 | - | 0.25 | |||
| Sulfur, % S | 0.20 | - | 0.30 | 0.30 | - | 0.45 | |||
| Zinc, ppm Zn | 25 | - | 45 | 45 | - | 95 | >100 | ||
| Iron, ppm Fe | 30 | - | 40 | 40 | - | 300 | 500 | ||
| Manganese, ppm Mn | 20 | - | 25 | 25 | - | 150 | >150 | ||
| Copper ppm Cu | 3 | - | 5 | 5 | - | 10 | >10 | ||
| Boron, ppm B | 20 | - | 30 | 30 | - | 50 | >100 | ||
| Nitrogen-to-sulfur ratio (N:S) | |||||||||
| Sodium, % Na | |||||||||
| Chloride, % Cl | |||||||||
¶ Figure E.
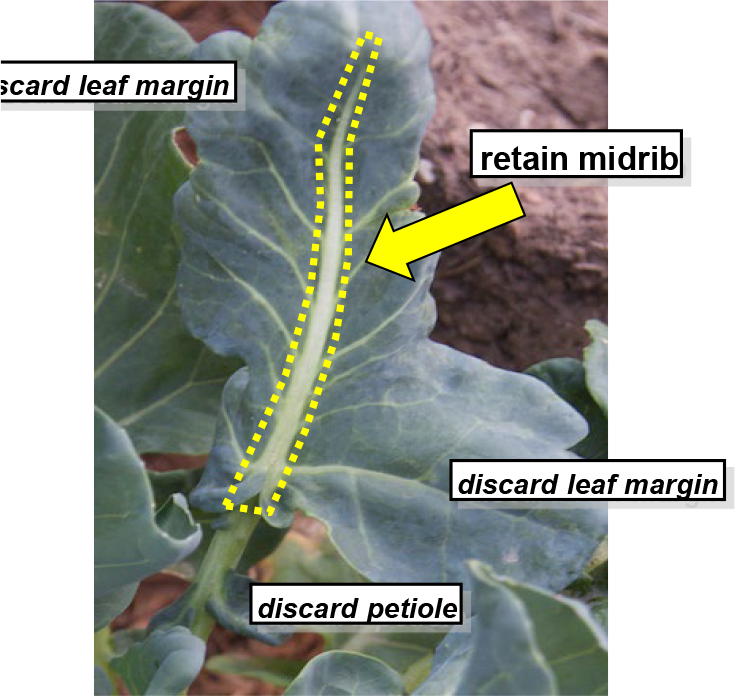
¶ F: Seasonal monitoring
Plant Part: Midrib of youngest mature leaf
Sampling Procedure: Collect leaves from 25 to 30 plants. Start from the top of the plant and select the most recently expanded, fully mature (i.e., full-size) leaf. Discard petiole. Discard leaf margin, retaining the thick midrib (mid-vein)
| Analysis | Tissue Concentration Guidelines | |||||
| Marginal Range | Sufficiency Range | |||||
| Nitrate, ppm NO3-N | ||||||
| 4 - 6 leaves | 10000 | - | 13000 | 13000 | - | 20000 |
| 10 - 12 leaves | 8000 | - | 9000 | 9000 | - | 18000 |
| First buds | 5000 | - | 6000 | 6000 | - | 13000 |
| Heading | 3500 | - | 5000 | 5000 | - | 8000 |
| Pre-harvest | 2000 | - | 2500 | 2500 | - | 4000 |
| Phosphate, ppm PO4-P | ||||||
| 4 - 6 leaves | 3500 | - | 4500 | 4500 | - | 5500 |
| 10 - 12 leaves | 2500 | - | 3500 | 3500 | - | 5000 |
| First buds | 2000 | - | 3000 | 3000 | - | 5000 |
| Heading | 2000 | - | 3000 | 3000 | - | 4500 |
| Pre-harvest | 2000 | - | 3000 | 3000 | - | 4000 |
| Potassium, % K | ||||||
| 4 - 6 leaves | 5.50 | - | 6.00 | 6.00 | - | 8.50 |
| 10 - 12 leaves | 5.50 | - | 6.00 | 6.00 | - | 8.50 |
| First buds | 3.20 | - | 3.50 | 3.50 | - | 5.50 |
| Heading | 2.70 | - | 3.00 | 3.00 | - | 5.00 |
| Pre-harvest | 2.50 | - | 2.80 | 2.80 | - | 4.00 |
¶ Figure F.
Note: Leaf analysis can be a reliable indicator of a tree's nutrient status and used to diagnose problems occurring during the growing season. It is also useful to differentiate between nutritional problems and disease symptoms.
These plant analysis interpretations are developed from data collected across a wide range of conditions. Plant tissue levels can vary between varieties or be affected by conditions that affect nutrient uptake, Low nutrient levels may be due to deficiency or to dilution by intensive growth. High or excessive nutrient levels may be a sign of restricted growth allowing nutrients to accumulate in the plant tissue. Nutrient imbalance may be secondary to the primary problem.
Collecting "paired" samples (e.g.,"good" vs. "bad") greatly improves the diagnostic value of plant analysis. Paired sampling also allows comparison of the nutrient status of healthy trees to abnormal ones in situations outside the normal sampling routine.