⇦ Back to Soil Fertility and Plant Nutrition Home
¶ Blueberry (Vaccinium corymbosum)
¶ A: Northern highbush: Just prior to harvest or during first week of harvest
Plant Part: Mature leaves
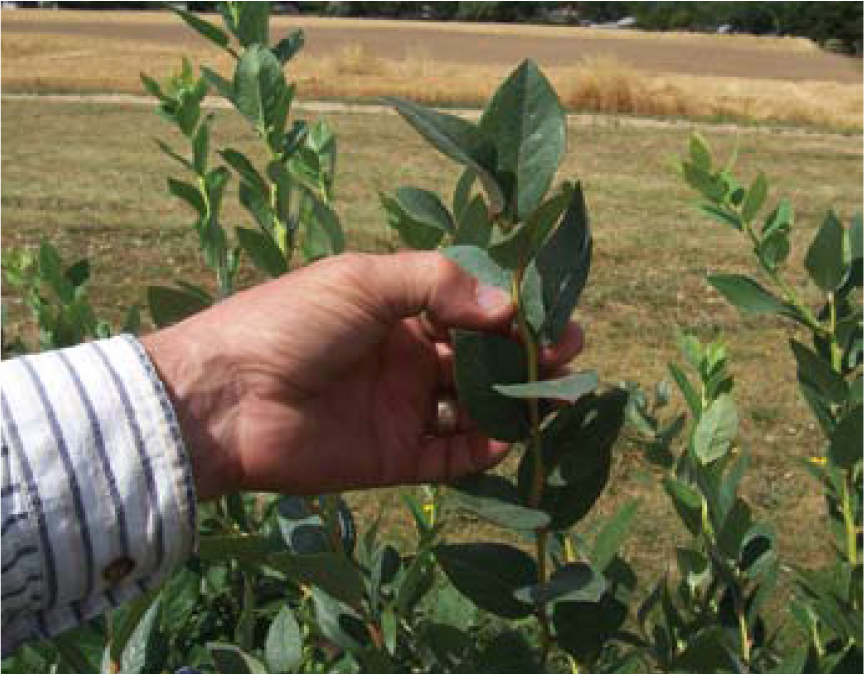
Sampling Procedure: Collect samples of the most recently matured, fully-expanded leaves. Select leaves from fruiting shoots of the current season growth. This usually corresponds to the fourth to sixth leaf from the shoot tip (i.e., lateral shoots, position 4, 5, and 6). Collect a total of 50 to 100 leaves from ten to fifteen plants plants, about five to seven leaves per plant. Do not take leaves from whips
| Analysis | Tissue Concentration Guidelines | ||||||||
| Low/Marginal Range | Sufficiency Range | Excessive, toxic? | |||||||
| Nitrogen, % N | 1.60 | - | 1.80 | 1.80 | - | 2.30 | >2.50 | ||
| Phosphorus, %P | 0.06 | - | 0.10 | 0.10 | - | 0.40 | >0.80 | ||
| Potassium, % K | 0.35 | - | 0.40 | 0.40 | - | 0.70 | >0.90 | ||
| Calcium, % Ca | 0.30 | - | 0.35 | 0.35 | - | 0.80 | >1.00 | ||
| Magnesium, % Mg | 0.12 | - | 0.15 | 0.15 | - | 0.30 | >0.45 | ||
| Sulfur, % S | 0.10 | - | 0.12 | 0.12 | - | 0.18 | >0.25 | ||
| Zinc, ppm Zn | 8 | - | 10 | 10 | - | 40 | >80 | ||
| Iron, ppm Fe | 40 | - | 60 | 60 | - | 200 | >400 | ||
| Manganese, ppm Mn | 25 | - | 50 | 50 | - | 350 | >500 | ||
| Copper ppm Cu | 4 | - | 6 | 6 | - | 20 | >50 | ||
| Boron, ppm B | 15 | - | 25 | 25 | - | 70 | >90 | ||
| Sodium, % Na | 10 | - | 15 | ||||||
| Chloride, % Cl | >0.35? | ||||||||
¶ Figure A.
¶ B: Rabbiteye, pre-harvest
Plant Part: Mature leaves
Sampling Procedure: Collect 30 to 60 of the most recently mature leaves from mid-section of the primocane (first year, non-fruiting growth) about two weeks after berry harvest (normally in August). Mid-section leaves are usually the third to the fifth set of leaves back from the growing point or bud. Discard petioles, keep the leaf blades.
| Analysis | Tissue Concentration Guidelines | ||||||||
| Low/Marginal Range | Sufficiency Range | Excessive, toxic? | |||||||
| Nitrogen, % N | 1.00 | - | 1.20 | 1.20 | - | 1.70 | >2.00 | ||
| Phosphorus, %P | 0.07 | - | 0.09 | 0.09 | - | 0.20 | >0.60 | ||
| Potassium, % K | 0.30 | - | 0.35 | 0.35 | - | 0.60 | >0.90 | ||
| Calcium, % Ca | 0.20 | - | 0.25 | 0.25 | - | 0.70 | >1.00 | ||
| Magnesium, % Mg | 0.12 | - | 0.14 | 0.14 | - | 0.20 | >0.40 | ||
| Sulfur, % S | 0.10 | - | 0.12 | 0.12 | - | 0.25 | >0.35 | ||
| Zinc, ppm Zn | 8 | - | 10 | 10 | - | 25 | >30 | ||
| Iron, ppm Fe | 20 | - | 25 | 25 | - | 70 | >90 | ||
| Manganese, ppm Mn | 20 | - | 25 | 25 | - | 100 | >125 | ||
| Copper ppm Cu | 2 | - | 3 | 3 | - | 10 | >12 | ||
| Boron, ppm B | 11 | - | 13 | 13 | - | 25 | >35 | ||
| Sodium, % Na | 8 | 12 | |||||||
| Chloride, % Cl | >0.35? | ||||||||
¶ Figure B.
Note: Interpretations are based the relationship between nutrient levels in a particular part of a "standard" tissue in a specific time in the growing season. These plant tissue ranges and interpretations are not considered valid with plant parts or growth stages other than those specified. These interpretations are developed from data collected across a wide range of crop, soil, and climate conditions. Results from a single sample may be affected by time of day, climatic conditions, plant stress, age, or disease, that are not directly related to fertility status. Nutrient concentrations are not uniform throughout the plant and may change as the tissue matures.Tissue analysis trends should be evaluated by variety, growing season, and yield/quality goals. Collecting plant samples from the same location as soil samples allows comparison of soil nutrient availability with plant nutrient status.Low nutrient levels may be due to deficiency or to dilution by intensive growth. High or excessive nutrient levels may be a sign of restricted growth allowing nutrients to accumulate in the plant tissue. Nutrient imbalance may be secondary to the primary problem.