⇦ Back to Soil Fertility and Plant Nutrition Home
¶ Beans, dry (Phaseolus vulgaris)
| Table No: | Growth stage: | Plant part: |
| Table A | Before bloom | Mature leaves |
| Table B | First bloom | Mature leaves |
| Table C | Full bloom | Mature leaves |
| Table D | Mid-growth to early bloom | Petiole |
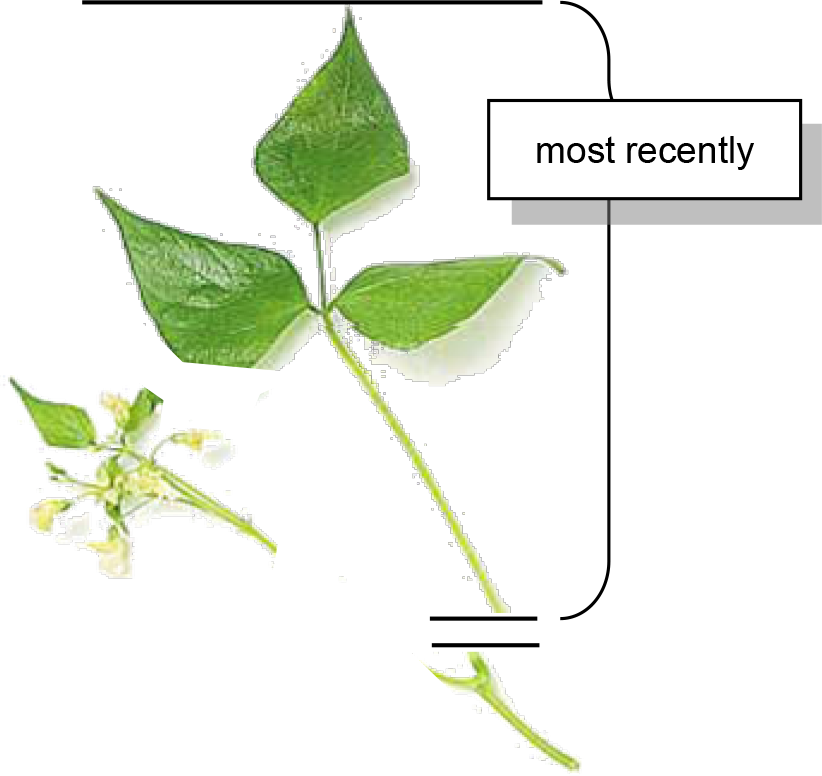
¶ A: Before bloom
Plant Part: Mature leaves
Sampling Procedure: Collect leaves from 15 to 20 plants. Start from the top of the plant and select the most recently expanded, fully mature trifoliate leaves including petiole
| Analysis | Tissue Concentration Guidelines | ||||||||
| Low/Marginal Range | Sufficiency Range | Excessive, toxic? | |||||||
| Nitrogen, % N | 2.80 | - | 3.0 | 3.0 | - | 4.0 | |||
| Phosphorus, %P | 0.27 | - | 0.3 | 0.3 | - | 0.4 | |||
| Potassium, % K | 1.80 | - | 2.0 | 2.0 | - | 3.0 | |||
| Calcium, % Ca | 0.70 | - | 0.8 | 0.8 | - | 1.5 | |||
| Magnesium, % Mg | 0.23 | - | 0.3 | 0.3 | - | 0.6 | |||
| Sulfur, % S | 0.18 | - | 0.2 | 0.2 | - | 0.4 | |||
| Zinc, ppm Zn | 17 | - | 20 | 20 | - | 80 | 250 | ||
| Iron, ppm Fe | 25 | - | 40 | 40 | - | 300 | 500 | ||
| Manganese, ppm Mn | 20 | - | 25 | 25 | - | 100 | 500 | ||
| Copper ppm Cu | 4 | - | 5 | 5 | - | 20 | 50 | ||
| Boron, ppm B | 15 | - | 18 | 18 | - | 40 | 150 | ||
| Nitrogen-to-sulfur ratio (N:S) | 8 | - | 12 | ||||||
| Sodium, % Na | 0.25 | - | 0.50 | ||||||
| Chloride, % Cl | 0.30 | - | 1.00 | ||||||
Note: Interpretations are based the relationship between nutrient levels in a particular part of a "standard" tissue in a specific time in the growing season.
These plant tissue ranges and interpretations are not considered valid with plant parts or growth stages other than those specified. These interpretations are developed from data collected across a wide range of crop, soil, and climate conditions.
Results from a single sample may be affected by time of day, climatic conditions, plant stress, age, or disease, that are not directly related to fertility status. Nutrient concentrations are not uniform throughout the plant and may change as the tissue matures.
Tissue analysis trends should be evaluated by variety, growing season, and yield/quality goals. Collecting plant samples from the same location as soil samples allows comparison of soil nutrient availability with plant nutrient status.
Low nutrient levels may be due to deficiency or to dilution by intensive growth. High or excessive nutrient levels may be a sign of restricted growth allowing nutrients to accumulate in the plant tissue. Nutrient imbalance may be secondary to the primary problem.
¶ Figure A.
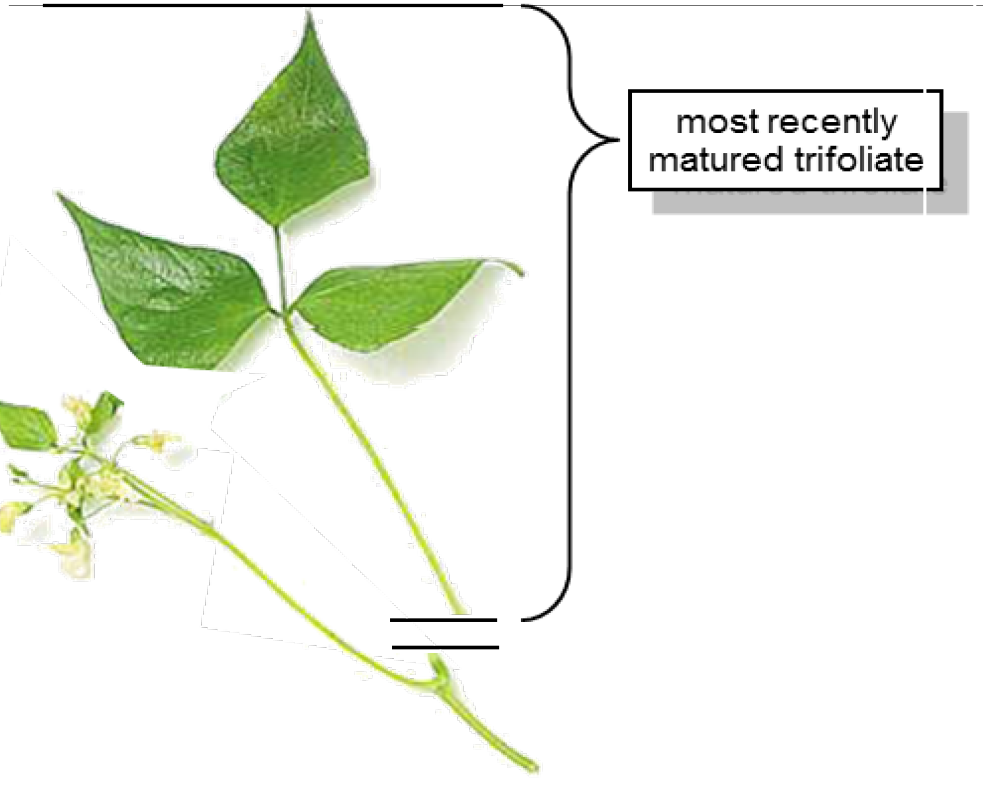
¶ B: First bloom
Plant Part: Mature leaves
Sampling Procedure: Collect leaves from 15 to 20 plants. Start from the top of the plant and select the most recently expanded, fully mature trifoliate leaves including petiole
| Analysis | Tissue Concentration Guidelines | ||||||||
| Low/Marginal Range | Sufficiency Range | Excessive, toxic? | |||||||
| Nitrogen, % N | 2.80 | - | 3.0 | 3.0 | - | 4.0 | |||
| Phosphorus, %P | 0.27 | - | 0.3 | 0.3 | - | 0.4 | |||
| Potassium, % K | 1.80 | - | 2.0 | 2.0 | - | 3.0 | |||
| Calcium, % Ca | 0.70 | - | 0.8 | 0.8 | - | 1.5 | |||
| Magnesium, % Mg | 0.23 | - | 0.3 | 0.3 | - | 0.6 | |||
| Sulfur, % S | 0.18 | - | 0.2 | 0.2 | - | 0.4 | |||
| Zinc, ppm Zn | 17 | - | 20 | 20 | - | 80 | 250 | ||
| Iron, ppm Fe | 25 | - | 40 | 40 | - | 300 | 500 | ||
| Manganese, ppm Mn | 20 | - | 25 | 25 | - | 100 | 500 | ||
| Copper ppm Cu | 4 | - | 5 | 5 | - | 20 | 50 | ||
| Boron, ppm B | 15 | - | 18 | 18 | - | 40 | 150 | ||
| Nitrogen-to-sulfur ratio (N:S) | 8 | - | 12 | ||||||
| Sodium, % Na | 0.25 | - | 0.50 | ||||||
| Chloride, % Cl | 0.30 | - | 1.00 | ||||||
Note: Interpretations are based the relationship between nutrient levels in a particular part of a "standard" tissue in a specific time in the growing season.
These plant tissue ranges and interpretations are not considered valid with plant parts or growth stages other than those specified. These interpretations are developed from data collected across a wide range of crop, soil, and climate conditions.
Results from a single sample may be affected by time of day, climatic conditions, plant stress, age, or disease, that are not directly related to fertility status. Nutrient concentrations are not uniform throughout the plant and may change as the tissue matures.
Tissue analysis trends should be evaluated by variety, growing season, and yield/quality goals. Collecting plant samples from the same location as soil samples allows comparison of soil nutrient availability with plant nutrient status.
Low nutrient levels may be due to deficiency or to dilution by intensive growth. High or excessive nutrient levels may be a sign of restricted growth allowing nutrients to accumulate in the plant tissue. Nutrient imbalance may be secondary to the primary problem.
¶ Figure B.
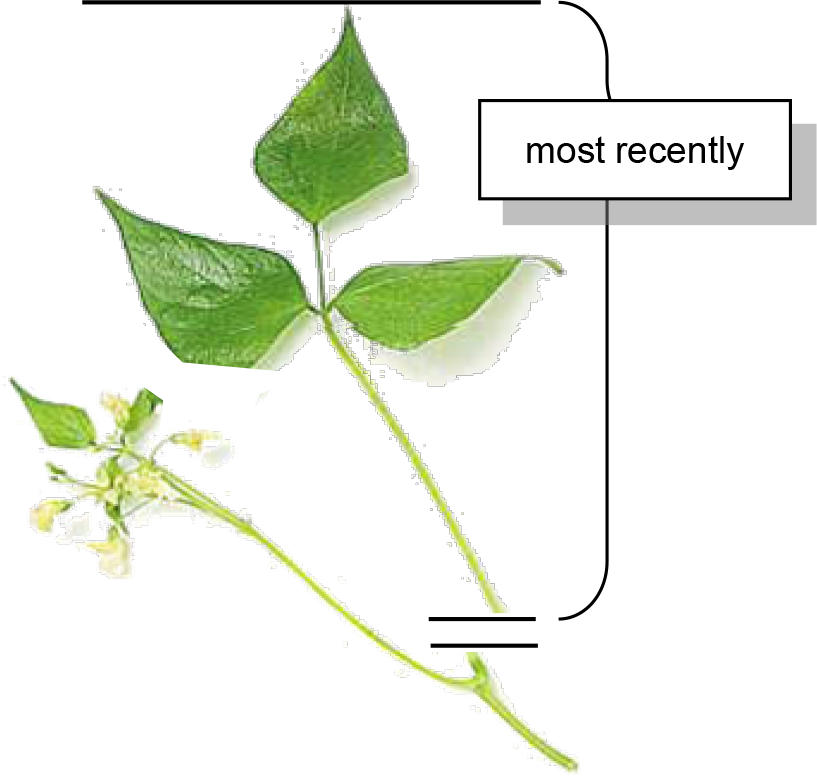
¶ C: Full bloom
Plant Part: Mature leaves
Sampling Procedure: Collect leaves from 15 to 20 plants. Start from the top of the plant and select the most recently expanded, fully mature trifoliate leaves including petiole
| Analysis | Tissue Concentration Guidelines | ||||||||
| Low/Marginal Range | Sufficiency Range | Excessive, toxic? | |||||||
| Nitrogen, % N | 2.30 | - | 2.5 | 2.5 | - | 4.0 | |||
| Phosphorus, %P | 0.27 | - | 0.3 | 0.3 | - | 0.5 | |||
| Potassium, % K | 1.40 | - | 1.6 | 1.6 | - | 2.5 | |||
| Calcium, % Ca | 0.70 | - | 0.8 | 0.8 | - | 1.5 | |||
| Magnesium, % Mg | 0.23 | - | 0.3 | 0.3 | - | 0.6 | |||
| Sulfur, % S | 0.18 | - | 0.2 | 0.2 | - | 0.4 | |||
| Zinc, ppm Zn | 17 | - | 20 | 20 | - | 80 | 250 | ||
| Iron, ppm Fe | 25 | - | 40 | 40 | - | 300 | 500 | ||
| Manganese, ppm Mn | 20 | - | 25 | 25 | - | 100 | 500 | ||
| Copper ppm Cu | 4 | - | 5 | 5 | - | 20 | 50 | ||
| Boron, ppm B | 15 | - | 18 | 18 | - | 40 | 150 | ||
| Nitrogen-to-sulfur ratio (N:S) | 8 | - | 12 | ||||||
| Sodium, % Na | 0.25 | - | 0.50 | ||||||
| Chloride, % Cl | 0.30 | - | 1.00 | ||||||
Note: Interpretations are based the relationship between nutrient levels in a particular part of a "standard" tissue in a specific time in the growing season.
These plant tissue ranges and interpretations are not considered valid with plant parts or growth stages other than those specified. These interpretations are developed from data collected across a wide range of crop, soil, and climate conditions.
Results from a single sample may be affected by time of day, climatic conditions, plant stress, age, or disease, that are not directly related to fertility status. Nutrient concentrations are not uniform throughout the plant and may change as the tissue matures.
Tissue analysis trends should be evaluated by variety, growing season, and yield/quality goals. Collecting plant samples from the same location as soil samples allows comparison of soil nutrient availability with plant nutrient status.
Low nutrient levels may be due to deficiency or to dilution by intensive growth. High or excessive nutrient levels may be a sign of restricted growth allowing nutrients to accumulate in the plant tissue. Nutrient imbalance may be secondary to the primary problem.
¶ Figure C.
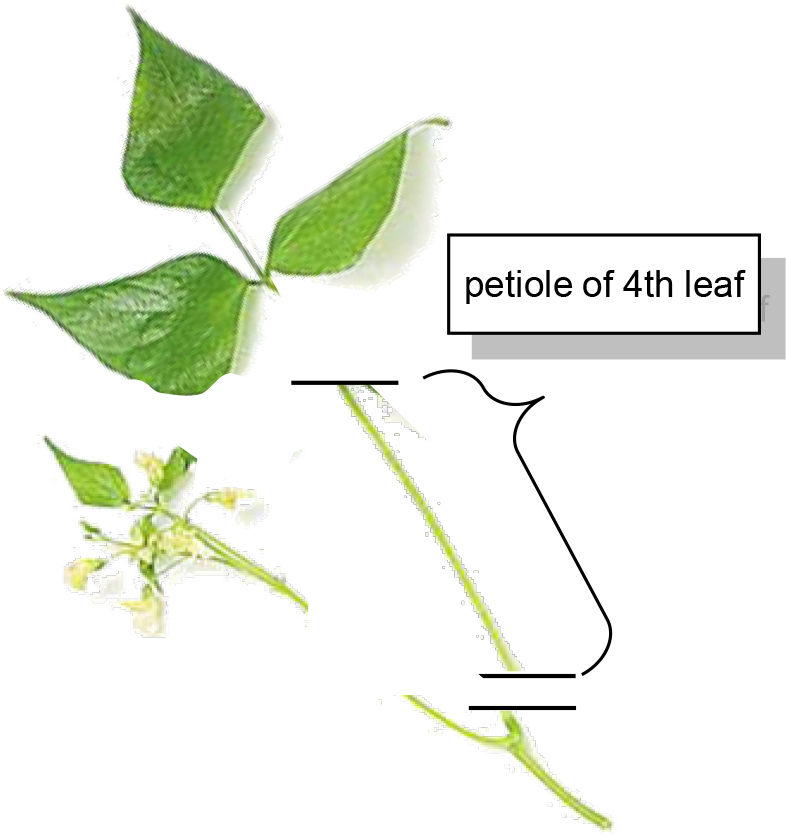
¶ D: Mid-growth to early bloom
Plant Part: Petiole
Sampling Procedure: Collect petioles from 25 to 50 plants. Start from the tip and select the 4th leaf. Collect petiole and discard leaf blade
| Analysis | Tissue Concentration Guidelines | |||||
| Marginal Range | Sufficiency Range | |||||
| Nitrate, ppm NO3-N | ||||||
| Mid-growth | 2000 | - | 3000 | >3000 | ||
| Early bloom | 1000 | - | 1500 | >1500 | ||
| Phosphate, ppm PO4-P | ||||||
| Mid-growth | 1000 | - | 2000 | >2000 | ||
| Early bloom | 800 | - | 1500 | >1500 | ||
| Potassium, % K | ||||||
| Mid-growth | 3.00 | - | 5.00 | >5.00% | ||
| Early bloom | 2.00 | - | 4.00 | >4.00% | ||
*nutrients soluble in 2% acetic acid
Note: Petiole analysis results are best interpreted from trends over the growing season and not on results from a single sampling date. Results from a single sample may be affected by time of day, climatic conditions, plant stress, age, or disease, that are not directly related to fertility status. Nutrient concentrations are not uniform throughout the plant and may change as the tissue matures. Petiole analysis trends should be evaluated by variety, growing season, and yield/quality goals. Collecting petioles from the same location as soil samples allows comparison of soil nutrient availability with petiole nutrient status.
¶ Figure D.