⇦ Back to Soil Fertility and Plant Nutrition Home
¶ Apple (Malus domestica)
| Table No: | Growth stage: | Plant part: |
| Table A | Young, non-bearing trees | Mid-terminal leaves |
| Table B | Fresh market | Mid-terminal leaves |
| Table C | Processing | Mid-terminal leaves |
¶ A: Young, non-bearing trees
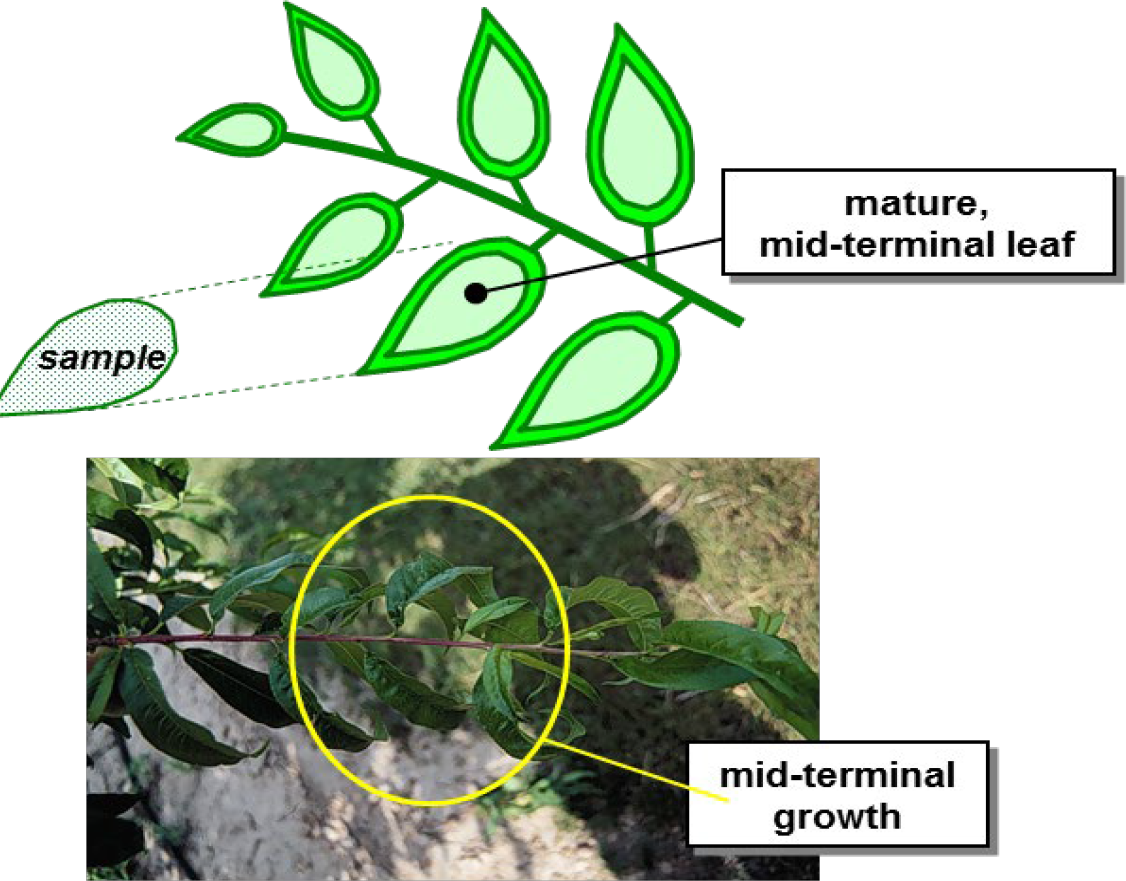
Plant Part: Mid-terminal leaves
Sampling Procedure: Select shoots that make a vertical angle of 45 to 60 degrees from the ground. Select shoots at eye level from around the outside of trees. Remove one or two leaves from the mid-portion of new growth. No more than 10 trees should be used for each sample. Collect a total of 80 to 100 leaves.
| Analysis | Tissue Concentration Guidelines | ||||||||
| Low/Marginal Range | Sufficiency Range | Excessive, toxic? | |||||||
| Nitrogen, % N | 2.20 | - | 2.40 | 2.40 | - | 2.70 | |||
| Phosphorus, %P | 0.13 | - | 0.15 | 0.15 | - | 0.50 | |||
| Potassium, % K | 1.25 | - | 1.40 | 1.40 | - | 2.40 | |||
| Calcium, % Ca | 0.80 | - | 1.00 | 1.00 | - | 2.00 | |||
| Magnesium, % Mg | 0.25 | - | 0.30 | 0.30 | - | 0.50 | |||
| Sulfur, % S | 0.12 | - | 0.14 | 0.14 | - | 0.18 | |||
| Zinc, ppm Zn | 25 | - | 30 | 30 | - | 80 | >200 | ||
| Iron, ppm Fe | 25 | - | 50 | 50 | - | 400 | |||
| Manganese, ppm Mn | 25 | - | 30 | 30 | - | 200 | >500 | ||
| Copper ppm Cu | 5 | - | 7 | 7 | - | 20 | >200 | ||
| Boron, ppm B | 25 | - | 30 | 30 | - | 60 | >150 | ||
| Nitrogen-to-sulfur ratio (N:S) | 15 | - | 18 | 18 | - | 15 | |||
| Sodium, % Na | 0.05 | - | 0.50 | ||||||
| Chloride, % Cl | 0.05 | - | 0.20 | 0.50 | - | 2.00 | |||
¶ Figure A.
¶ B: Fresh market
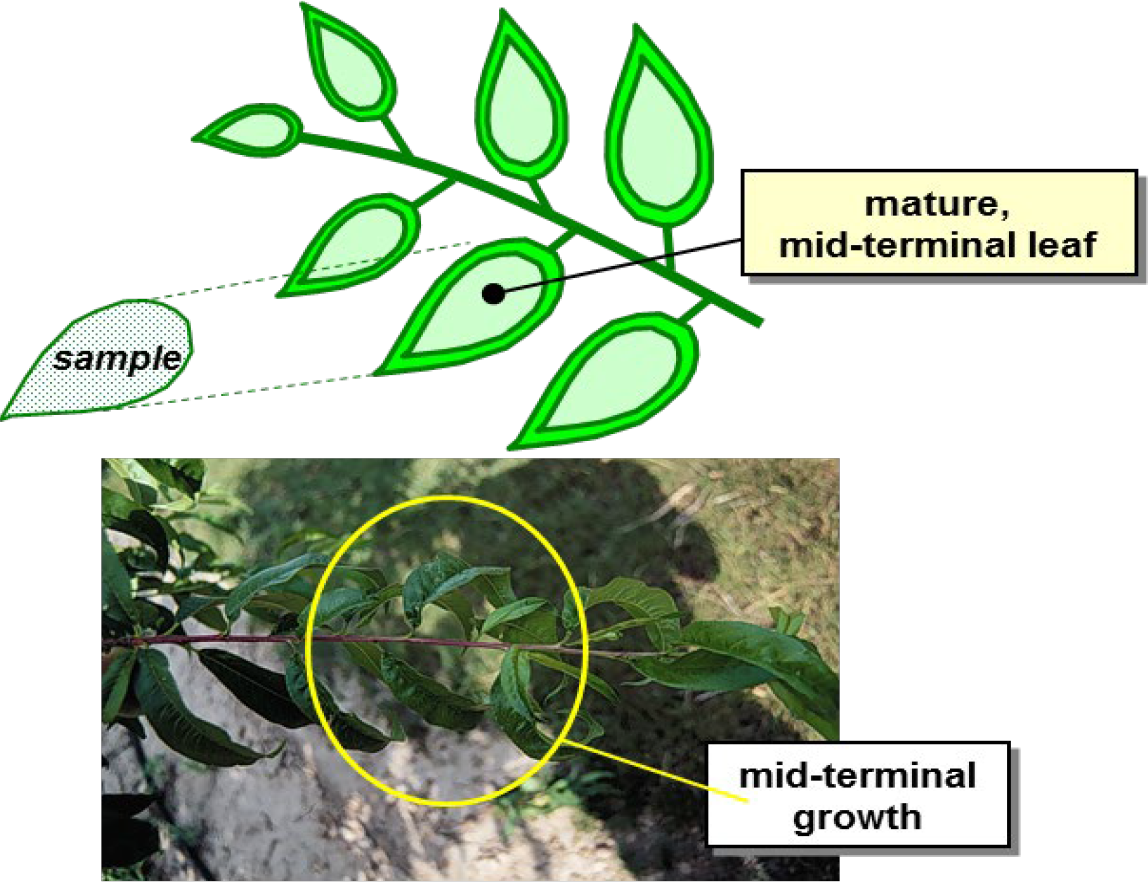
Plant Part: Mid-terminal leaves
Sampling Procedure: Select shoots that make a vertical angle of 45 to 60 degrees from the ground. Select shoots at eye level from around the outside of trees. Remove one or two leaves from the mid-portion of new growth. No more than 10 trees should be used for each sample. Collect a total of 80 to 100 leaves.
| Analysis | Tissue Concentration Guidelines | ||||||||
| Low/Marginal Range | Sufficiency Range | Excessive, toxic? | |||||||
| Nitrogen, % N | 1.90 | - | 2.20 | 2.20 | - | 2.5 | |||
| Phosphorus, %P | 0.13 | - | 0.15 | 0.15 | - | 0.4 | |||
| Potassium, % K | 1.20 | - | 1.30 | 1.30 | - | 2.2 | |||
| Calcium, % Ca | 0.80 | - | 1.00 | 1.00 | - | 1.8 | |||
| Magnesium, % Mg | 0.20 | - | 0.25 | 0.25 | - | 0.5 | |||
| Sulfur, % S | 0.12 | - | 0.14 | 0.14 | - | 0.18 | |||
| Zinc, ppm Zn | 25 | - | 30 | 30 | - | 80 | >200 | ||
| Iron, ppm Fe | 25 | - | 50 | 50 | - | 400 | |||
| Manganese, ppm Mn | 25 | - | 30 | 30 | - | 200 | >500 | ||
| Copper ppm Cu | 5 | - | 7 | 7 | - | 20 | >200 | ||
| Boron, ppm B | 25 | - | 30 | 30 | - | 60 | >150 | ||
| Nitrogen-to-sulfur ratio (N:S) | 15 | - | 18 | 12 | - | 15 | |||
| Sodium, % Na | 0.05 | - | 0.5 | ||||||
| Chloride, % Cl | 0.05 | - | 0.2 | 0.50 | - | 2.00 | |||
¶ Figure B.
¶ C: Processing
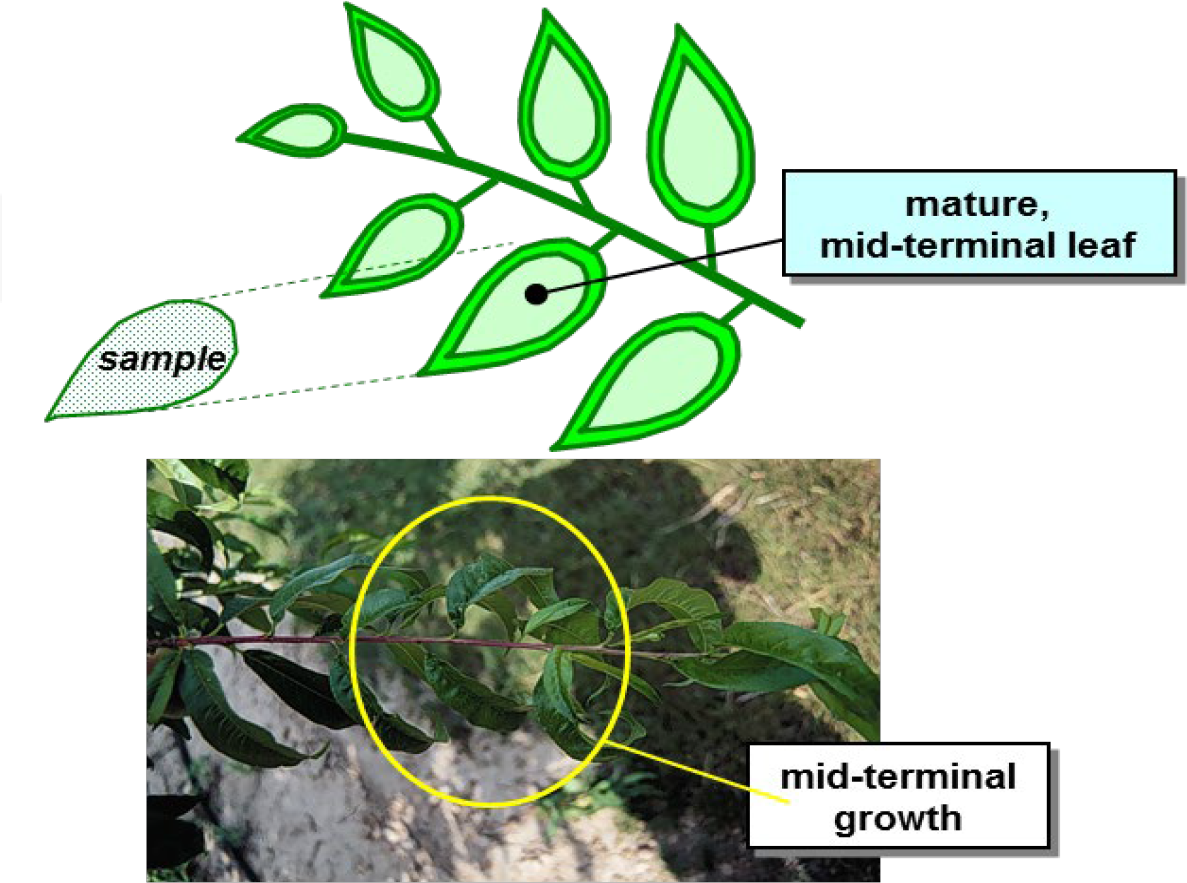
Plant Part: Mid-terminal leaves
Sampling Procedure: Select shoots that make a vertical angle of 45 to 60 degrees from the ground. Select shoots at eye level from around the outside of trees. Remove one or two leaves from the mid-portion of new growth. No more than 10 trees should be used for each sample. Collect a total of 80 to 100 leaves.
| Analysis | Tissue Concentration Guidelines | ||||||||
| Low/Marginal Range | Sufficiency Range | Excessive, toxic? | |||||||
| Nitrogen, % N | 1.65 | - | 1.80 | 1.80 | - | 2.2 | |||
| Phosphorus, %P | 0.13 | - | 0.15 | 0.15 | - | 0.4 | |||
| Potassium, % K | 1.20 | - | 1.30 | 1.30 | - | 2.2 | |||
| Calcium, % Ca | 0.80 | - | 1.00 | 1.00 | - | 1.8 | |||
| Magnesium, % Mg | 0.20 | - | 0.25 | 0.25 | - | 0.5 | |||
| Sulfur, % S | 0.12 | - | 0.14 | 0.14 | - | 0.18 | |||
| Zinc, ppm Zn | 25 | - | 30 | 30 | - | 80 | >200 | ||
| Iron, ppm Fe | 25 | - | 50 | 50 | - | 400 | |||
| Manganese, ppm Mn | 25 | - | 30 | 30 | - | 200 | >500 | ||
| Copper ppm Cu | 5 | - | 7 | 7 | - | 20 | >200 | ||
| Boron, ppm B | 25 | - | 30 | 30 | - | 60 | >150 | ||
| Nitrogen-to-sulfur ratio (N:S) | 15 | - | 18 | 12 | - | 15 | |||
| Sodium, % Na | 0.05 | - | 0.5 | ||||||
| Chloride, % Cl | 0.05 | - | 0.2 | 0.50 | - | 2.00 | |||
¶ Figure C.
Note: Leaf analysis can be a reliable indicator of a tree's nutrient status and used to diagnose problems occurring during the growing season. It is also useful to differentiate between nutritional problems and disease symptoms.
These plant analysis interpretations are developed from data collected across a wide range of conditions. Plant tissue levels can vary between varieties or be affected by conditions that affect nutrient uptake, Low nutrient levels may be due to deficiency or to dilution by intensive growth. High or excessive nutrient levels may be a sign of restricted growth allowing nutrients to accumulate in the plant tissue. Nutrient imbalance may be secondary to the primary problem.
Collecting "paired" samples (e.g.,"good" vs. "bad") greatly improves the diagnostic value of plant analysis. Paired sampling also allows comparison of the nutrient status of healthy trees to abnormal ones in situations outside the normal sampling routine.