⇦ Back to Soil Fertility and Plant Nutrition Home
¶ Alfalfa (Medicago sativa)
| Table No: | Growth stage: | Plant part: |
| Table A | Vegetative stage (early growth to pre-bud) | Whole stems |
| Table B | Bud to 1/10th bloom (early bloom) | Whole stems |
| Table C | Bud to 1/10th bloom (early bloom) | Top 6-inches |
| Table D | Full-bloom or late-bloom stage | Whole stems |
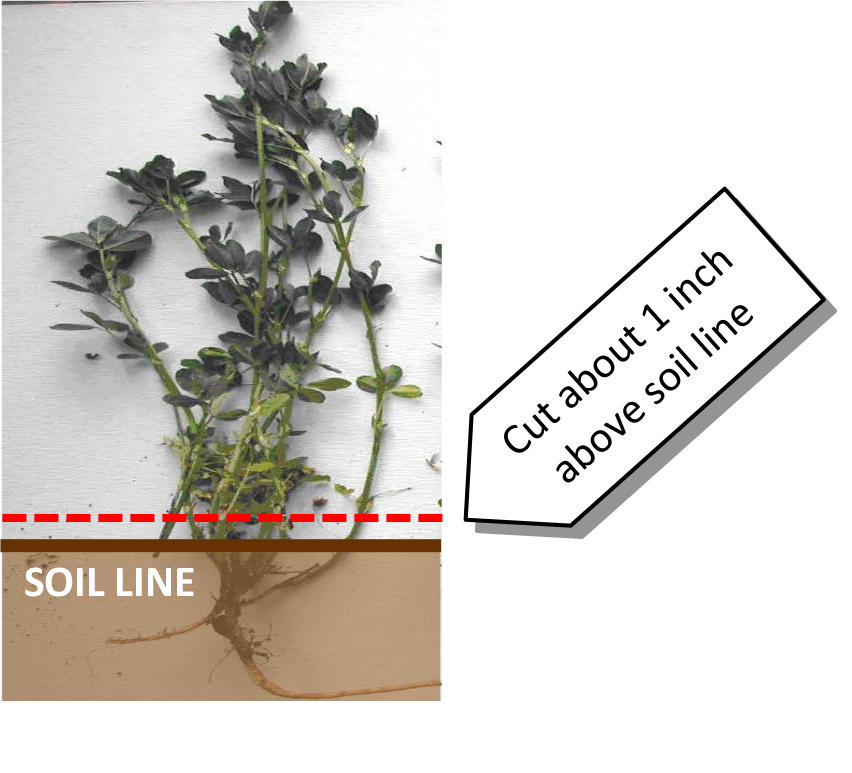
¶ A: Vegetative stage (early growth to pre-bud)
Plant Part: Whole stems
Sampling Procedure: Collect 25 to 35 whole stems, from 15 to 20 different crowns. Cut off about an inch above ground level. Pack loosely in paper bag. For determing hay quality the sample should be cut at swathing height. Core samples from baled hay may also be submitted for plant tissue analysis.
| Analysis | Tissue Concentration Guidelines | ||||||||
| Low/Marginal Range | Sufficiency Range | Excessive, toxic? | |||||||
| Nitrogen, % N | 3.50 | - | 3.90 | 3.90 | - | 4.70 | |||
| Phosphorus, %P | 0.20 | - | 0.25 | 0.25 | - | 0.70 | |||
| Potassium, % K | 2.00 | - | 2.35 | 2.35 | - | 3.20 | > 4.50* | ||
| Calcium, % Ca | 0.60 | - | 1.00 | 1.00 | - | 3.00 | |||
| Magnesium, % Mg | 0.25 | - | 0.30 | 0.30 | - | 1.00 | |||
| Sulfur, % S | 0.20 | - | 0.30 | 0.30 | - | 0.50 | |||
| Zinc, ppm Zn | 15 | - | 20 | 20 | - | 70 | |||
| Iron, ppm Fe | 30 | - | 50 | 50 | - | 200 | |||
| Manganese, ppm Mn | 20 | - | 30 | 30 | - | 150 | |||
| Copper ppm Cu | 6 | - | 10 | 10 | - | 30 | |||
| Boron, ppm B | 20 | - | 30 | 30 | - | 50 | > 200 | ||
| Nitrogen-to-sulfur ratio (N:S) | - | 10 | - | 15 | |||||
| Sodium, % Na | - | - | 0.20 | - | 0.05? | ||||
| Chloride, % Cl | - | - | 0.30 | - | 1.00? | ||||
*Excess potassium may cause animal health problems, especially if magnesium concentration is low.
¶ Figure A.
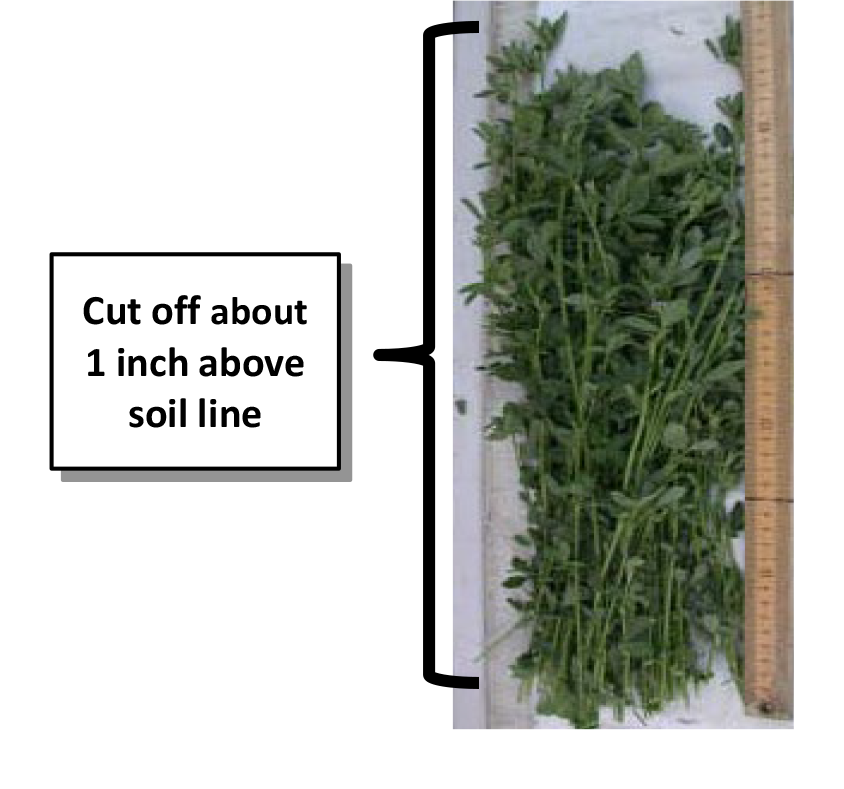
¶ B: Bud to 1/10th bloom (early bloom)
Plant Part: Whole stems
Sampling Procedure: Collect 25 to 35 whole stems, from 15 to 20 different crowns. Cut off about an inch above ground level. Pack loosely in paper bag. For determing hay quality the sample should be cut at swathing height. Core samples from baled hay may also be submitted for plant tissue analysis.
| Analysis | Tissue Concentration Guidelines | ||||||||
| Low/Marginal Range | Sufficiency Range | Excessive, toxic? | |||||||
| Nitrogen, % N | 3.20 | - | 3.50 | 3.50 | - | 4.30 | |||
| Phosphorus, %P | 0.20 | - | 0.25 | 0.25 | - | 0.70 | |||
| Potassium, % K | 1.80 | - | 2.00 | 2.00 | - | 2.50 | > 3.50* | ||
| Calcium, % Ca | 0.60 | - | 1.00 | 1.00 | - | 3.00 | |||
| Magnesium, % Mg | 0.25 | - | 0.30 | 0.30 | - | 1.00 | |||
| Sulfur, % S | 0.20 | - | 0.25 | 0.25 | - | 0.45 | |||
| Zinc, ppm Zn | 10 | - | 15 | 15 | - | 50 | |||
| Iron, ppm Fe | 30 | - | 50 | 50 | - | 200 | |||
| Manganese, ppm Mn | 20 | - | 30 | 30 | - | 150 | |||
| Copper ppm Cu | 6 | - | 10 | 10 | - | 30 | |||
| Boron, ppm B | 20 | - | 25 | 25 | - | 50 | > 200 | ||
| Nitrogen-to-sulfur ratio (N:S) | - | 10 | - | 15 | |||||
| Sodium, % Na | - | - | 0.20 | - | 0.05? | ||||
| Chloride, % Cl | - | - | 0.30 | - | 1.00? | ||||
*Excess potassium may cause animal health problems, especially if magnesium concentration is low.
¶ Figure B.
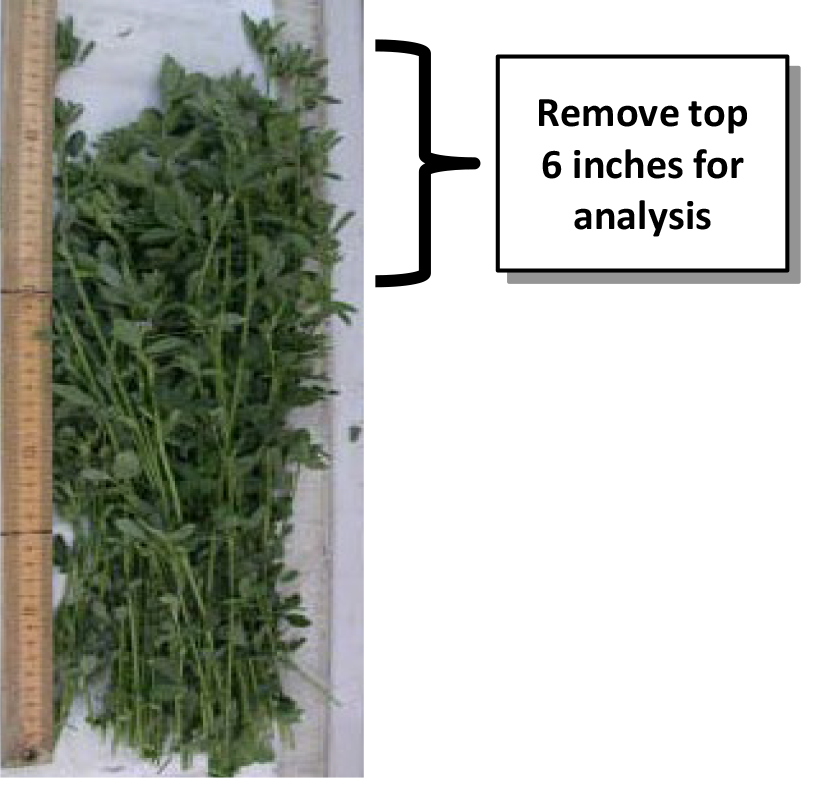
¶ C: Bud to 1/10th bloom (early bloom)
Plant Part: Top 6-inches
Sampling Procedure: Collect samples from 15 to 20 different crowns. Cut off to top 6 inches of the stem. Pack 30 to 40 of the 6-inch stem portions loosely in paper bag. Do not use plastic bags. Ship to laboratory as quickly as feasible.
| Analysis | Tissue Concentration Guidelines | ||||||||
| Low/Marginal Range | Sufficiency Range | Excessive, toxic? | |||||||
| Nitrogen, % N | 4.20 | - | 4.50 | 4.50 | - | 5.30 | |||
| Phosphorus, %P | 0.25 | - | 0.30 | 0.30 | - | 0.70 | |||
| Potassium, % K | 1.90 | - | 2.30 | 2.30 | - | 3.50 | > 4.50* | ||
| Calcium, % Ca | 0.60 | - | 1.00 | 1.00 | - | 3.00 | |||
| Magnesium, % Mg | 0.25 | - | 0.30 | 0.30 | - | 1.00 | |||
| Sulfur, % S | 0.25 | - | 0.30 | 0.30 | - | 0.55 | |||
| Zinc, ppm Zn | 10 | - | 15 | - | |||||
| Iron, ppm Fe | 10 | - | 15 | 15 | - | 50 | |||
| Manganese, ppm Mn | 30 | - | 50 | 50 | - | 200 | |||
| Copper ppm Cu | 20 | - | 30 | 30 | - | 150 | |||
| Boron, ppm B | 6 | - | 10 | 10 | - | 30 | > 200 | ||
| Nitrogen-to-sulfur ratio (N:S) | 20 | - | 25 | 25 | - | 50 | |||
| Sodium, % Na | - | - | 0.20 | - | 0.05? | ||||
| Chloride, % Cl | - | - | 0.30 | - | 1.00? | ||||
¶ Figure C.
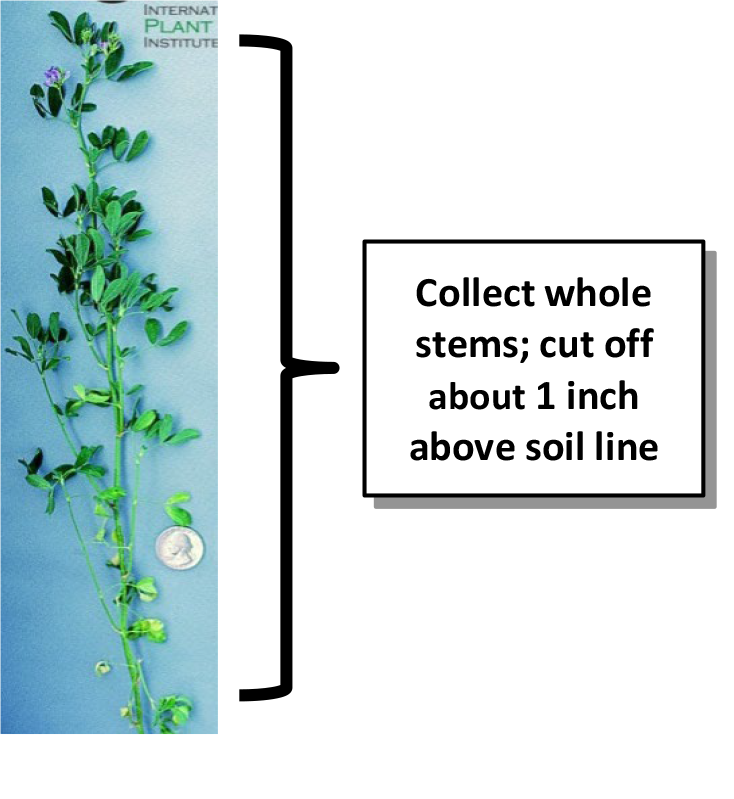
¶ D: Full-bloom or late-bloom stage
Plant Part: Whole stems
Sampling Procedure: Collect 25 to 35 whole stems, from 15 to 20 different crowns. Cut off the stems at ground level. Pack them loosely in paper bag. For determing hay quality the sample should be cut at the expected swathing height. Core samples from baled hay may also be submitted for plant tissue analysis.
| Analysis | Tissue Concentration Guidelines | ||||||||
| Low/Marginal Range | Sufficiency Range | Excessive, toxic? | |||||||
| Nitrogen, % N | 2.20 | - | 2.50 | 2.50 | - | 3.50 | |||
| Phosphorus, %P | 0.20 | - | 0.25 | 0.25 | - | 0.70 | |||
| Potassium, % K | 1.20 | - | 1.45 | 1.45 | - | 2.50 | > 3.50* | ||
| Calcium, % Ca | 0.60 | - | 1.00 | 1.00 | - | 3.00 | |||
| Magnesium, % Mg | 0.25 | - | 0.30 | 0.30 | - | 1.00 | |||
| Sulfur, % S | 0.15 | - | 0.20 | 0.20 | - | 0.40 | |||
| Zinc, ppm Zn | 10 | - | 15 | 15 | - | 50 | |||
| Iron, ppm Fe | 30 | - | 50 | 50 | - | 200 | |||
| Manganese, ppm Mn | 20 | - | 30 | 30 | - | 150 | |||
| Copper ppm Cu | 6 | - | 10 | 10 | - | 30 | |||
| Boron, ppm B | 20 | - | 25 | 25 | - | 50 | > 200 | ||
| Nitrogen-to-sulfur ratio (N:S) | - | 10 | - | 15 | |||||
| Sodium, % Na | - | - | 0.20 | - | 0.05? | ||||
| Chloride, % Cl | - | - | 0.30 | - | 1.00? | ||||
¶ Figure D.
Note: Interpretations are based the relationship between nutrient levels in a particular part of a "standard" tissue in a specific time in the growing season. These plant tissue ranges and interpretations are not considered valid with plant parts or growth stages other than those specified. These interpretations are developed from data collected across a wide range of crop, soil, and climate conditions.
Results from a single sample may be affected by time of day, climatic conditions, plant stress, age, or disease, that are not directly related to fertility status. Nutrient concentrations are not uniform throughout the plant and may change as the tissue matures.Tissue analysis trends should be evaluated by variety, growing season, and yield/quality goals. Collecting plant samples from the same location as soil samples allows comparison of soil nutrient availability with plant nutrient status.Low nutrient levels may be due to deficiency or to dilution by intensive growth. High or excessive nutrient levels may be a sign of restricted growth allowing nutrients to accumulate in the plant tissue. Nutrient imbalance may be secondary to the primary problem.