⇦ Back to Soil Fertility and Plant Nutrition Home
¶ Introduction
This Crop File presents the assumptions used in two different approaches for interpreting plant tissue analysis results. Sufficiency ranges are obtained from publicly available sources. This approach assumes that if an essential nutrient falls below or above the sufficiency range, that particular nutrient is potentially affecting plant growth and that corrective action may be needed. Although the ranges are presented as specific values, there are no exact break points between sufficiency, deficiency, and/or toxicity. These ranges are usually based on data from a limited number of research studies, so should not be considered comprehensive or conclusive. Analytical results are helpful to diagnose plant health, but any corrective action should depend on conditions specific to that site.
¶ Nutrient concentration (as % or ppm)
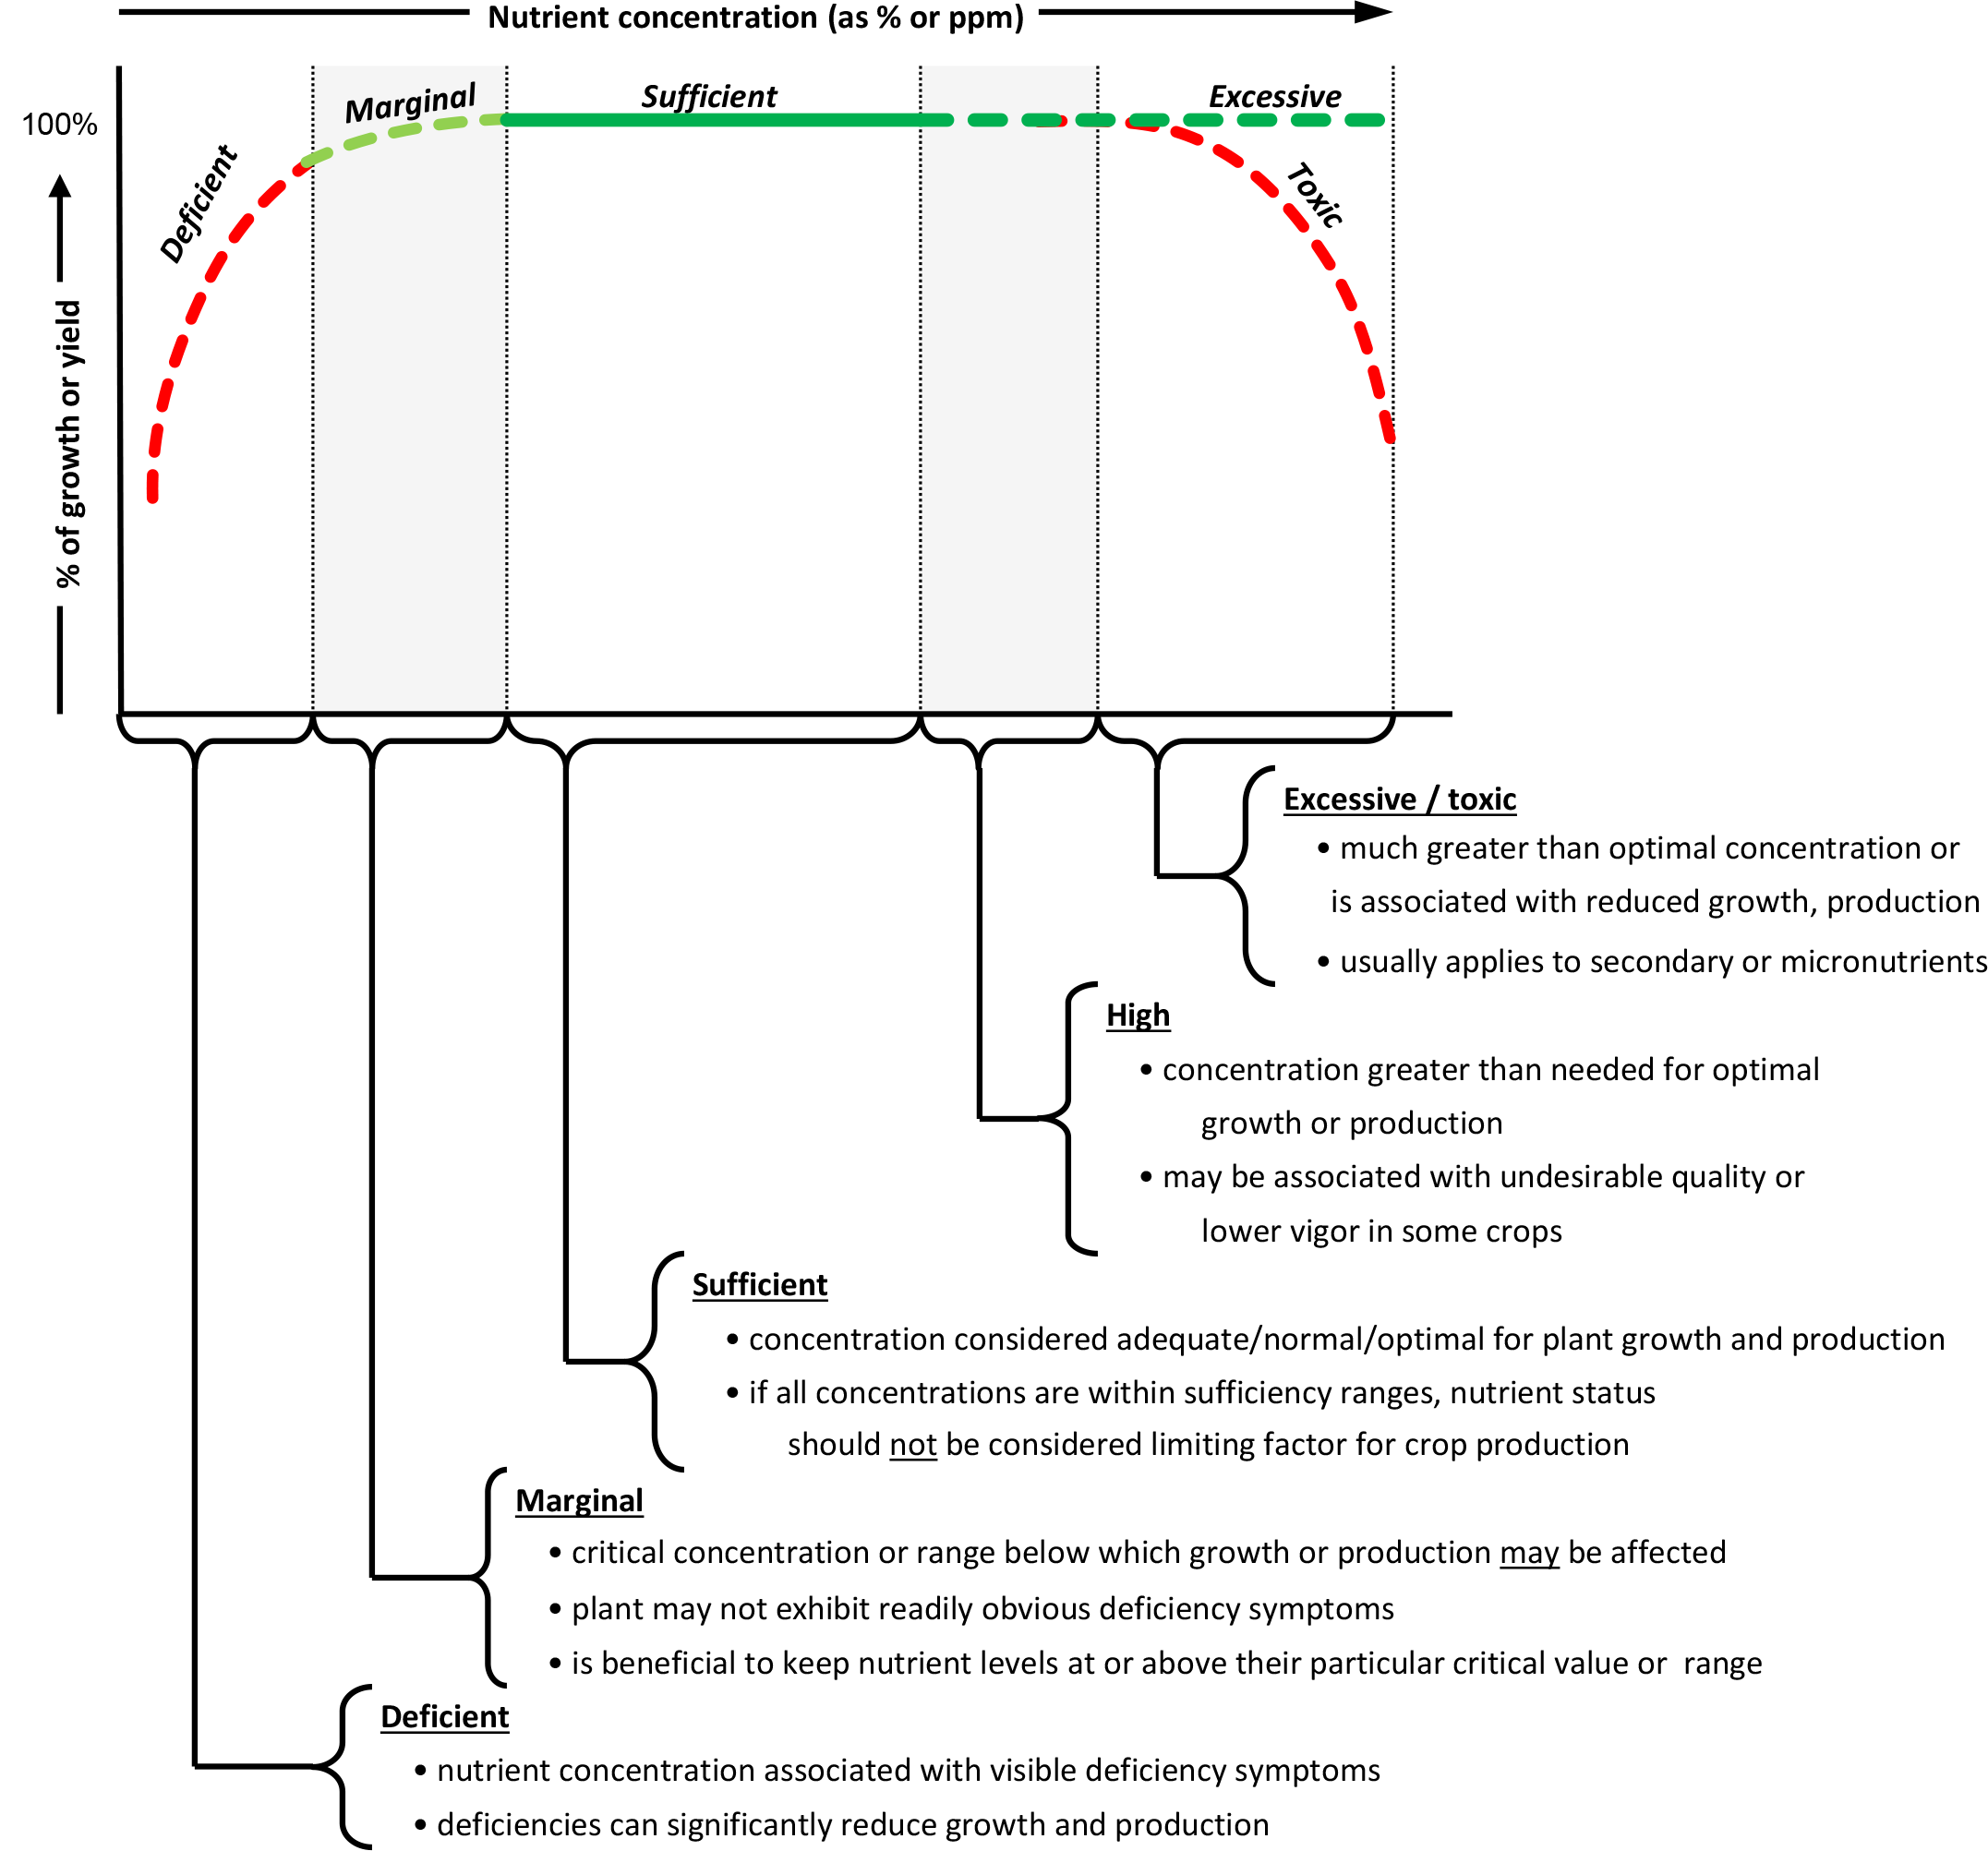
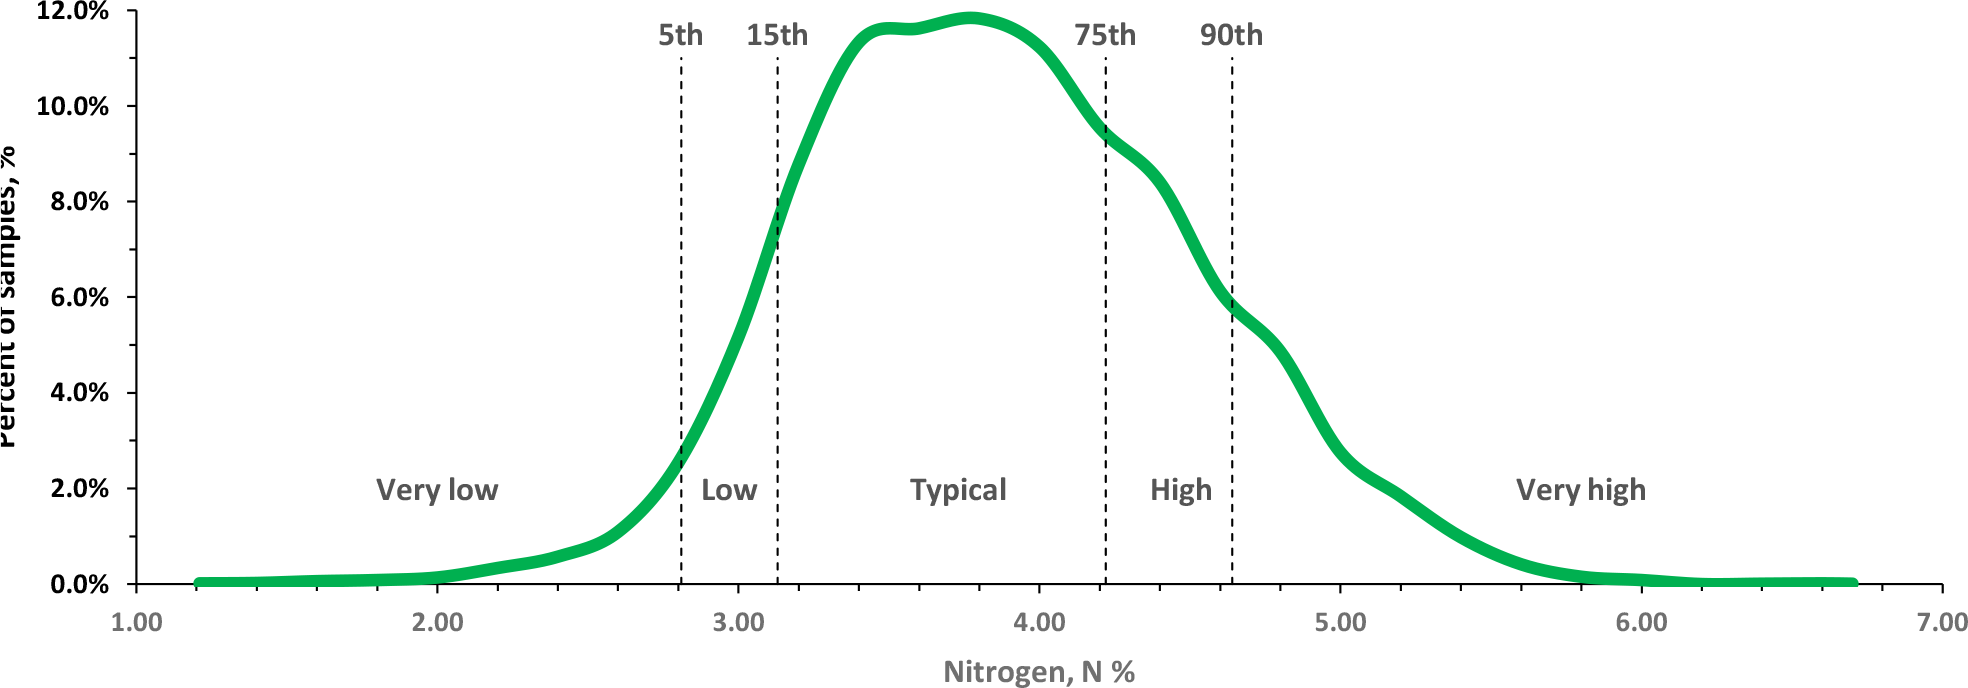
Survey ranges were obtained by evaluating a group of plant tissue results analyzed by ServiTech Laboratories. This approach assumes that sample results in the "Typical" range generally correspond to the "Sufficiency" range, that "Very low" corresponds to the "Deficiency" range, that "Low" corresponds to the "Marginal" range, and that "Very high" potentially corresponds to the "Excessive" or "Toxic" range. The sample results included in the survey were collected over several years, representing a wide range of growing conditions, but the yields that correspond to the sample results are not available. The ranges are best used to compare a current set of results to a larger population. They are helpful for diagnosing plant health, but any corrective action should depend on site specific conditions. The following two graphs illustrate how the survey ranges are developed from the plant analysis results data. Results for each nutrient and each growth stage are sorted from smallest to largest. Each range is based on percentiles and represents a fraction of the total survey population. The "Very low" range represents the lowest 5% of the sample results (1st to 5th percentile). The "Low" range is between the 5th and 15th percentiles (or 10% of the total samples). The "Typical" range represents the middle 60% of the samples, from the 15th to 75th percentile. "High" range is the 75th to 90th percentile (15% of the total samples). "Very high" represents the uppermost 10% of the total samples.
The frequency distribution (Figure 1) shows how often a particular nitrogen concentration occurred in the sample survey. For example, about 1% of the samples had a nitrogen concentration of 2.400%, about 12% had a concentration of 3.80%, about 2% had a concentration of 5.20%. etc. The vertical lines show the respective percentile ranges.
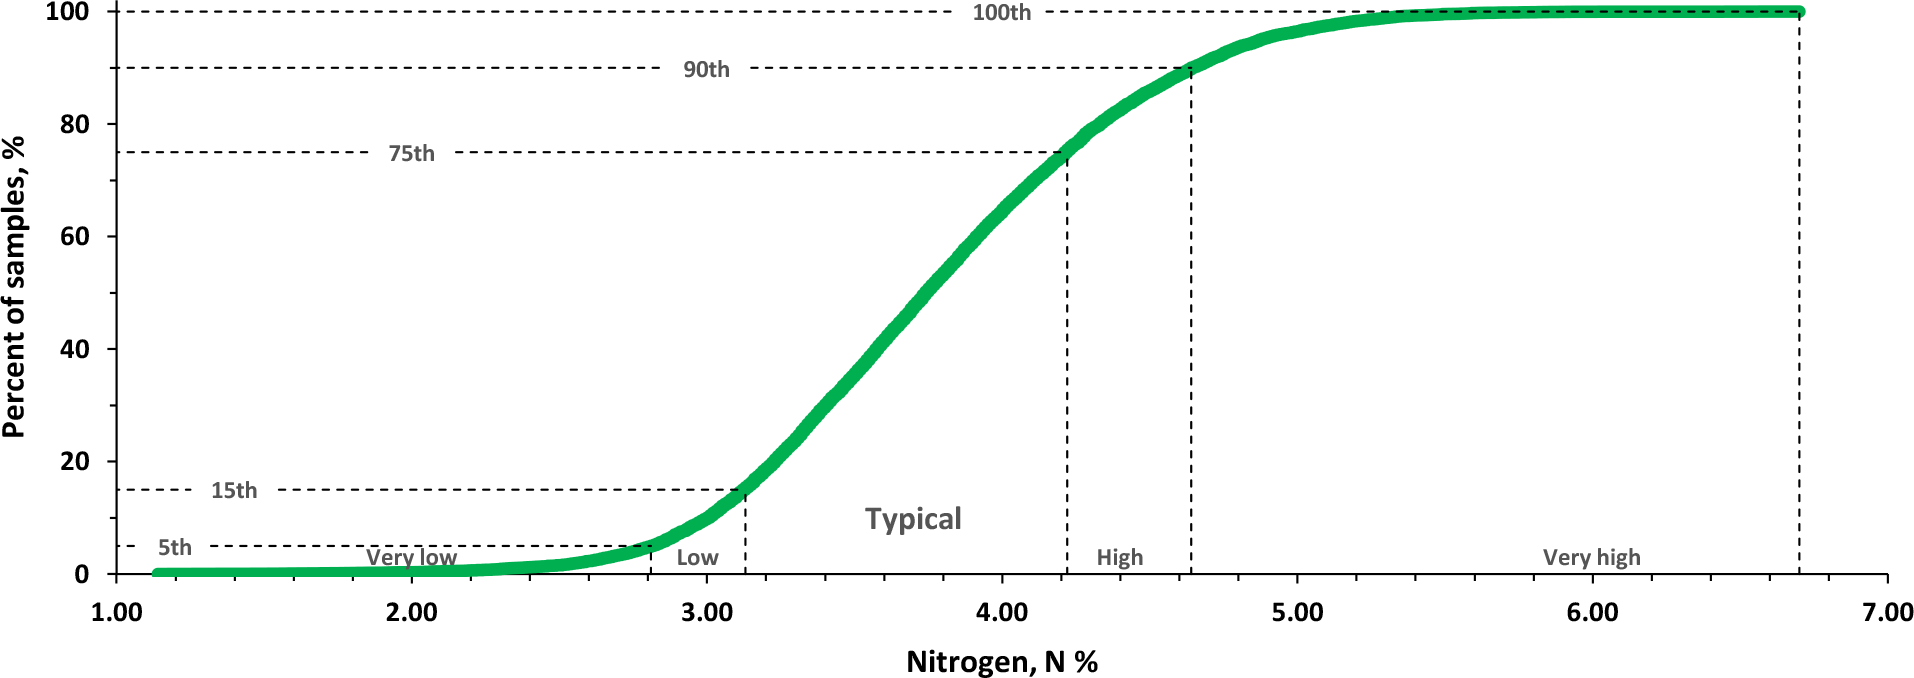
The cumulative frequency graph (Figure 2) uses the same data as the frequency distribution. The individual percentages (from smallest to largest) are added sequentially, giving the curve an "S" shape.
¶ Figure 1. Corn leaves, V6-V10 (frequency distribution)
¶ Figure 2. Corn leaves, V6-V10 (cumulative frequency)
¶ Table 1. Total N% Rating |
||
| Rating | Total N% | Percentiles |
| Very Low | < 2.80 | 1st to 5th |
| Low | 2.80–3.15 | 5th to 15th |
| Typical | 3.15–4.30 | 15th to 75th |
| High | 4.30–4.65 | 75th to 90th |
| VerhyHigh | > 4.65 | 90th to 100th |