⇦ Back to Soil Fertility and Plant Nutrition Home
¶ Introduction
“Base Cation Saturation Ratio (BCSR)” approach is an 80-yearold method of recommending fertilizer application rates by “balancing the cations”. This Crop File discusses the history and research findings related to the BCSR concept. Other Crop Files discuss basic concepts of cation exchange capacity (CEC) and base saturation.
¶ A. Summary
- Base saturation = [base cations ÷ total CEC] x 100
- Base cations = Ca2+, Mg2+, K+, and Na+
- Sum of base cations held on soil exchange sites divided by total CEC and expressed as percentage
- BCSR concept originally developed in 1930’s and 1940’s
- Based on small group of greenhouse pot studies in eastern U.S.
- Proposed that soil fertility and productivity are optimized when CEC has “balance” of base cations
- Specifies cation saturation percentages and ratios
- Makes no adjustment for soil test values, soil type, crop, or yield goal
- Large number of field research studies conducted in 1970’s and 1980’s
- No proven yield increases from maintaining ratios
- Often recommends excessive K, Ca, or Mg rates that do not improve yield
- e.g., calcium rarely recommended as nutrient, but often required to “balance” cation ratios
- Adjusting acid soil pH to range of 6.0 to 6.5 provides adequate calcium regardless of ratio
- “Balancing” may create other problems
- Using lime to reach “optimum” % Ca can elevate soil pH excessively and induce micronutrient deficiency
- Conclusions:
- No “ideal” ratio or range of ratios
- Ratios result in inconsistent results due to different soil CEC and/or base saturations (see Table 1)
- Results in wide range of soil test values, depending on CEC
- Soil test level may be deficient at “ideal” saturation
- e.g., 2% to 5% K saturation with 5 mEq/100g CEC is very low soil test (39 to 98 ppm K) typically considered potassium deficient
- Nutrient soil test results should b2e held at sufficient (but not excessive) levels rather than depend on ratios
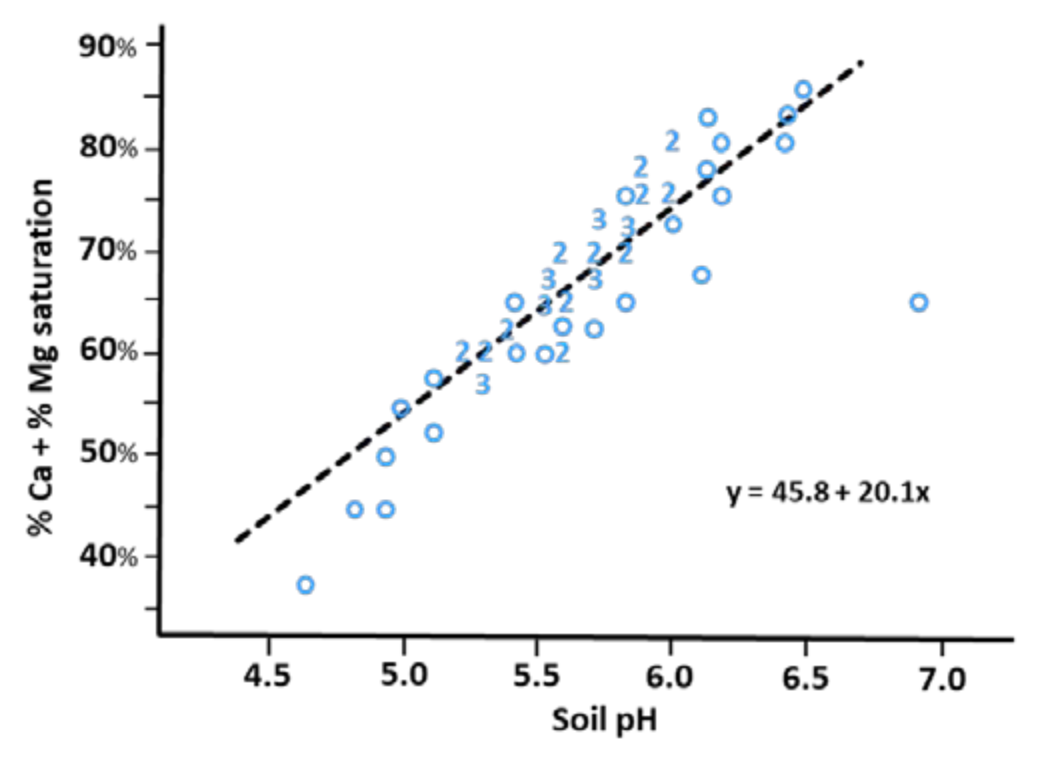
- Soil pH of 6.0 to 6.5 actually corresponds to “ideal” calcium-plus-magnesium ratio. (see Figure 1)
- BCSR concept advocated by some members of certain groups
- “Believers”
- Often guided by “Albrecht Principles”, published in 1958
- e.g., That using NPK “unbalances” soils, which depletes soil and crop nutritional quality
- e.g., Hybrids bred for high yields are less desirable than “heirloom” varieties
- Often guided by “Albrecht Principles”, published in 1958
- Lime dealers
- Creates perception of quality difference between calcitic and dolomitic lime sources
- Carbonate content and fineness govern lime quality, not calcium or magnesium content
- Gypsum dealers
- Gypsum is comparatively cheap source of soluble calcium
- “Believers”
¶ Table 1. Comparison of Soil Analysis Results at Different CEC Levels |
|||
|---|---|---|---|
| "Ideal Soil Saturation % (Albrecht, 1975) |
Cation Exchange Capacity, mEq/100g | ||
| 5 (sandy) |
15 (loamy) |
30 (clayey) |
|
| ----- soil result as “ppm” ----- | |||
| K ….. 2%–5% | 39–98 | 117–293 | 234–585 |
| Mg ….. 10%–20% | 60–120 | 180–360 | 360–720 |
| Ca ….. 60%–75% | 600–750 | 1800–2250 | 3600–4500 |
| Na ….. 0.5%–5% | 6–58 | 17–173 | 35–345 |
¶ Figure 1. Relationship Between Soil pH and Calcium Plus Magnesium Saturation (%Ca + %Mg)
¶ C. Development of “Ideal Soil” Concept
- Concept initiated in 1930’s1 and 1940’s by Bear.
- Based on greenhouse pot experiments using alfalfa with 20 New Jersey soils.
- Trying to suppress alfalfa uptake of expensive K fertilizer by using cheaper Ca fertilizers (e.g., lime).
- Proposed “ideal” cation ratios.
- Proposed that ideal soil should have:
- 65% Ca
- 10% Mg
- 5% K
- 20% H
- Proposed that cations should be in certain ratios:
- Ca/Mg ratio of 6.5/1
- Ca/K ratio of 13/1
- Ca/H ratio of 3.25/1
- Mg/K ratio of 2/1
- Ratios are calculated on a charge equivalent basis
- Proposed that ideal soil should have:
- Not clear how these ratios were established
- In theory, yields should increase in soils with low cation ratio up to optimum cation ratio, then decline as soil passes optimum ratio
- Optimum ratios do not change regardless of soil type, crop species, or yield goal
- Range of ratios were not originally specified
- Bear said there were likely to be ranges of cations that would still allow optimal crop growth
- Later research points out that maximum growth will occur across wide variety of cation ratios
- Albrecht greenhouse studies, University of Missouri
- Albrecht (1937, 1938) conducted greenhouse pot experiments
- Mixed clays with different mineral content at different proportions
- Investigated legume growth and N2 fixation
- Reported calcium saturation, but not soil pH
- Claimed that calcium saturation (% Ca) was more important than soil acidity level
- “… plants are not sensitive to, or limited by, a particular pH value of the soil …” (Albrecht, 1975)
- Theory holds that optimum crop growth would occur at “ideal, balanced” Ca saturation of 65%
- Examination of Albrecht’s original data showed:
- Legume nodulation was inhibited by soil acidity
- Nodulation only occurred when the pH was ≥ 5.5
- No nodulation occurred at pH 4.0, 4.5, or 5.0 at any calcium concentration
- Greatest fixation actually occurred at highest calcium saturation (88% Ca)
- Claimed that “ideal” soil should have
- 10% H
- 60% to 75%
- 10% to 20% Mg
- 2% to 5% K
- . 0.5% to 5.0% Na
- 5% other cations
- Albrecht (1937, 1938) conducted greenhouse pot experiments
- Concept further promoted in 1950’s2 at University of Missouri
- Graham (1959) modified ratios originally proposed by Bear
- Published range of saturations and ratios rather than single values
- Proposed that “ideal” and “balanced” soil should have
- 65 – 85% Ca
- b) 6 – 12% Mg
- c) 2 – 5% K
- “Permissible” range of ratios:
- a) Ca/Mg ratio of 5 to 14
- b) Mg/K ratio of 1.2 to 6.0
- Proposed that “ideal” and “balanced” soil should have
- Published range of saturations and ratios rather than single values
- Proposed ratios were not based on any field or laboratory research, only based on theory
- No explanation of why these soil test ratios were considered “balanced"
- Graham (1959) modified ratios originally proposed by Bear
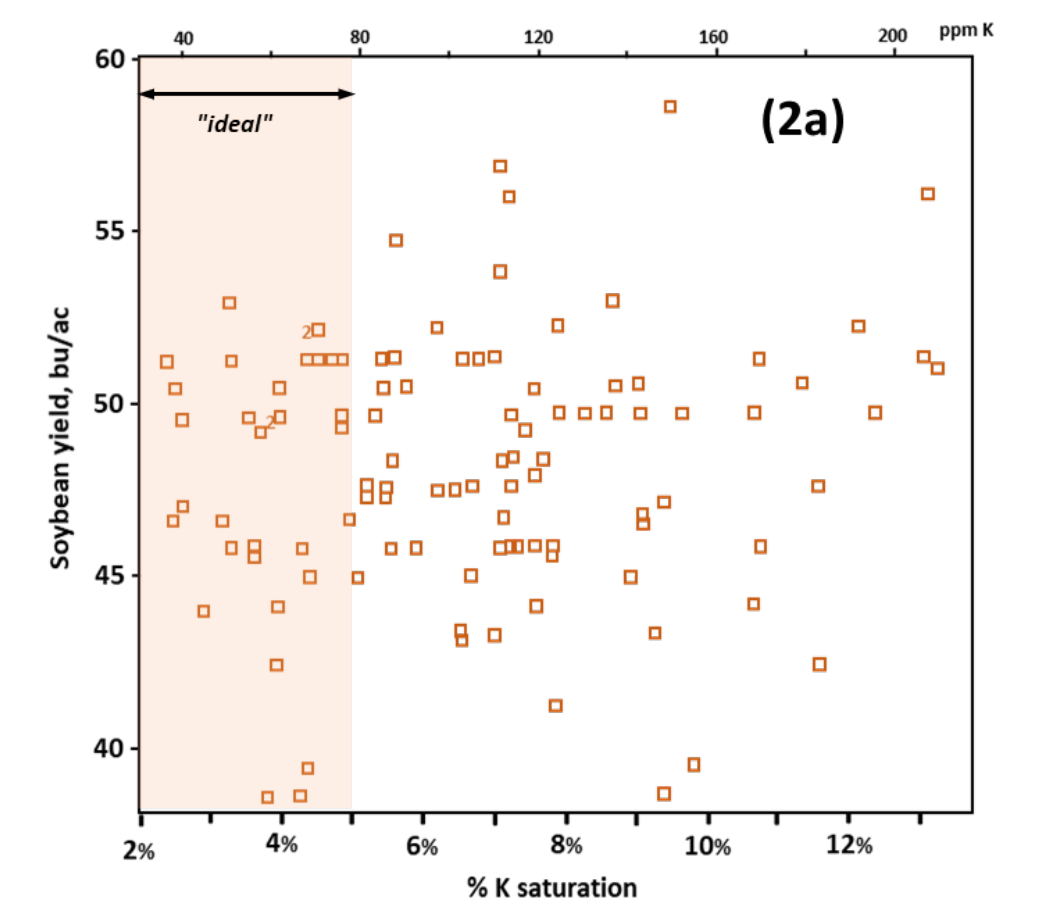
¶ Figure2a. Soybean Yields: as affected by Potassium Saturation, %K
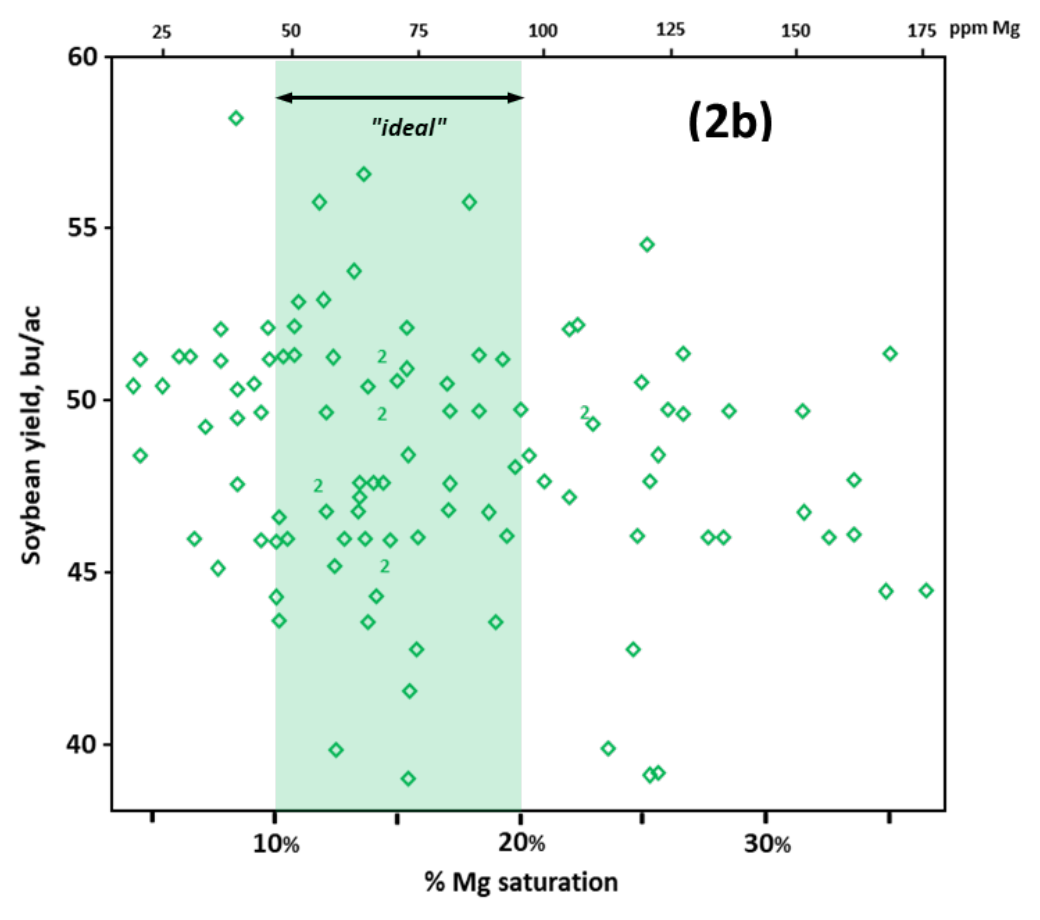
¶ Figure 2b. Soybean Yields: as Affected by Magnesium Saturation, %Mg
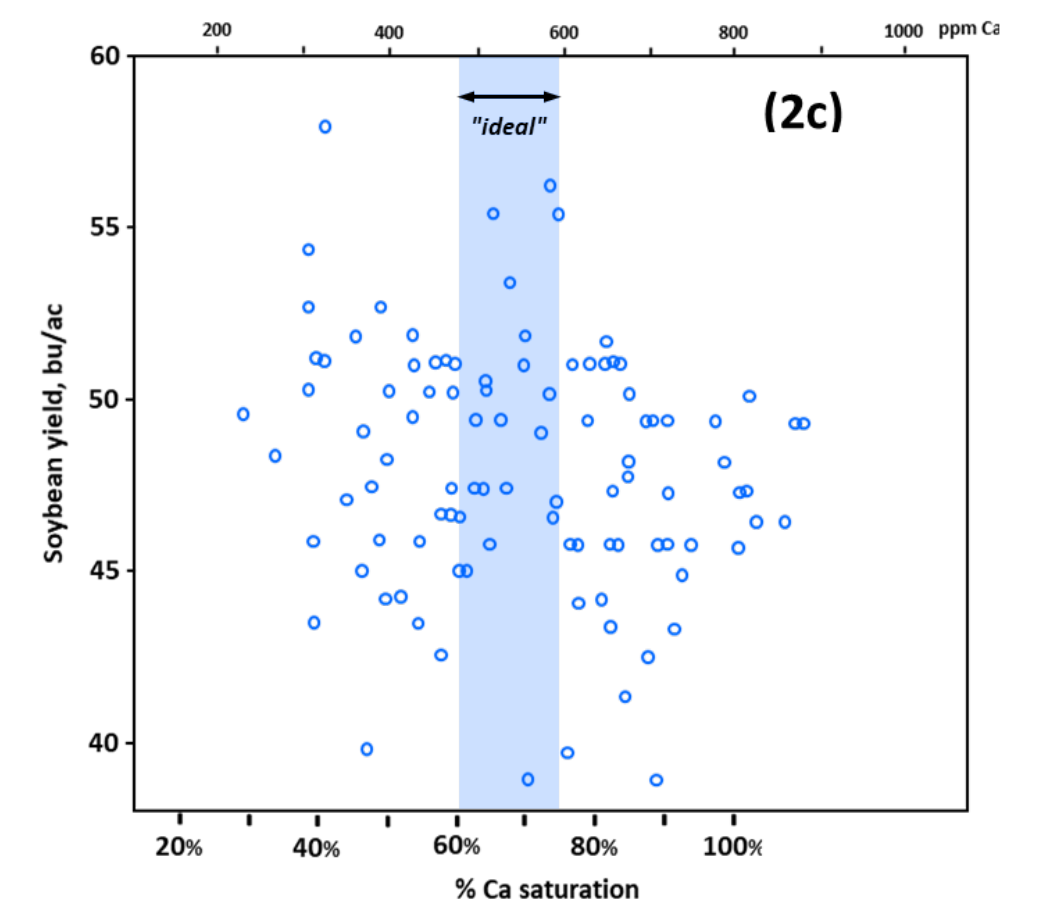
¶ Figure 2c. Soybean Yields: as Affected by Calcium Saturation, %Ca
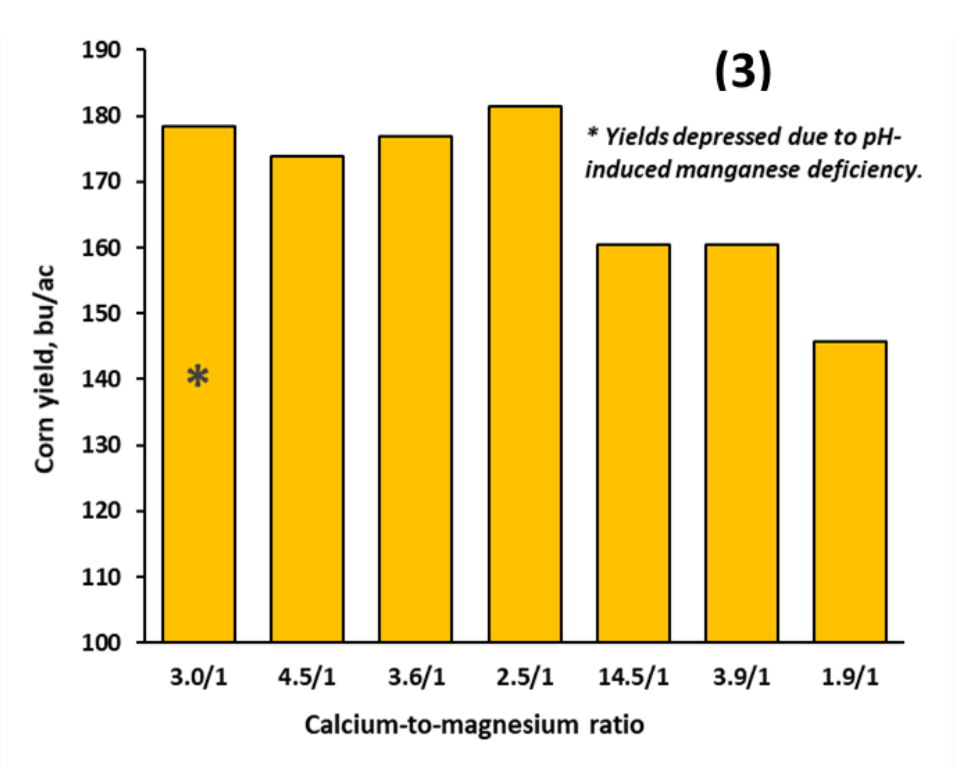
¶ Figure 3. Corn Yields as Affected by Ca/Mg Ratio
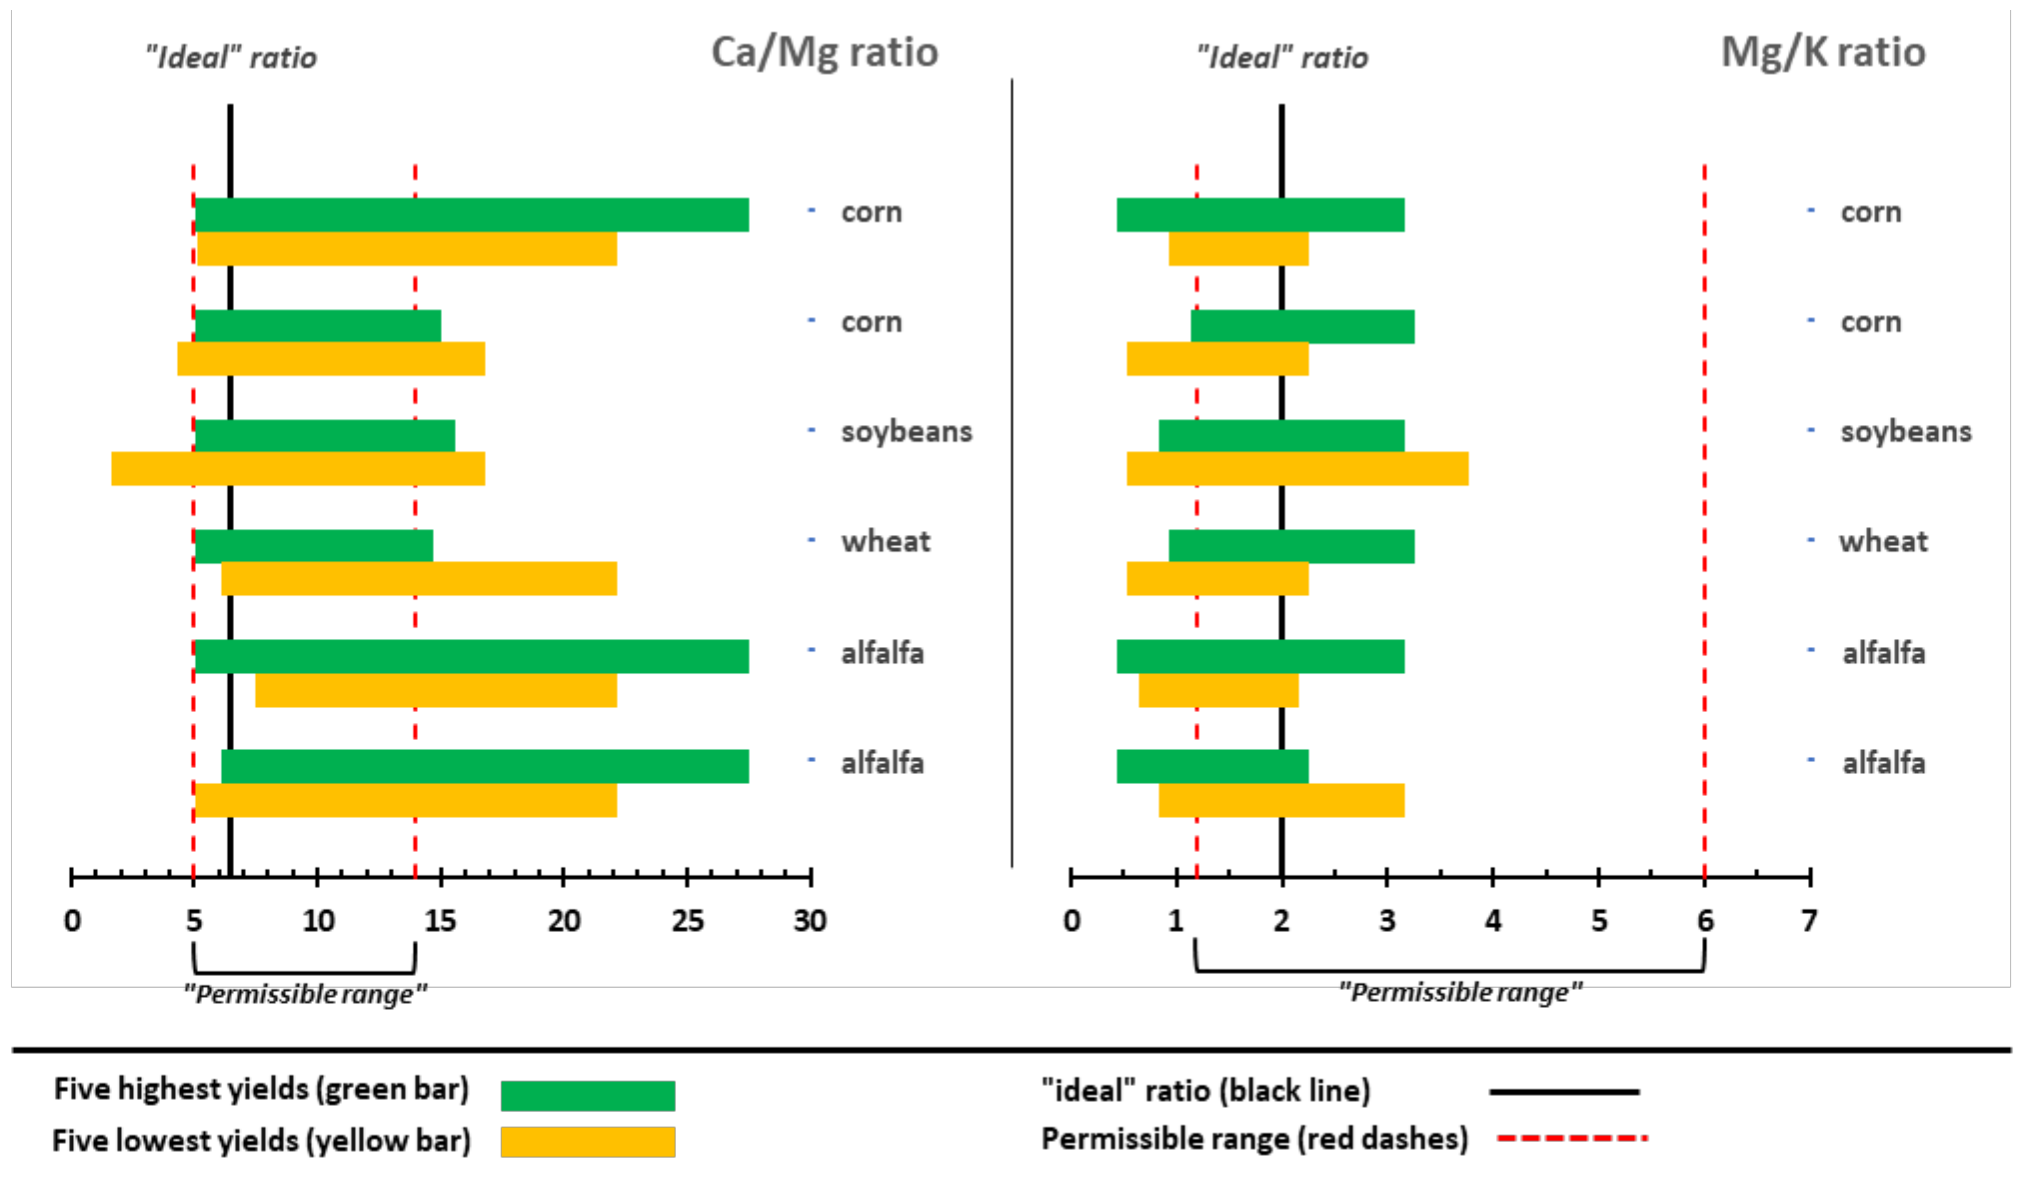
¶ Figure 4. Cation Saturation Ratio Ranges for Five Highest and Five Lowest Yields
¶ D. Delaware field study (Leibhardt, 1981)
- Field survey found soybean yields not affected by K, Mg, and Ca saturation
- 65 fields sampled
- 59 were center-pivot irrigated
- 7 were irrigated with traveler systems
- Yields were not affected by potassium saturations ranging from 2% to 14% K (see Figure 2a)
- 2% to 5% K assumed range for “ideal” soil
- Yields were not affected by magnesium saturations from 4% to 37% Mg (see Figure 2b)
- 10% to 20% Mg assumed range for “ideal” soil
- Yields were not affected by calcium saturations from 30% to 100% Ca (see Figure 2c)
- 60% to 75% Ca assumed range for “ideal” soil
- Ca saturation over 100% due to dissolution of ag lime by soil test extractant
- 65 fields sampled
- Five-year field study (1971-1976) with 28 treatments
- Three lime rates, three lime sources, three potash rates
- Lime rates: 0, 1, 4 tons per acre
- Lime sources: calcitic lime, dolomitic lime source, 50:50 mixture
- Kallmia sandy loam soil, pH 5.7
- Corn, soybean production
- Three lime rates, three lime sources, three potash rates
- Increasing potassium saturation did not increase corn yields
- Potassium rates: 0, 60, 120 lb K2O/ac
- Saturations ranged from 2.3% to 13% K
- Ca-to-Mg ratios or saturations did not have direct effect on corn yield
- All Ca/Mg ratios were outside “permissible” range of 5/1 to 14/1 (see Figure 3)
- Manganese deficiency in corn was induced by overliming
¶ Figure 5a. Effect of Variable Saturations on Plant Tissue Concentrations and Nutrient Sufficiency: Calcium
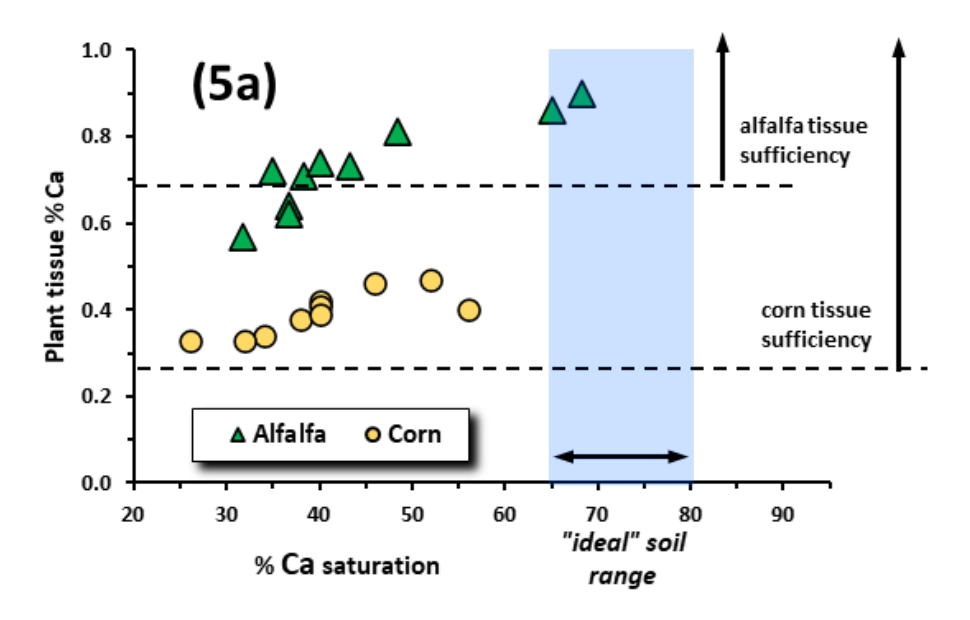
Concentrations and Nutrient Sufficiency: Calcium
¶ Figure 5b. Effect of Variable Saturations on Plant Tissue Concentrations and Nutrient Sufficiency: Magnesium
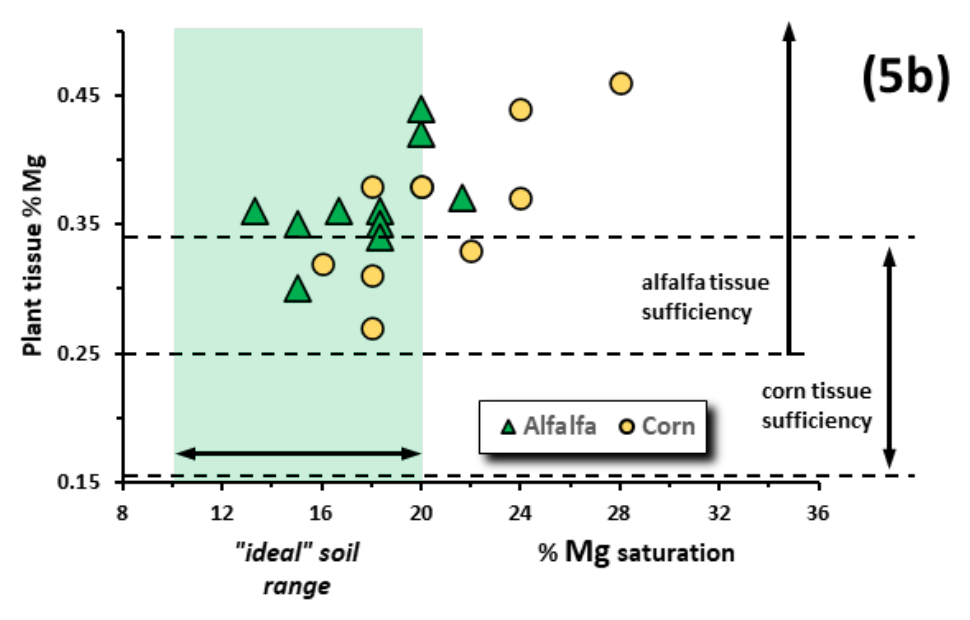
Concentrations and Nutrient Sufficiency: Magnesium
¶ E. Ohio State field Experiment (McLean, 1983)
- Six-year study (1975-80) with 18 treatments
- pH adjusted to 5.0, 6.0, and 6.5
- 4%, 6%, and 10% Mg saturation
- 2.4% and 4.3% K saturation
- Loudenville silt loam, pH = 4.1, CEC = 14.2
- corn-corn-soybeans-wheat -alfalfa-alfalfa
- Yields not related to Ca/K nor to Mg/K ratios
- According to theory, yields should be highest within ratios and lowest when outside of ratios
- Highest and lowest yields showed no consistent effect due to saturation ratios (see Figure 4)
- Only consistent treatment that improved yields was effect of lime that raised soil pH from 5.0 to 6.0
¶ F. Wisconsin Study (Simson, 1979)
- Wide range of Ca or Mg saturations did not affect alfalfa yields
- Ca/Mg ratios adjusted using gypsum (CaSO4) or Epsom salt (MgSO4)
- 0 to 1800 lb/ac calcium ii. 0 to 1700 lb/ac magnesium
- Theresa silt loam, 6.8 pH, 12.2 CEC
- Soil test: 820 to 1520 ppm Ca, 190 to 372 ppm Mg ii. Soil test: 34% to 62% Ca, 12% to 35% Mg
- Plainfield loamy sand, 6.8 pH, 6.0 CEC
- Soil test: 475 to 1025 ppm Ca, 120 to 195 ppm Mg ii. Soil test: 32% to 68% Ca, 15% to 20% Mg
- Soil cation saturation had little to limited effect on plant tissue composition.
- Plant tissue concentrations tended to increase as soil Ca and Mg saturations increased
- Tissue concentrations were inconsistent, not directly related to soil saturation
- Plant tissue Ca and Mg concentrations were at or above nutrient sufficiency levels (see Figure 5a and 5b)
- Plant tissue concentrations tended to increase as soil Ca and Mg saturations increased
- Ca/Mg ratios adjusted using gypsum (CaSO4) or Epsom salt (MgSO4)
¶ G. Nebraska Lab Comparison Study (Olson, 1982)
- Compared fertilizer recommendation approaches
- Five laboratories: 4 commercial labs & Univ. of Nebr
- 8 years at one location; 7 years at three other locations
- Compared yields from zero fertilizer treatment to rates recommended by each laboratory
- Average corn yields at 3 irrigated sites ranged from about 160 to 190 bu/ac
- Yields in unfertilized check ranged from about 70 to 110 bu/ac. ii. Yields at non-irrigated site averaged about 100 bu/ac
- Use of BCSR approach increased fertilizer costs, but did not improve yields over sufficiency approach.
- “The 29 field comparisons revealed no real yield differences despite wide variation in number, rate, and cost of nutrients applied.”
- Fertilizing to “balance the cations” did not improve yields.
- “These Nebraska results make it quite clear that cation balance in soil is not an essential consideration in estimating crop nutrient needs …”.
- Cation ratios at study sites differed greatly from “ideal” ratios (see Table 2)
- Seven to eight years of balancing cations did not improve yields
¶ Table 2. Soil Test Results at Beginning of Nebraska Fertilizer Recommendation Study
|
||||||
|---|---|---|---|---|---|---|
| Soil Type at Location | Cation Ratios | Soil Data | ||||
| Ca/K | Ca/Mg | Mg/K | pH | K ppm | P ppm* | |
| Sharpsburg | 13.1 | 3.1 | 4.2 | 7.0 | 267 | 10.0 |
| Cozad | 8.0 | 4.2 | 1.9 | 7.1 | 417 | 21.0 |
| Hastings | 10.5 | 4.8 | 2.2 | 6.3 | 467 | 21.0 |
| Moody | 16.0 | 2.6 | 6.0 | 6.1 | 307 | 18.0 |
| “Ideal” Soil | 13.0 | 6.5 | 1.9 | --- | --- | --- |
| *Bray-P | ||||||
¶ H. Limitations of Using “Ideal” Potassium Saturation
- BCSR method requires adjusting soil test to “ideal” cation percentage.
- Potassium soil test concentration (K ppm) used in CEC calculation (mEq/100g).
- Target soil test, K ppm = CEC x (desired K% ÷ 100) x 390.
- Table 3 shows soil test potassium levels required for 2% or 5% K saturations in soil sample at listed cation exchange capacities.
- Example: Soil with CEC of 20 would require adjusting soil test to 156 ppm K for 2% K saturation and to 390 ppm K for 5% K saturation
- Iowa State field calibration trials (see Figure 6a)
- Six-year study; 200 site-years for corn; 162 site-years for soybeans
- Data points are corn yield responses from individual field sites at different soil test potassium levels.
- Crop response shown as “Relative corn yield”
- “Relative yield” is percentage of zero fertilizer treatment (check plot) as fraction of maximum yield at individual site
- Allows comparison between diverse sites
- Removes effect of variable annual weather conditions and of sites with different productivity potentials
- Solid line is calibration curve based on statistical analysis of data points
- Calibration study data is used to develop soil test interpretations and fertilizer recommendations
- Calibration curve represents expected yield at particular soil test level if no fertilizer nutrients are applied
- Example: At soil test of 100 ppm K, about 90% of potential yield is expected if no potassium is applied
- Curve is used to identify categories of expected response to fertilizer applications
- Response categories (see Figure 6a)
- Vertical dashed lines represent Iowa State categories of expected response to fertilizer potassium applications for corn
- Optimum: soil potassium adequate for crop yield; yield response expected in 1 of 4 fertilizer applications
- Suggest maintaining soil test level in Optimum category over time for long-term profitable crop production
- Fertilizer rates equivalent to crop removal are recommended for long-term maintenance
- Very low: potassium deficiency very likely; yield response expected in 4 of 5 potash applications
- Low: yield response expected in 2 of 3 potash applications
- High: yield response expected in 1 of 20 potash applications
- Very high: yield response expected in 1 of 100 potash applications
- Using “ideal” saturation percentages may result in underfertilization or in over-fertilization
- Objective of BCSR method is to “balance” soil.
- “Ideal” soil has 2% to 5% K saturation.
- Objective is managing fertilizer applications to achieve soil test within “ideal” range regardless of soil characteristics or crop to be grown
- Arrows in Figures 6b and 6c represent points along calibration curve corresponding to potassium soil test at given CEC as given in Table 3
- “Ideal” 2% K with CEC of 15 or lower: soil test K is in “Very low” to “Low” category (see Figure 6b)
- BCSR approach: soil is at “ideal” saturation, no fertilizer recommended
- Sufficiency approach: yield expected to be substantially lower than potential if no fertilizer is applied
- “Ideal” 2% K with CEC of 25 or higher: soil test K is in “High” to “Very high” category (see Figure 6b)
- BCSR approach: potassium fertilizer applications are recommended to build soil test and to reach “ideal” saturation
- Sufficiency approach: soil expected to supply potassium at or beyond crop requirement; yield response not expected if fertilizer is applied
- “Ideal” 5% K with CEC of 5 to 7 or lower: soil test K is in “Very low” to “Low” category (see Figure. 6c)
- BCSR approach: soil is at “ideal” saturation, no fertilizer recommended
- Sufficiency approach: yield expected to be substantially lower than potential if no fertilizer is applied
- “Ideal” 5% K with CEC of 10 or higher: soil test K is in “High” to “Very high” category (see Figure 6c)
- BCSR approach: potassium fertilizer applications are recommended to build soil test and to reach “ideal” saturation
- Sufficiency approach: soil expected to supply potassium at or beyond crop requirement; yield response not expected if fertilizer is applied
¶ References
Albrecht, W.A. 1937. Physiology of root nodule bacteria in relation to fertility levels of the soil. Soil Sci. Soc. Am. Proc. 2:315–327.
Albrecht, W.A. 1939. Some soil factors in nitrogen fi xation by legumes. Trans. 3rd Commiss. of the Int. Soc. of Soil Sci., New Brunswick, NJ.
Albrecht, W.A. 1975. The Albrecht papers. Vol. 1: Foundation concepts. Acres USA, Kansas City.
Albrecht, W.A., and T.M. McCalla. 1938. The colloidal fraction of the soil as a cultural medium. Am. J. Bot. 25:403–407.
Albrecht, W.A., and G.E. Smith. 1941. Biological assays of soil fertility. Soil Sci. Soc. Am. Proc. 6:252–258.
Bear, F.E., A.L. Prince, and J.L. Malcolm. 1945. Potassium needs of New Jersey soils. Bull. 721. New Jersey Agric. Exp. Stn., New Brunswick.
Eckert, D. 2002. History of The Basic Cation Saturation Ratio Concept of Soil Test Interpretation. 2002 Amer. Soc. Agronomy Annual Meeting, Indianapolis IN. 11 Nov 2002.
Gaspar, A. 2019. Base Saturation and Cation Exchange Capacity. Crop Insights, Pioneer Agronomy Services. 5 pg.
Graham, E.R. 1959. An explanation of theory and methods of soil testing. Bull. 734. Missouri Agric. Exp. Stn., Columbia.
Liebhardt, W.C. 1981. The basic cation saturation concept and lime and potassium recommendations on Delaware’s Coastal Plain soils. Soil Sci. Soc. Amer. J. 45:544-549.
Mallarino, A., D. Wittry, P. Barbagelata. 2002. Iowa Soil-Test Field Calibration Research Update: Potassium and the Mehlich-3 ICP Phosphorus Test. Proc. of Ext.-Ind. Soil Fertility Conference. St. Louis, MO. http://www.agronext.iastate.edu/soilfertility/info/recmallpk02.pdf accessed 28Dec2020.
Mallarino, A., J. Sawyer, S. Barnhart. 2013. PM 1688: A General Guide for Crop Nutrient and Limestone Recommendations in Iowa. Iowa State Univ., Ames IA. Pg. 3.
McLean, E.O., R.C. Hartwig, D.J. Eckert, and G.B. Triplett. 1983. Basic cation saturation ratios as a basis for fertilizing and liming agronomic crops. II. Field studies. Agron. J. 75:635-639.
Miles, N & 16 others. 2013. The Albrecht System: uneconomical & outdated? The Farmers Weekly, Pinegowrie, South Africa http://www.farmersweekly.co.za/article.aspx?id=40610&h=The-Albrecht-System:-uneconomical--outdated accessed 13 Febr. 2015
Olson, R.A., K.D. Frank, P.H. Grabouski, and G.W. Rehm. 1982. Economic and agronomic impacts of varied philosophies of soil testing. Agron. J. 74:492–499.
Simson, C.R., R.B. Corey, and M.E. Sumner. 1979. Effect of varying Ca:Mg ratios on yield and composition of corn and alfalfa. Commun. Soil Sci. and Plant Anal. 10:153-162.