⇦ Back to Soil Fertility and Plant Nutrition Home
¶ Introduction
There are many different approaches for recommending fertilizer application rates. This is an overview of the general approaches that the ServiTech Laboratories currently use to generate fertilizer rate recommendations.
These fertilizer recommendations have three objectives:
- To meet the seasonal nutrient needs of a crop,
- To gradually raise and maintain the soil test level to a point where an optimum or a maximum yield can be achieved, and
- to prevent nutrient enrichment of fertilized fields that might result in pollution of surface waters or groundwaters
Fertilizer recommendations developed by the ServiTech Laboratories are based primarily on Land Grant University research and broadened by the experience of professional agronomists. Recommendations depend on the analytical results of the soil sample received by the laboratory, on information supplied with that sample, and on knowledge of regional crop, soil, and climate conditions.
The recommended fertilizer application is intended to supplement, rather than replace, the soil's natural ability to supply nutrients. In certain cases, the laboratory recommendation program will generate certain suggestions and information to help make management decisions for specific crop, soil, or climate conditions.
Fertilizer recommendations are made as a broadcast application of actual units of plant food. No fertilizer is recommended at very high soil test levels. Annual soil testing is suggested to monitor the soil nutrient status and to modify the fertilization program when necessary.
The final nutrient management decisions depend on individual circumstances. The general assumption that underlies the laboratory-generated recommendations is that the producer is in a reasonably good financial position and will have land tenure for several years, so will be able to accrue the returns from the investment in fertilizer nutrients or soil amendments.
There is no endorsement of specific fertilizer products nor adjustments for efficiency claims by the manufacturer.
Choice of product, application method, and timing decisions must be made by the producer based on the specific production situation.
¶ Soil Test History
Maintaining records of past soil test results is essential. Monitoring the progress of both short-term and long-term trends, if they exist, can help greatly in making nutrient management decisions. The soil test is a type of forecast. Like any other forecast, the outcome is subject to field conditions at some later date. Histories can help improve the accuracy of the soil test forecast.
Developing a good soil test history requires consistency. Consistency helps limit the amount of variability that occurs naturally. This includes consistency in sampling technique, consistent sample identification and preparation, and consistent analytical methods.
¶ Mobile Soil Nutrients
Nitrogen and sulfur are considered "mobile nutrients", because they move relatively quickly through the soil with percolating water. Recommended rates are designed to supply nitrogen and sulfur on a season-by-season basis.
¶ Nitrogen Recommendation Calculations
Yield goals or production goals are frequently used to predict nitrogen fertilizer needs. The crop nitrogen requirement per yield unit is multiplied by the desired yield goal to calculate the projected nitrogen demand. Crop nitrogen requirements vary between crops, harvest type, and regions.
Nitrogen credits are subtracted from the nitrogen demand. The difference between demands and credits are reported as the net fertilizer nitrogen requirement in pounds of nitrogen per acre (lb N/ac), calculated as:
- Nrec = (YG x CNR) – SN – SsN – NC where
- Nrec = fertilizer nitrogen recommended, lb N/ac
- YG = yield goal, as bushels, pounds, tons, etc
- CNR = crop nitrogen required per yield unit, as pounds
- SN = surface soil nitrogen, as lb N/ac
- SsN = subsoil nitrogen, as lb N/ac
- NC = nitrogen credit, as lb N
Nitrogen credits include soil nitrogen, nitrogen in manure that has been or will be applied, nitrogen from a previous legume crop in the rotation, and nitrogen mineralized from soil organic matter.
Nitrate is considered to be readily available soil nitrogen and is calculated from nitrate-nitrogen (NO3-N) detected in the soil test. The soil ammonium-nitrogen (NH4-N) concentration is occasionally useful. Ammonium is usually found at very low concentrations and may contribute little to the soil nitrogen credit.
The nitrate test results are most useful when determined from a soil sample collected shortly before planting. Nitrate is soil mobile, so the weather occurring between the time of sampling and the time of plant uptake will affect the accuracy of the predicted soil nitrogen credit.
The soil nitrate result is reported both as a concentration (parts per million, “ppm”) and as a calculated quantity of nitrogen. It is calculated as:
- lb N/ac = NT x SD x 0.3 where:
- lb N/ac = pounds of nitrate-nitrogen per acre
- NT = nitrate test result, ppm NO3-N
- SD = sample depth, inches
- 0.3 = soil density factor
The soil sample depth is the increment used to characterize the surface soil and/or the subsoil. Depth information is typically submitted as a top and bottom measurement. For example, depth of a surface soil increment might be submitted as “0 to 8 inches” and a subsoil increment as “8 to 24 inches”.
The soil density factor (0.3) is based on the average bulk density of an “typical”, undisturbed soil, assumed to have a silt loam texture with 2% organic matter. This soil bulk density value is 1.32. This is equivalent to 82.6 pounds per cubic foot, thus one acre-foot of soil weighs approximately 3,600,000 pounds (82.6 lb/ft3 x 43,560 ft2 = 3,598,056 lb). Thus, one-acre inch of soil weighs 300,000 pounds or 0.3 million pounds (3.6 million pounds ÷ 12 inches = 0.3).
¶ Nitrogen Fertilizer Response
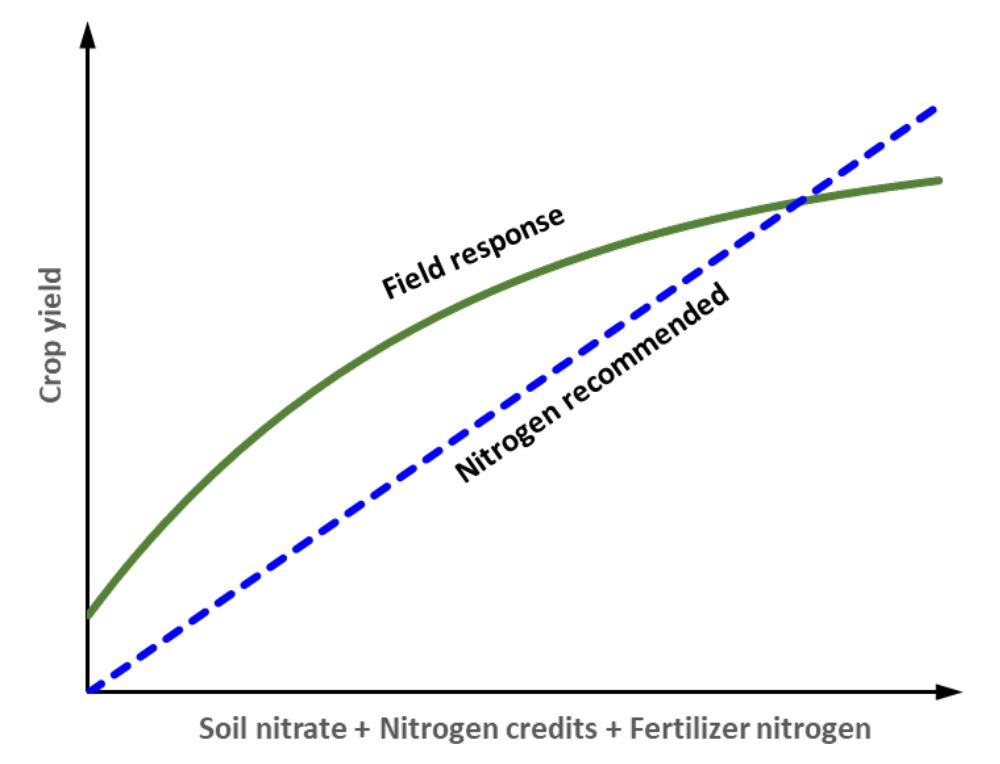
Yield results from nitrogen rate trials usually show a curvilinear response to increased nitrogen rates. The yield response to each additional pound of nitrogen decreases as yields increase. At a certain point, the yield does not change or may decline as more nitrogen is added.
The exact shape of these response curves will differ from location-to-location and from year-to-year. Since it is impossible for the laboratory to know exactly where a particular yield goal fits on the response curve of a specific soil, the current recommendation calculations generate a straight line.
After all other factors are considered, this approach estimates nitrogen needs quite well for many crops. The overall objective is to end the growing season with little or no nitrogen in the soil profile.
Realistic yield goals are essential for making good nitrogen recommendations, because excessive nitrogen application can actually limit yields and quality of some crops. It can also result in nitrate leaching below the crop root zone and becoming a ground water pollutant.
The final crop response to nitrogen fertilizer will depend not only on the rate, but also on-site specific factors including the application timing, the nitrogen fertilizer source, cost of nitrogen, fertilizer placement, seasonal weather, soil productivity and other factors.
¶ Figure 1. Relationship of Yield to Nitrogen Fertilization
¶ Sulfur Recommendation Calculations
Calculating sulfur fertilizer requirements is similar to calculating nitrogen recommendations. Several factors are involved in making sulfur fertilizer recommendations. The information used to make the recommendation should include the sulfur soil test, organic matter content, and cation exchange capacity (CEC, as an approximation of soil texture).
The crop sulfur requirement per yield unit is initially estimated at one-tenth of the nitrogen requirement. This requirement is then adjusted for individual crops.
The crop requirement is multiplied by the yield goal to calculate a sulfur demand. The recommended fertilizer rate is the difference between the sulfur demand and the sulfur credits.
The credit for soil test sulfur (as "lb S/ac") is subtracted from this requirement, using the same calculation as used for nitrate.
The soil organic matter is estimated to mineralize during the growing season and to contribute about 3 pounds of sulfur per each one percent of organic matter. This contribution is also subtracted from the sulfur requirement.
The equation for calculating recommended sulfur fertilizer rates is:
- Srec = (YG x CSR) – SS – (OM x 3) where,
- Srec = fertilizer sulfur requirement, lb S/ac
- YG = yield goal, as bushels, pounds, tons, etc
- CSR = crop sulfur required per yield unit, as pounds
- SS = surface soil sulfur, as lb S/ac
- OM = soil organic matter, % OM
¶ Sulfur Fertilizer Response
The sulfur soil test is not always good predictor of crop response to sulfur fertilizer. Corn and alfalfa receive a minimum sulfur recommendation if soils have a low cation exchange capacity (CEC) and if the calculated recommendation is less than the "SRec" values in Table 1. The CEC by summation is assumed to approximate soil texture. This texture adjustment helps compensate for potential sulfur response on sandy soils that can occur even with a high soil sulfur test.
¶ Immobile Soil Nutrients
The soil test result for an immobile nutrient is an “index” of availability, rather than a direct measure of the amount of soil nutrient in the soil. Immobile nutrients are reported as "parts per million (ppm)" concentration in the soil extractant solution rather than as "pounds of available nutrient per acre" in the field.
Expressing a soil analysis value as a quantity is misleading because the actual amount found in the soil solution that is truly available to the root system is typically very, very small. The concentrations in the filtered extract are indicators of the potential ability of a soil to release or supply a particular nutrient to the root surfaces of a specific crop over the growing season. This potential ability to supply a nutrient can range from “very low” to “very high” as estimated by the laboratory analysis result. The actual field response will vary, depending on seasonal field conditions.
¶ Figure 2.1. Immobile Nutrient Calibration Curve Examples
¶ Figure 2.2. Immobile Nutrient Calibration Curve Examples
¶ Figure 2.3. Immobile Nutrient Calibration Curve Examples
¶ Figure 2.4. Immobile Nutrient Calibration Curve Examples
¶ Recommending Phosphorus and Potassium Fertilizer Rates
ServiTech uses a combination approach to calculate fertilizer rates for phosphorus (P) and potassium (K). The approach uses elements from the three standard concepts of "sufficiency”, “build”, and “maintenance”.
Nutrient sufficiency is the primary concept used to develop recommendations. Figure 2 illustrates the basis of the sufficiency concept. Data from many years and locations of field research experiments are compiled to compare how well a soil can supply a certain nutrient over a growing season to the concentration extracted in the laboratory. This mass of research data is statistically reduced to a mathematical equation that describes a “calibration curve”. The results from an individual experiment may fall on, over, or under the calibration curve.
Calibration research data is reported as "relative yield" or "percent of maximum yield" rather than actual measured yields. Yields at the individual fertilizer rates are expressed as a percent of the maximum yield obtained in the particular field trial.
Using a relative yield approach helps to normalize the differences in actual harvested yields due to typical yearto-year and location-to-location variability. This variability results from differences in soil type, seasonal weather, varieties or hybrids, and other factors.
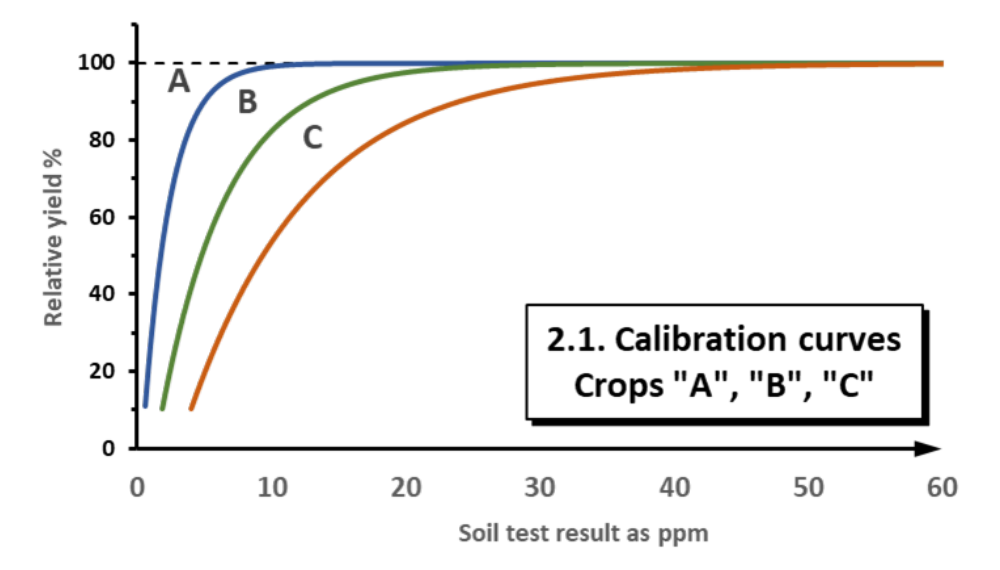
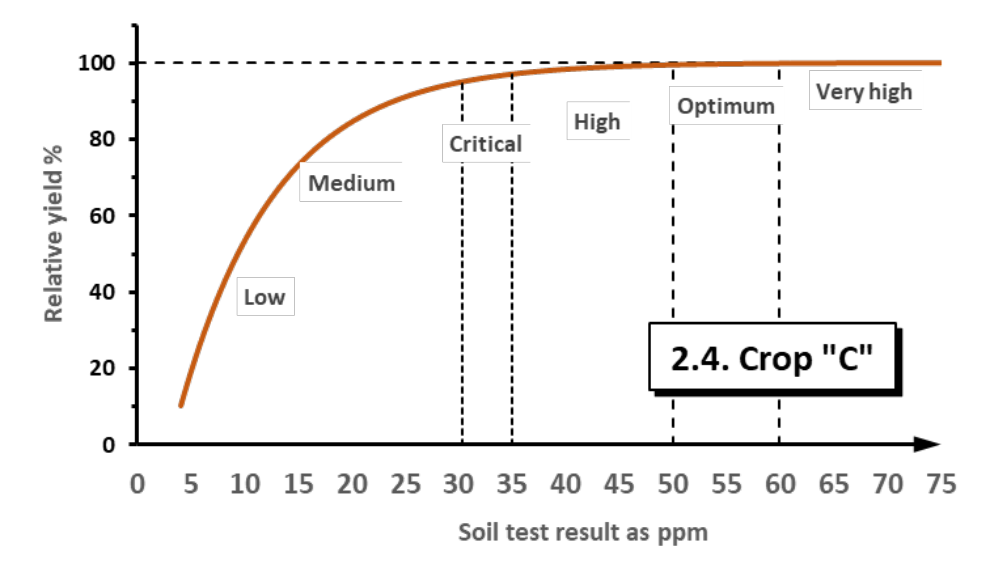
Figure 2.1 is an example of the calibration curves for three different hypothetical crops. These curves help identify how well a soil can meet the nutrient requirements of a specific crop as a percentage of the potential yield. The projected yield is expected to be 10% to 100% of the potential yield at a particular soil test level according to the location on the calibration curve.
In this example, crop A is the least responsive of the three, because it reached its maximum (or 100%) yield at a lower soil test level than the other two. Crop C is most responsive and crop B has an intermediate response.
The field research behind the calibration curves can then help identify situations when a crop is likely to respond to applied fertilizer (or not respond) and also how likely the response – very likely, not so likely, unlikely. Producers can use the soil test result to help identify situations where investing in a fertilizer application will or will not be profitable.
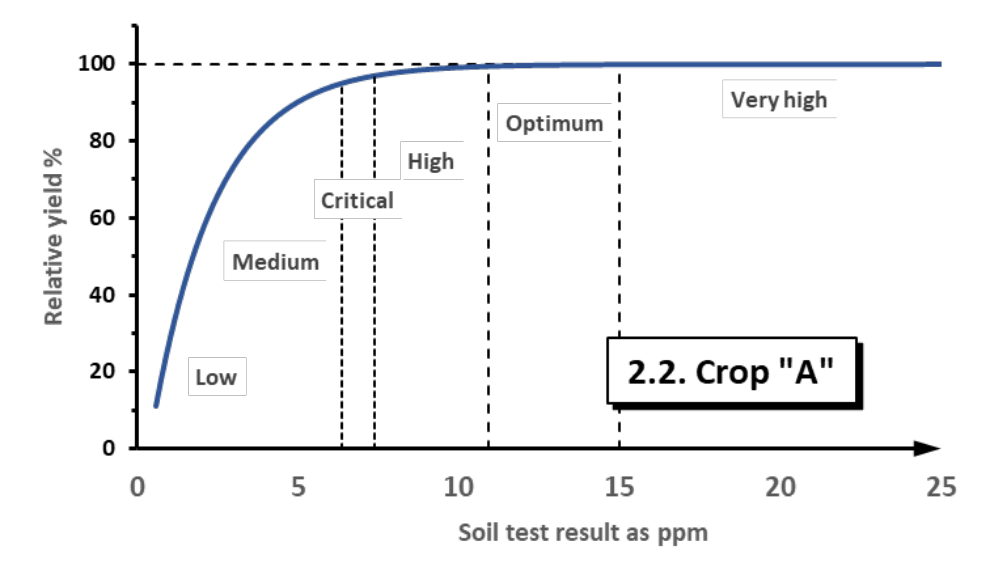
The calibration curve data is first used to identify a “sufficient” or “critical” soil test range for each crop. This critical range is where the crop is expected to reach about 95% to 97% of potential yield. The critical range can simply help tell if fertilizer would or would not improve yields at all, but not by how much.
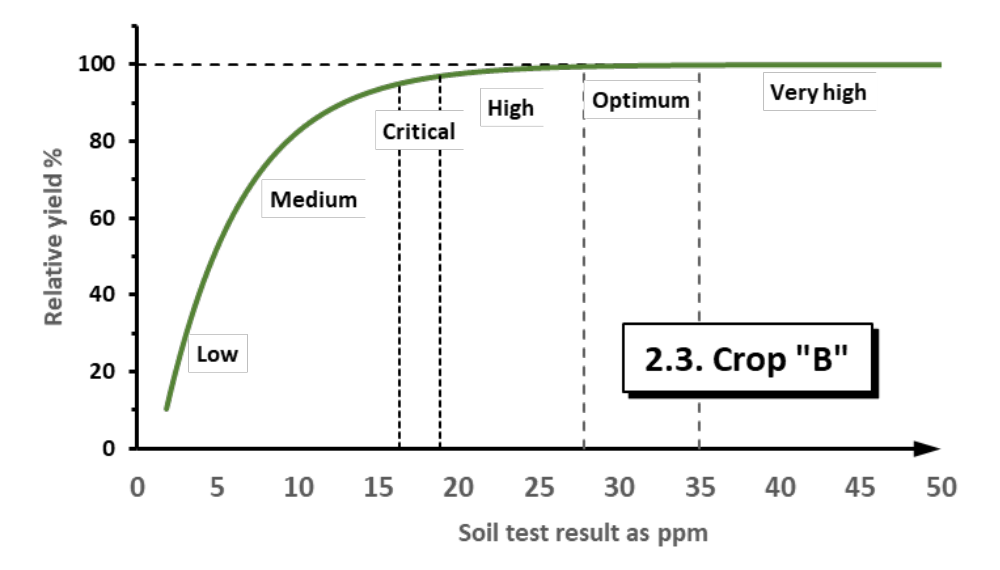
Figures 2.2, 2.3, and 2.4 show the different critical soil test ranges for the three hypothetical crops: 6 to 7 ppm, 18 to 20 ppm, and 30 to 35 ppm for crops A, B, and C, respectively. Soil test results that fall below the critical range for each of these crops identify situations where a fertilizer application is expected to improve crop yields.
Soil test results above the critical level describe situations where fertilizer is not expected to improve yields. This is because the soil itself should be capable of supplying sufficient nutrient through the growing season to meet the crop requirement for 100% of its potential yield.
The calibration data is then used to identify the actual fertilizer rates that are adequate to make up the difference between the percent sufficiency determined by the soil test and 100% sufficiency for that crop. The sufficiency rate approach has the lowest economic risk level because fertilizer is considered to be a short-term investment – one to two years - and is only recommended when an adequate yield response is expected.
A shortcoming of the sufficiency approach is that yields may not meet full yield potential during times when growing conditions allow above-average yields.
The build concept does not specifically consider crop yield. Rather, fertilizer is applied to build the soil test result to some level, often in the “optimum” or “high” range, which may be defined by calibration research. The required amount of fertilizer to build to a certain soil test level can be applied in a single application or may be divided into annual rates that are applied over a period of years.
Building to a soil test level is considered a higher risk approach because fertilizer is often applied at soil test levels where no yield increase is expected. Fertilizer becomes an expense at this point, if only considering the short-term cost-benefit.
On the other hand, building a soil test can be considered a long-term investment that helps assure optimal yields when growing conditions are good and allow above normal yield potential.
The build-approach application rate depends on the average amount of fertilizer nutrient required to increase the soil test by each 1 ppm. A rule-of-thumb is that it takes an average of about 15 to 20 pounds of phosphate fertilizer (as P2O5) to increase the soil test by 1 ppm phosphorus (P) and 8 to 12 pounds of potash (K2O) for each 1 ppm of additional soil test potassium (K).
The actual change in the soil test for a given situation is difficult to predict because of differences in soil type, clay content, soil pH, and other factors. Build-approach recommendations often use some average rate (e.g., 18 lb P2O5 per 1 ppm P), but it tends to take more fertilizer per soil test unit to build from a low soil test and less to build at a higher soil test.
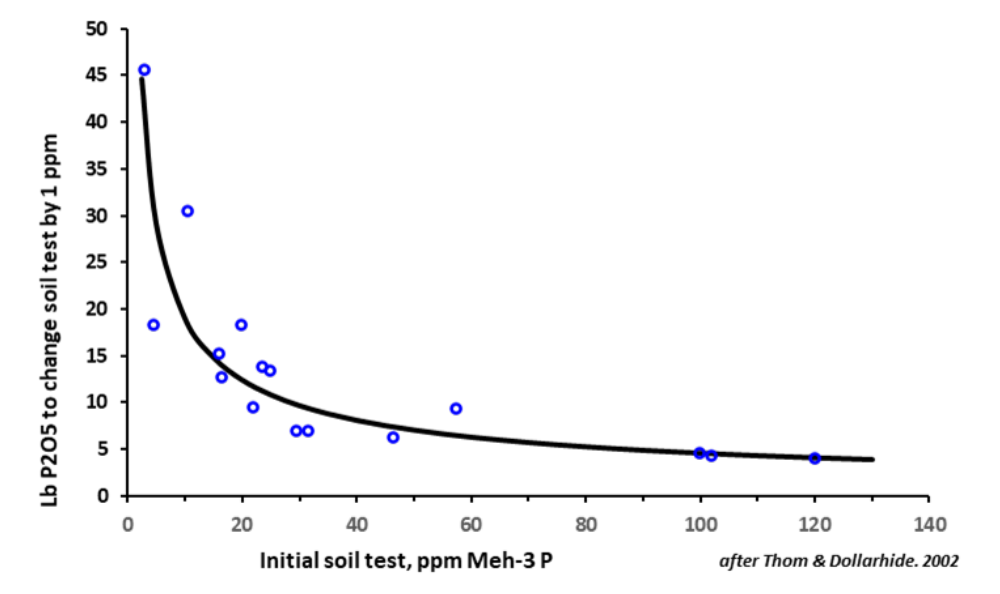
Figure 3 illustrates the effect of soil test phosphorus on fertilizer build rates. It required 30 to 40 lb P2O5 per 1 ppm P at a very low soil test, but only about 5 ppm P2O5 at a very high soil test.
¶ Figure 3. Phosphate Fertilizer Required to Build Soil Test
The maintenance or crop removal concept depends on the annual harvested yield to set a fertilizer rate for the next season. The recommended fertilizer rate is adjusted up or down from the previous year’s application to offset the nutrients removed by the harvested crop. The objective is to keep the soil test at or near to the current level and prevent it from declining.
For example, each bushel of corn grain contains an average of 0.31 pounds of phosphorus as P2O5. A maintenance application would require replacing the amount of P2O5 removed by harvest with an equivalent amount of phosphate fertilizer. An application of 62 lb P2O5/ac would be recommended if the harvested yield had been 200 bu/ac (200 bu/ac x 0.31 lb P2O5/bu = 62 lb P2O5/ac). The fertilizer application would be adjusted up or down appropriately, depending on the change in harvested yield from 200 bu/ac.
The maintenance approach is useful, but a crop may actually be under-fertilized at low soil test levels by only applying crop removal rates. The maintenance application may be lower than the sufficiency recommendation in this case.
The combination approach used by the ServiTech Laboratories incorporates all three concepts to make phosphorus or potassium recommendations, as illustrated in Figure 4.
Sufficiency data for the particular crop is used to develop the initial recommendation where no fertilizer is recommended above the critical level. The dashed line in Figure 4 represents the sufficiency fertilizer rate used to initially develop a recommendation.
¶ Figure 4. Base Fertilizer Recommendation
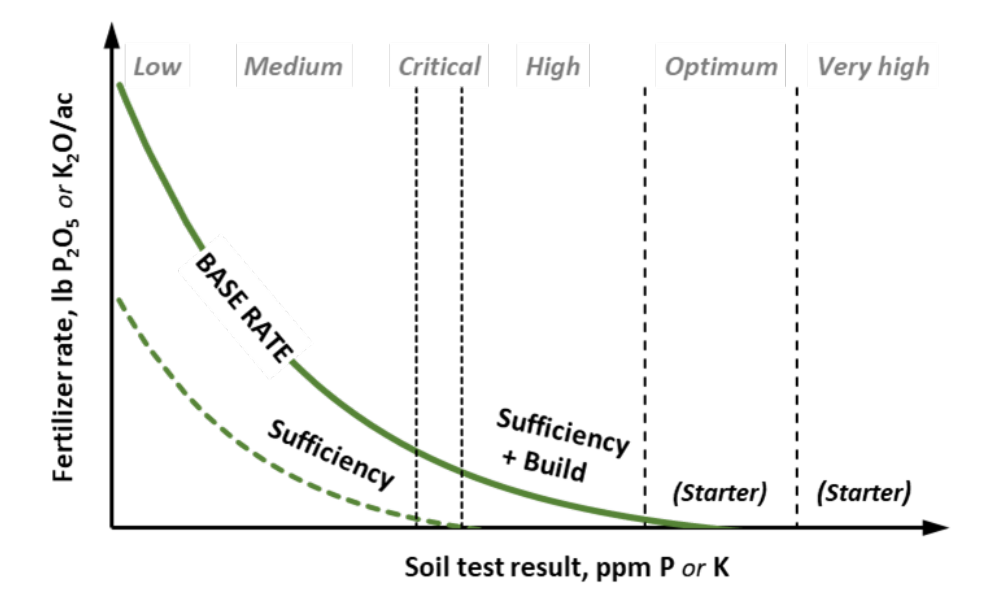
Additional fertilizer is added the sufficiency rate to gradually build the soil test level to the “optimum” or “high” category over a period of several years. No fertilizer is specifically recommended when the soil test is “very high”, but a planting-time starter application is encouraged where appropriate.
The solid “BASE RATE” line represents the additional fertilizer applied to build above the sufficiency rate. This allows the producer to reduce rates or even skip using fertilizer for a season or two ,if economic conditions are poor.
Recommended rates are highest at low soil test levels and drop rapidly to the medium range. Higher rates at low test levels are necessary to both produce a crop and to improve the test level at the same time.
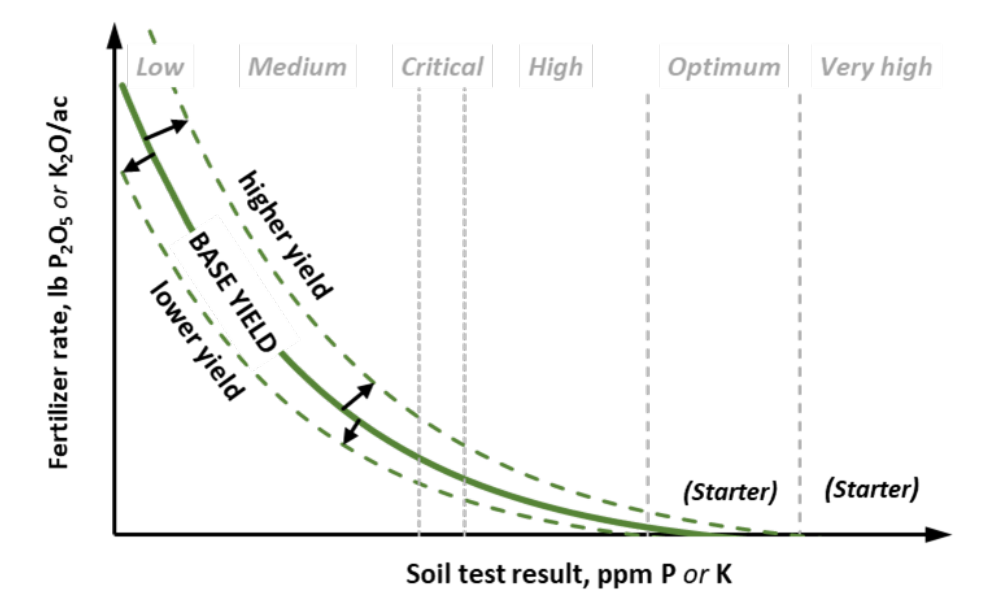
Each crop is also assigned a “base yield goal” to represent an achievable, “average” yield for the region. The base fertilizer rate is adjusted up or down according to the difference between the yield goal provided in the soil sample submission information and the base yield goal.
The two dashed lines in Figure 5 represent the fertilizer rates to adjust for yield goals that are higher and lower than the base yield goal. The crop removal values used to make these maintenance adjustments are obtained from the ServiTech feed analysis database or from appropriate public information sources.
The maintenance adjustment also provides a level of economic adjustment. The fertilizer expense is reduced for situations with lower yield potential to help compensate for lower potential income. Higher yields remove more nutrients so the rate is increased to help maintain productivity by maintaining the soil test level.
¶ Figure 5. Adjusting Base for Maintenance or Crop Removal
¶ Immobile Soil Nutrients: Secondary Major Nutrients, Micronutrients
Calcium (Ca) and magnesium (Mg) are considered secondary major nutrients because they are usually required by plants in comparatively large quantities, but not as large as the major nutrients (N, P, and K). Essential micronutrients are required in small quantities by crops. The most common include zinc (Zn), iron (Fe), manganese (Mn), copper (Cu), and boron (B).
The objective of making rate recommendations for these nutrients is to build the soil to an optimum soil test range with a single broadcast fertilizer application. There is no adjustment for yield goal. We assume no efficiency for chelated fertilizers or specialty fertilizers, regardless of application method or rate.
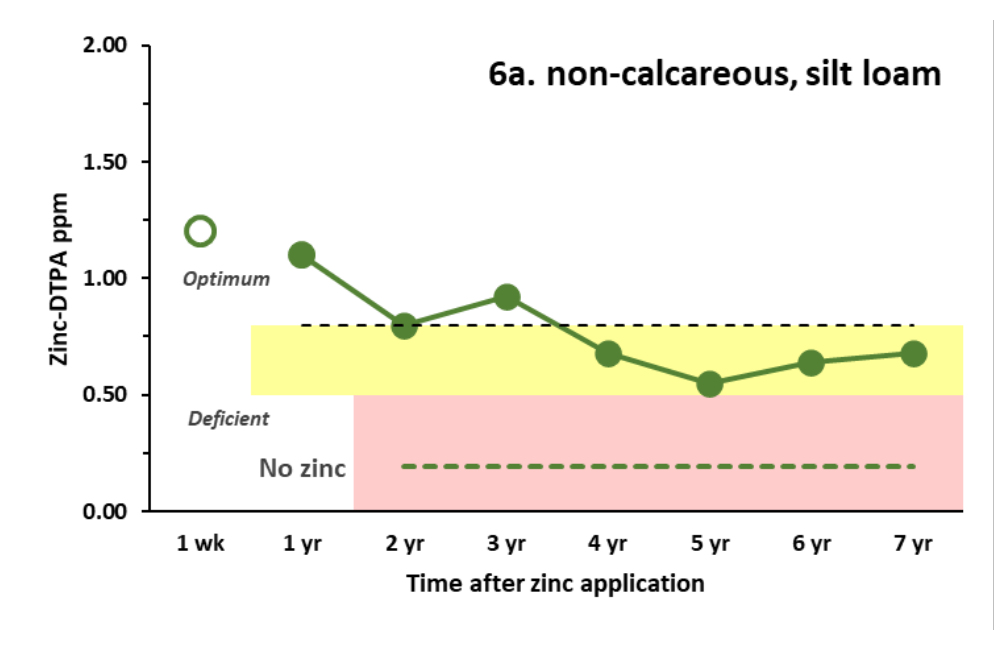
The single micronutrient application is expected to be effective for the following three to five years. The soil test is expected to drop and reach the critical range after that time and another application would be warranted to build the soil test.
Figure 6 is from an experiment that illustrates how a single zinc fertilizer application affected the soil test result over seven years. The heavy dashed line in the deficient range represents the soil test of the check or no zinc treatment.
The zinc soil test was well in the optimum range a week after application, but declined each year afterwards. It reached the “deficient” range in both cases after 4 to 5 years.
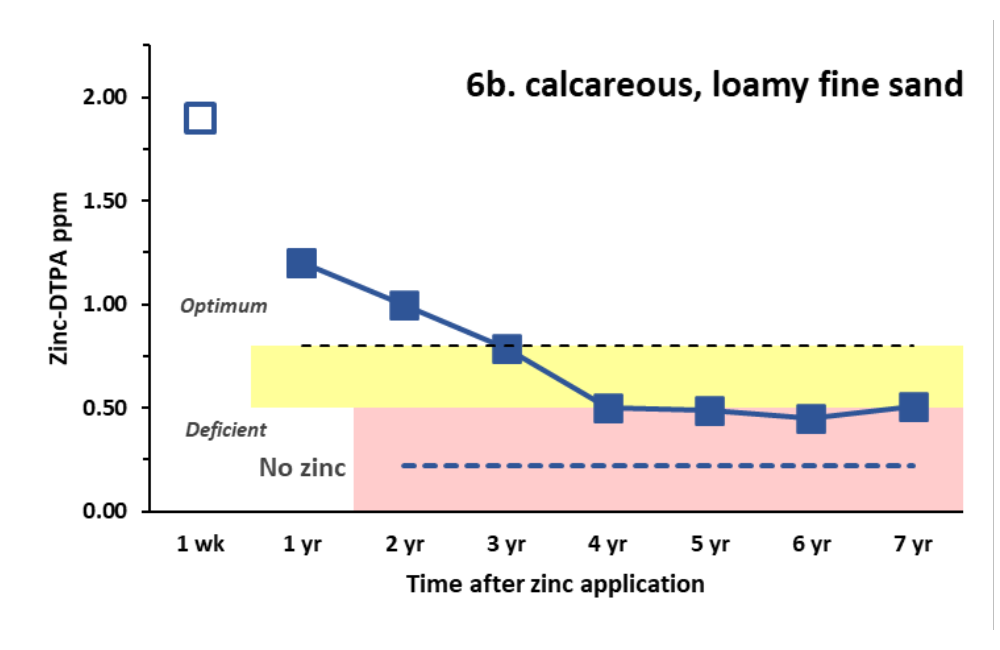
Micronutrient soil chemistry is affected by both acidity and alkalinity. Note, it took longer for the soil test to reach the deficient range sooner in the non-calcareous soil (Figure 6a) at the same fertilizer rate in the calcareous soil (Figure 6b).The additional carbonates in the calcareous soil reacted with the zinc fertilizer to form insoluble carbonates and oxides. This reduces the relative number of zinc ions available to the soil test extracting solution and reduces the soil test result.
In the case of zinc, the recommended rate is increased by 30% if the soil pH exceeds 7.3. The extra fertilizer is included to compensate for insoluble zinc carbonates that form in the alkaline soil.
Producers have two fertilizer application options with these immobile nutrients. One option is to apply the full broadcast rate in the first year and monitor the soil test until it drops to the critical level to make another full-rate application.
The second option is to make the full-rate broadcast application, then apply smaller rates with starter fertilizer each following year to help maintain the soil test level.
¶ Figure 6a. Soil Test Response Over Time to 10 lb. Applied Zinc
¶ Figure 6b. Soil Test Response Over Time to 10 lb. Applied Zinc
¶ References
Thom & Dollarhide. 2002. "Phosphorus Soil Test Change Following the Addition of Phosphorus Fertilizer to 16 Kentucky Soils". Agron. Notes. Coop. Ext. Serv., Univ. of Kentucky, Lexington KY. 3 pg.
Boawn. 1974. Residual availability of fertilizer zinc. Soil Sci. Soc. Amer. Proc. 38:800-803.
Boawn. 1976. Sequel to "Residual availability of fertilizer zinc". Soil Sci. Soc. Amer. Proc. 40:467-468.
Meisinger, Schepers, Raun. 2008. “Crop nitrogen requirement and fertilization” in Nitrogen in Agric. Systems, Agronomy Monograph 49. pg. 563-612