⇦ Back to Soil Fertility and Plant Nutrition Home
¶ Introduction
Soil test results contain a certain amount of naturally occurring variability. Some differences may be influenced by by cropping patterns or nutrient application. Field sampling technique, sample preparation, and laboratory quality control can also affect soil test results. The reliability of test results may be questioned when successive samples are not identical or do not meet expectations. Lab results can be affected by the field conditions both at the time of sampling and before. Soil moisture and temperature at sampling time or the duration of wet or dry weather before sampling can affect chemical and biological reactions that can potentially influence nutrient chemistry during lab analysis. For example, iron and manganese solubilities are affected by soil aeration or lack of aeration. Soil pH values tend to decrease and soluble salt levels tend to increase following drought or prolonged dry conditions. Lab results can be affected by the interval since crop harvest or active crop growth and the time of sampling. Crop residues or root tissues may release or tie up certain nutrients depending on stage of decomposition or active growth.
¶ Field Study
ServiTech agronomists in south-central Kansas contributed to a field study that looked at soil test variability at different times during the year. Each agronomist identified a small plot area, about 10 ft. by 10 ft. in a designated field. They collected a monthly soil sample from the plot area and submitted it for analysis. The samples were variously collected from March 1987 to April 1989. The limited amount of available field information is shown in Table 1 below.
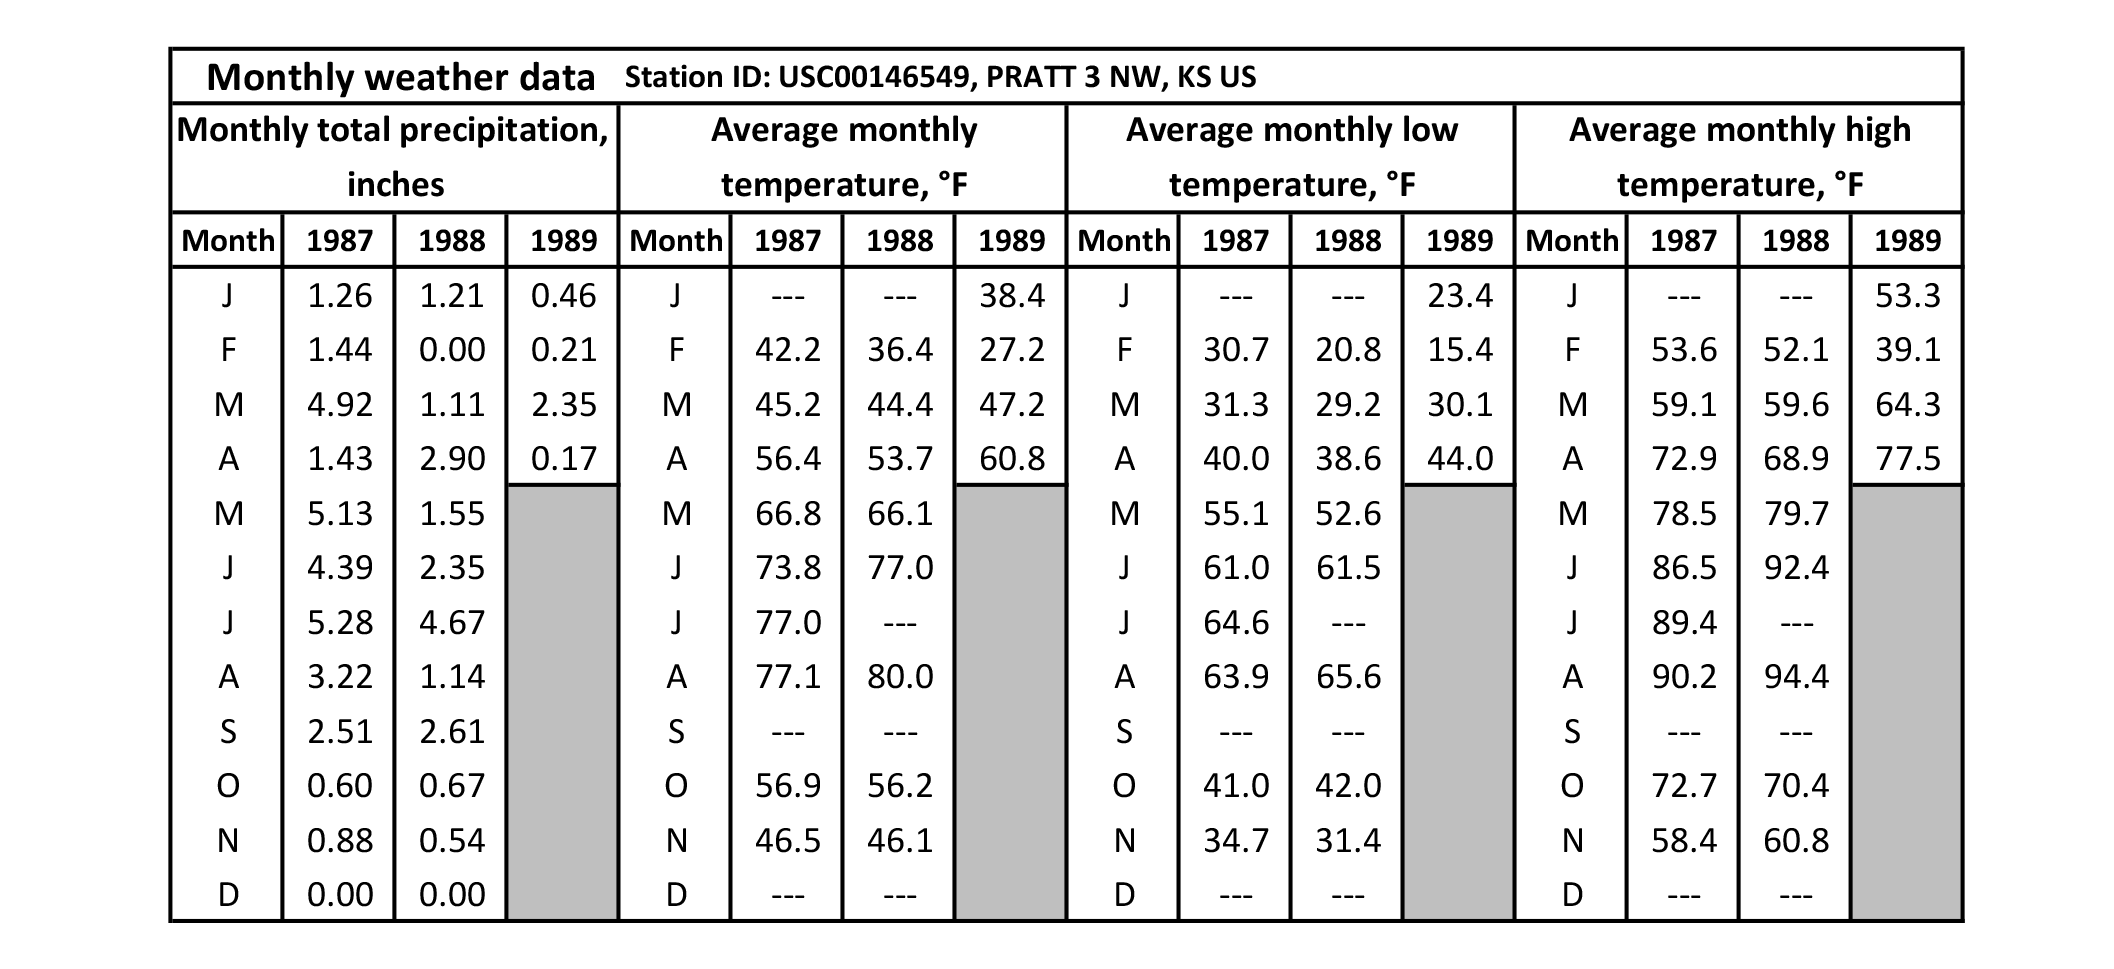
The accumulated soil analysis results for six locations are presented as line graphs in the following pages. Fields are identified by the NRCS soil type represented by the plot area. Monthly weather data for Pratt, Kansas, is shown on page 13. Pratt was centrally located with respect to the various field plots.
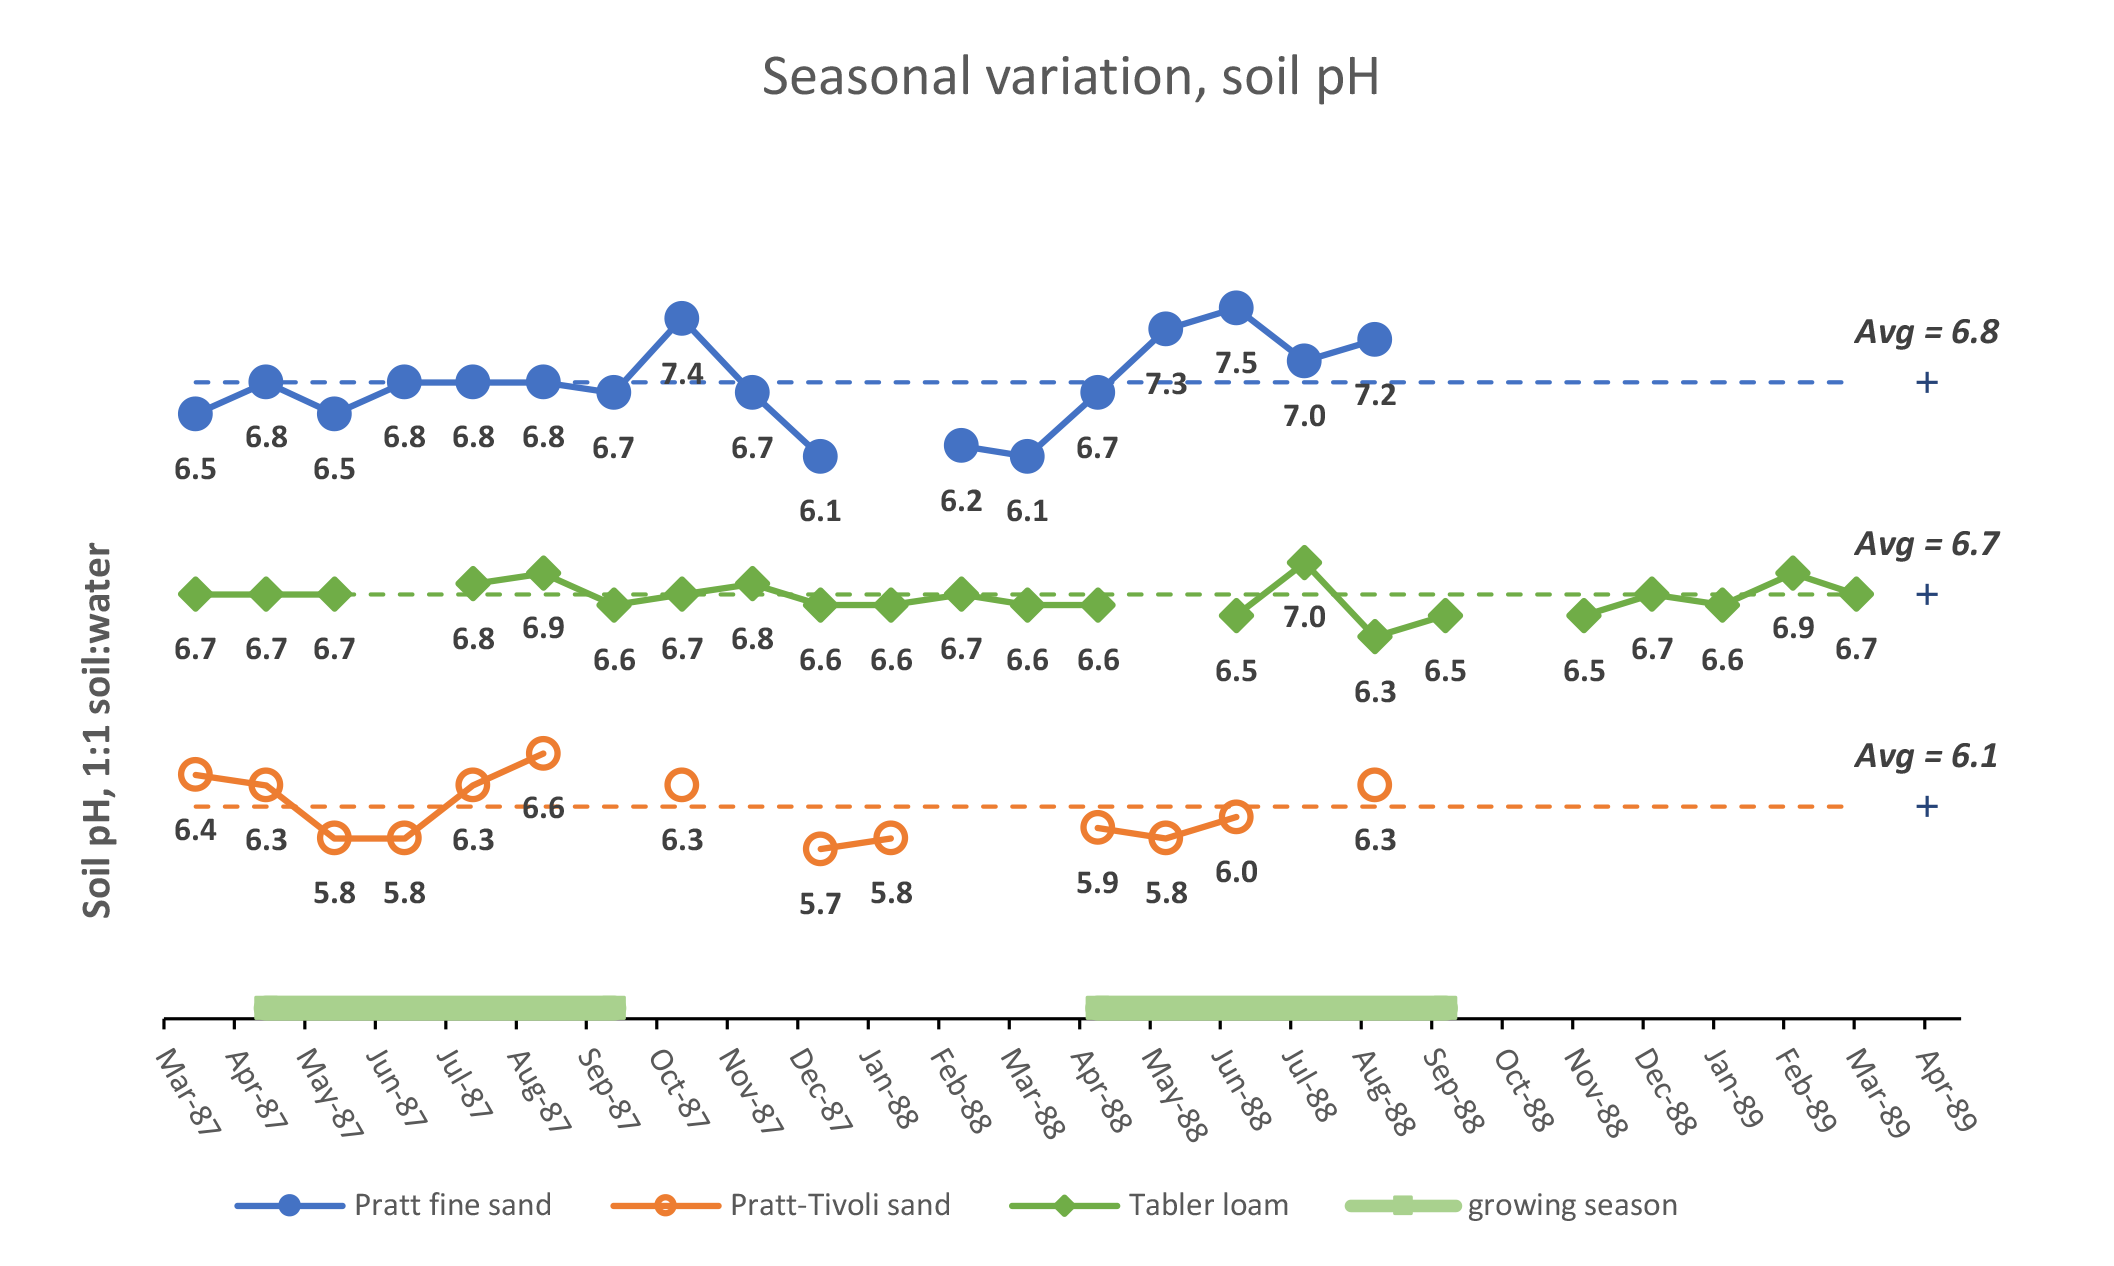
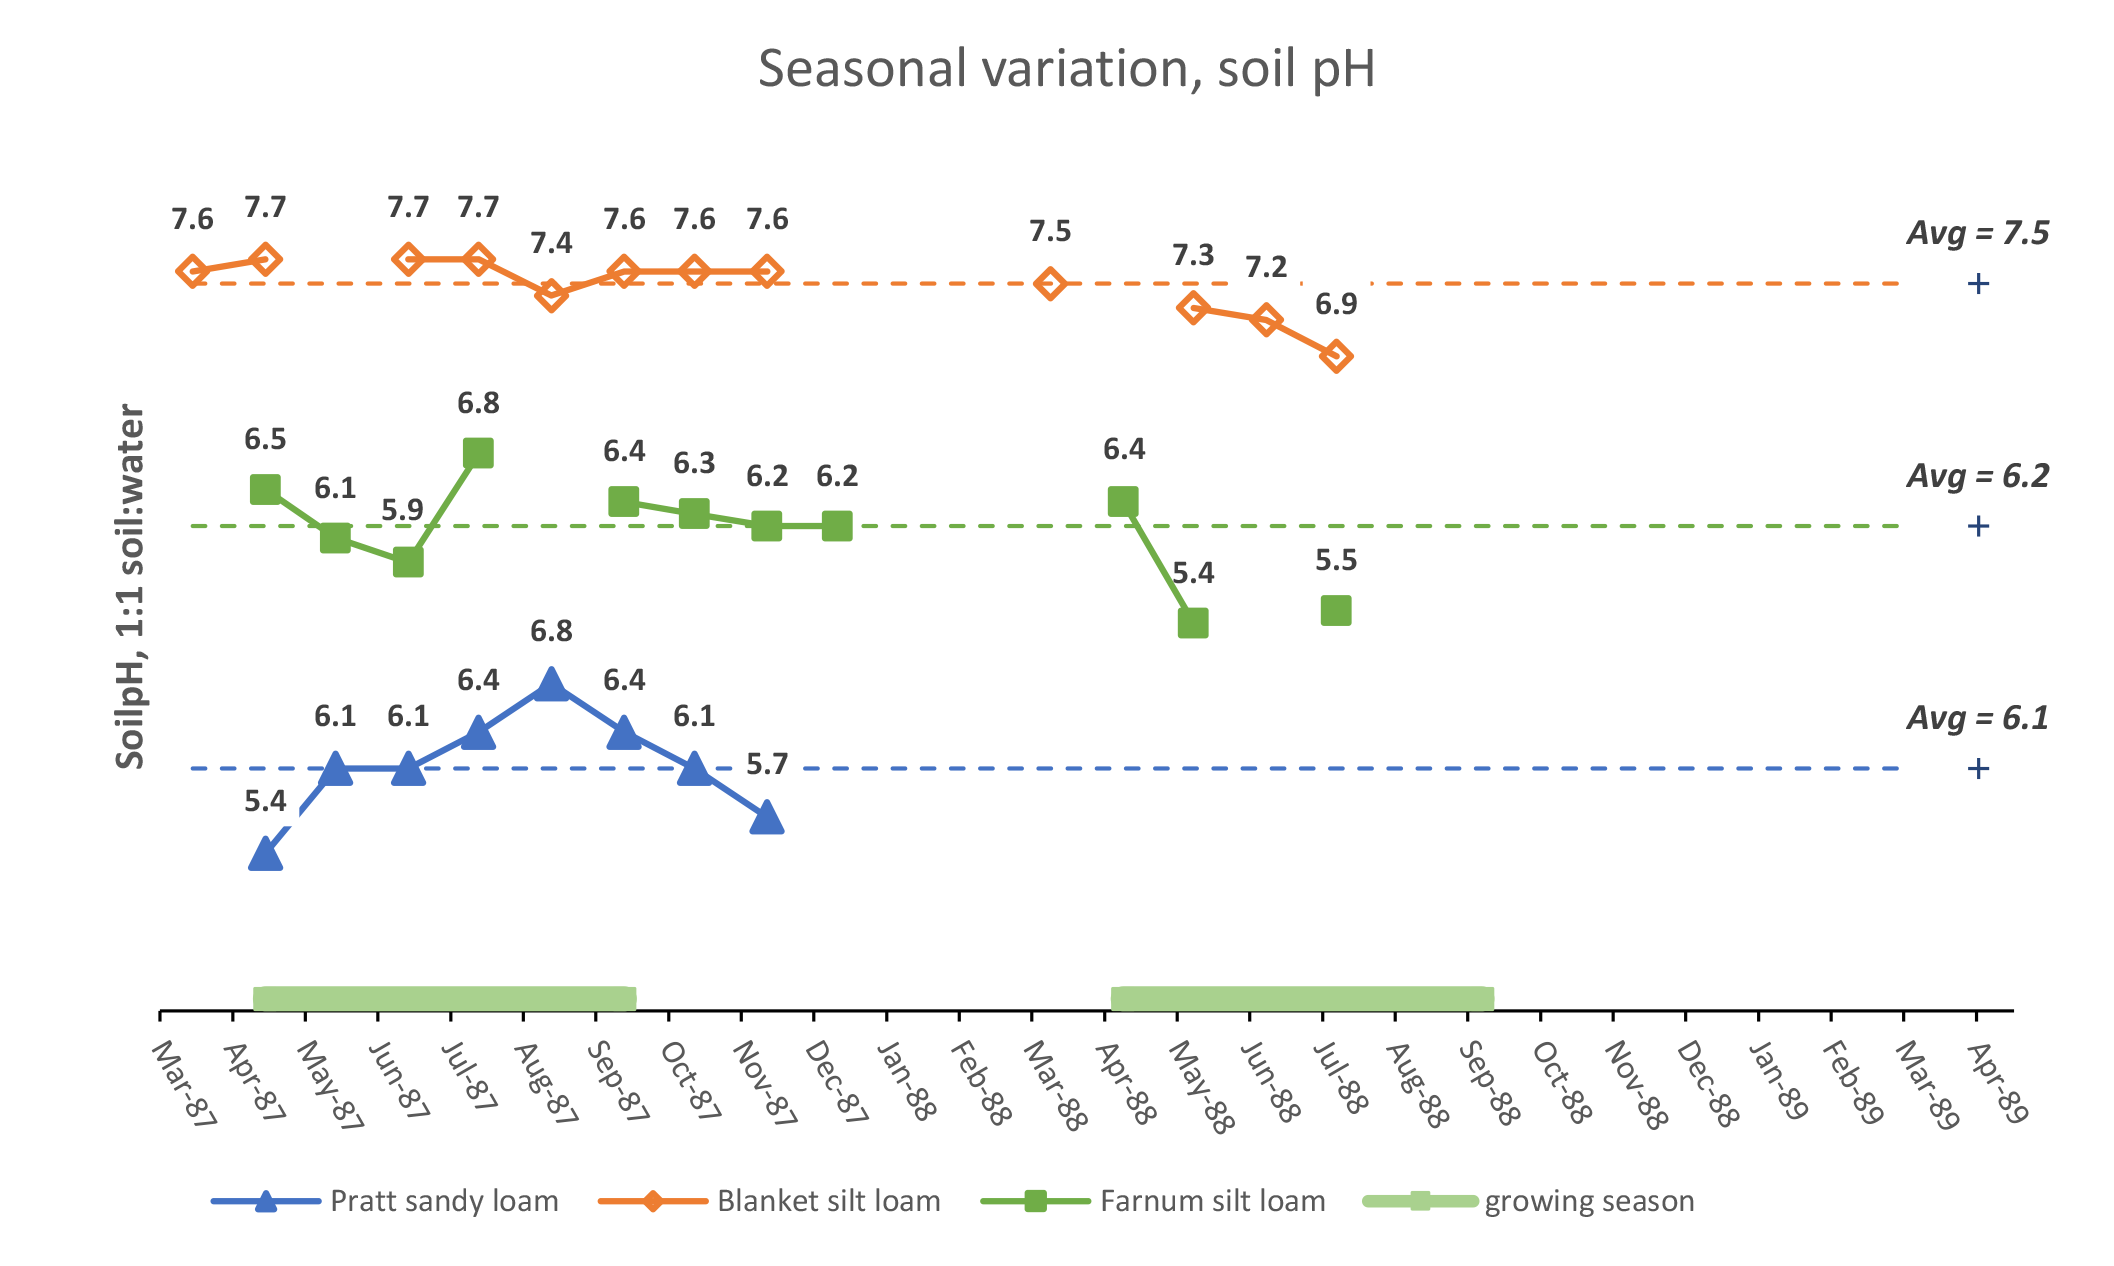
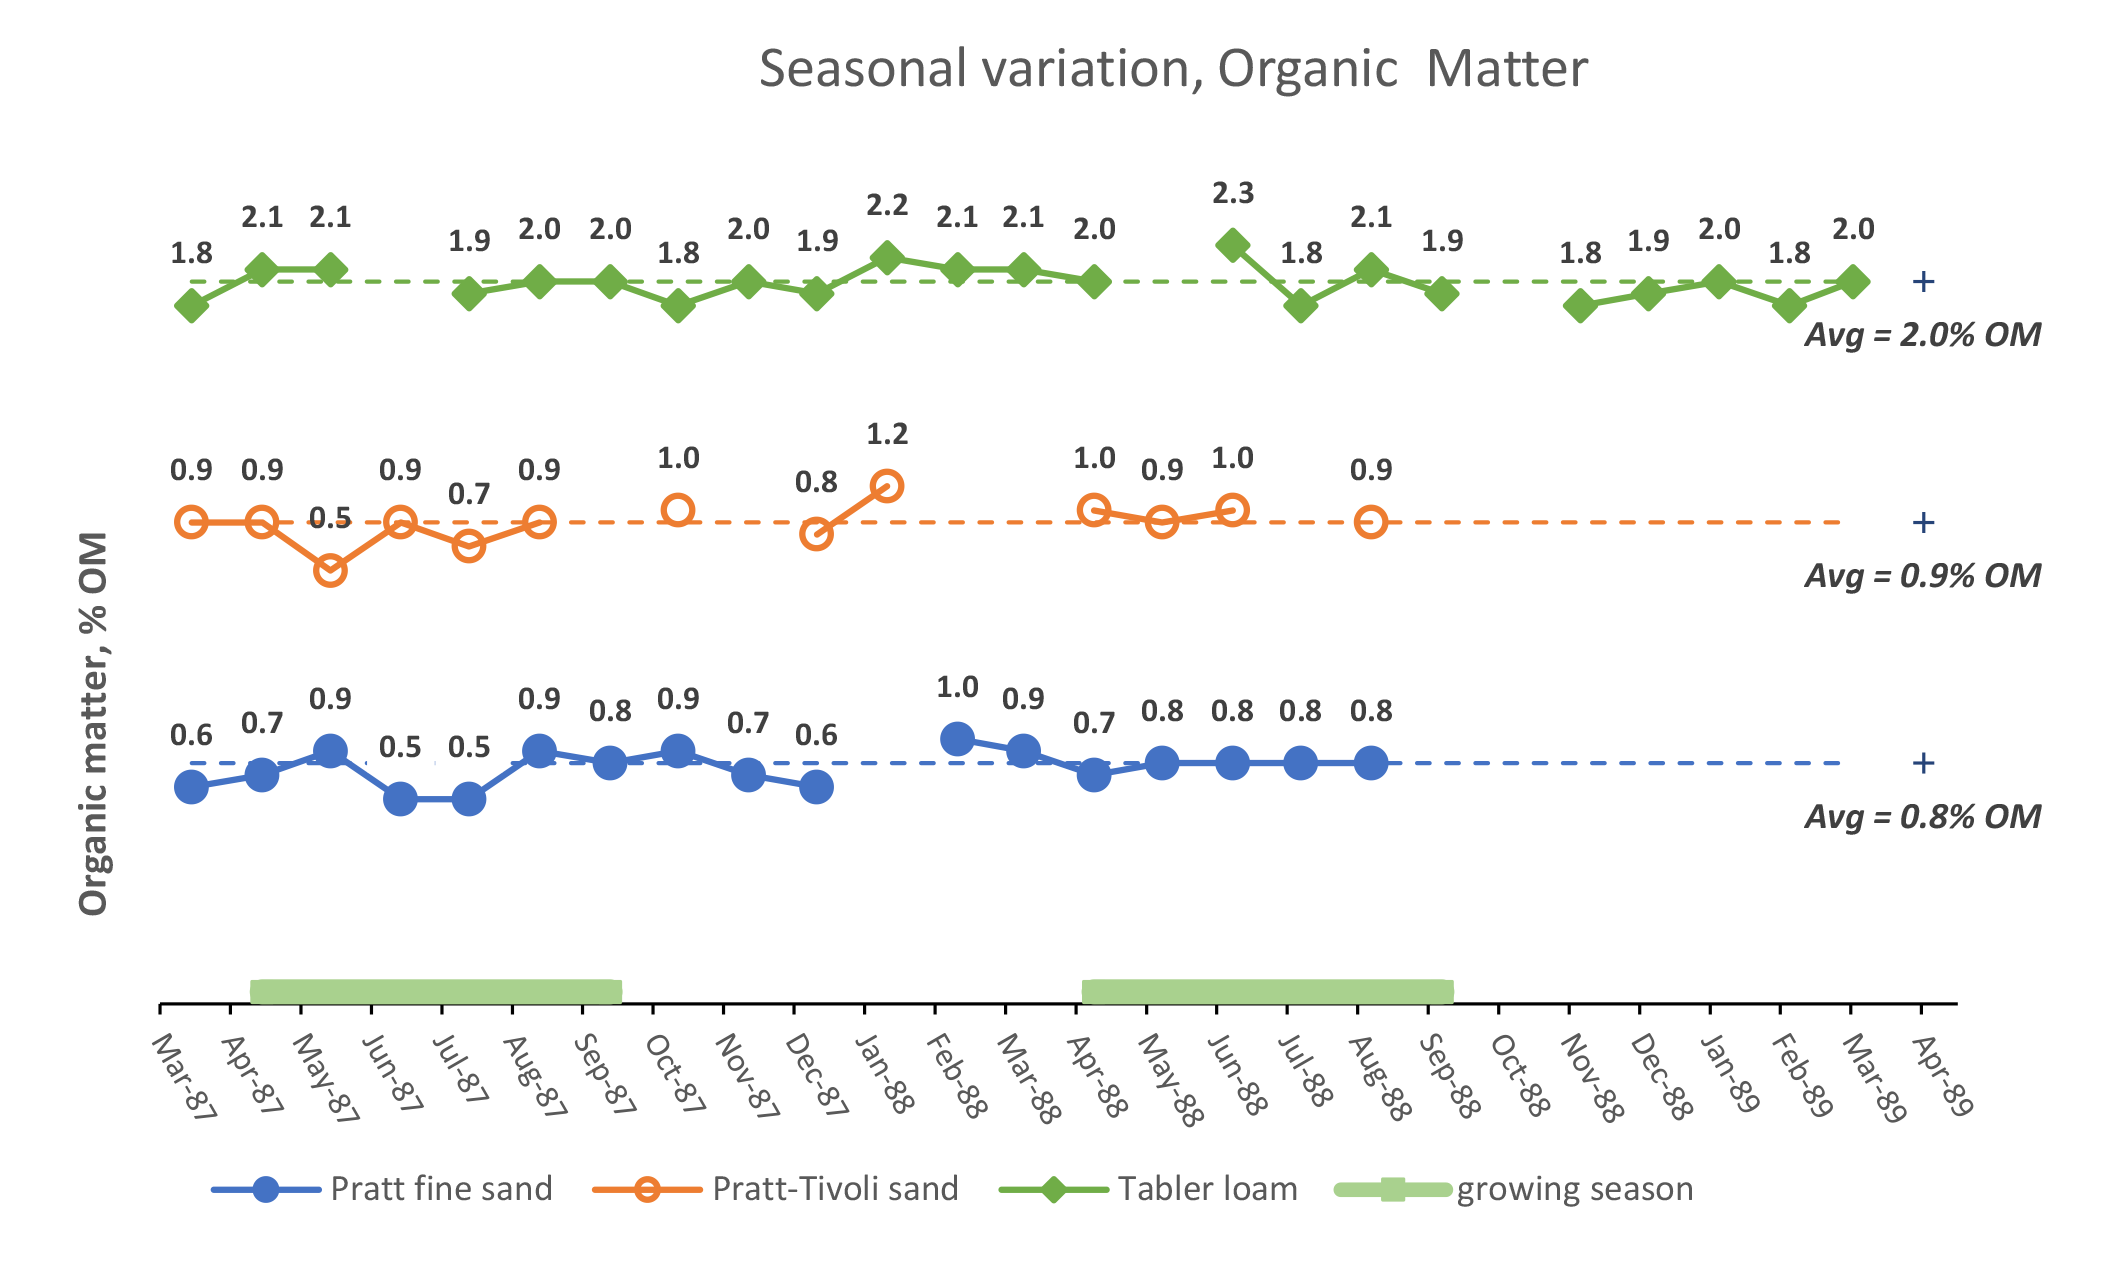
The graphs have a dashed line that represents the average soil test result for each plot. The actual average value is shown to the left of each dashed line.
The various monthly results are plotted around the average line to illustrate the relative change from average over the time that each location was sampled. The green bar at the bottom of each chart represents the typical corn growing season duration, from mid-April to mid-September.
¶ Results
Soil test results varied significantly from the average in some cases. The results may have been due to fertilizer application or specific growing conditions.
It is important to note that the same general upward or downward trends often occurred in two or more of the locations at about the same time. The trends were not exactly of the same magnitude, but tended to follow the same pattern(s). This suggests there are probably regional trends in soil test results that are due to seasonal weather, like drought or excess precipitation.
Understanding the potential for these differences to occur at different times in the year or the growing season can be useful when interpreting results.
¶ Table 1. Field Information for Study Plot Area |
|||
|---|---|---|---|
| Soil Type | 1987 Crop | Comments | 1988 Crop |
| Pratt fine sand | Corn | Spoon-fed nitrogen | |
| Pratt-Tivoli sand | Corn | Dry fertilizer applied preplant; 150 lb N/ac sidedressed in June | |
| Tabler loam | Corn for Silage | 210-17-0-0.25_Zn-8_sul | Planted to wheat |
| Pratt sandy loam | Corn | Hailed out June 24th; yield = 31 bu/ac | |
| Blanket silt loam | Corn | Applied 190-45-0-5_Zn-8_sul | Not Cropped |
| Farnam silt loam | Grain Sorghum | ||
¶ Figure 1a. Seasonal Variation, Soil pH
¶ Figure 1b. Seasonal Variation, Soil pH
¶ Figure 2a. Seasonal Variation, Organic Matter
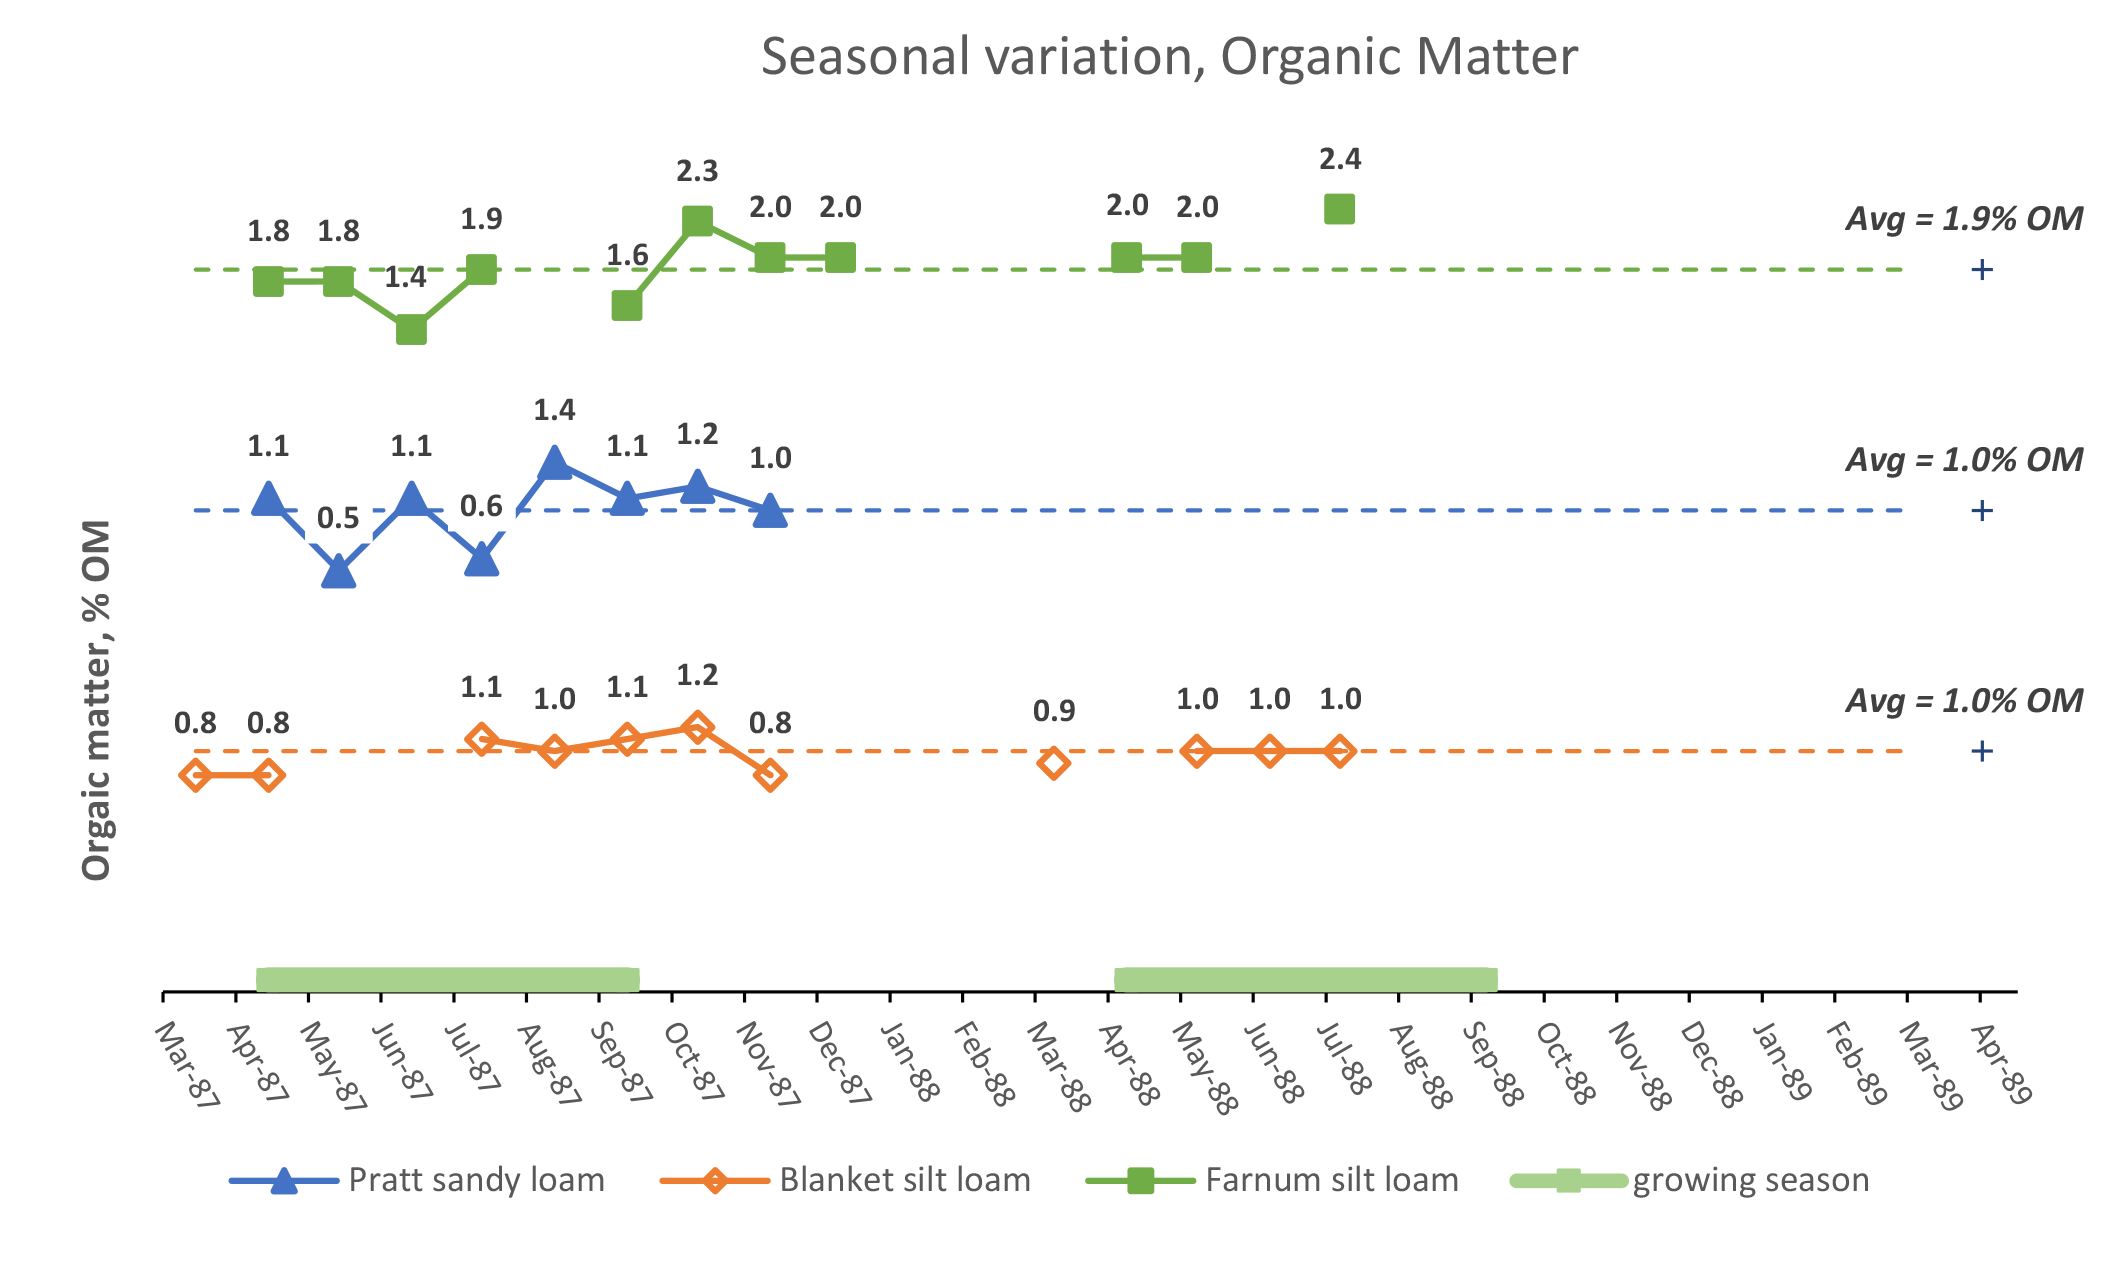
¶ Figure 2b. Seasonal Variation, Organic Matter
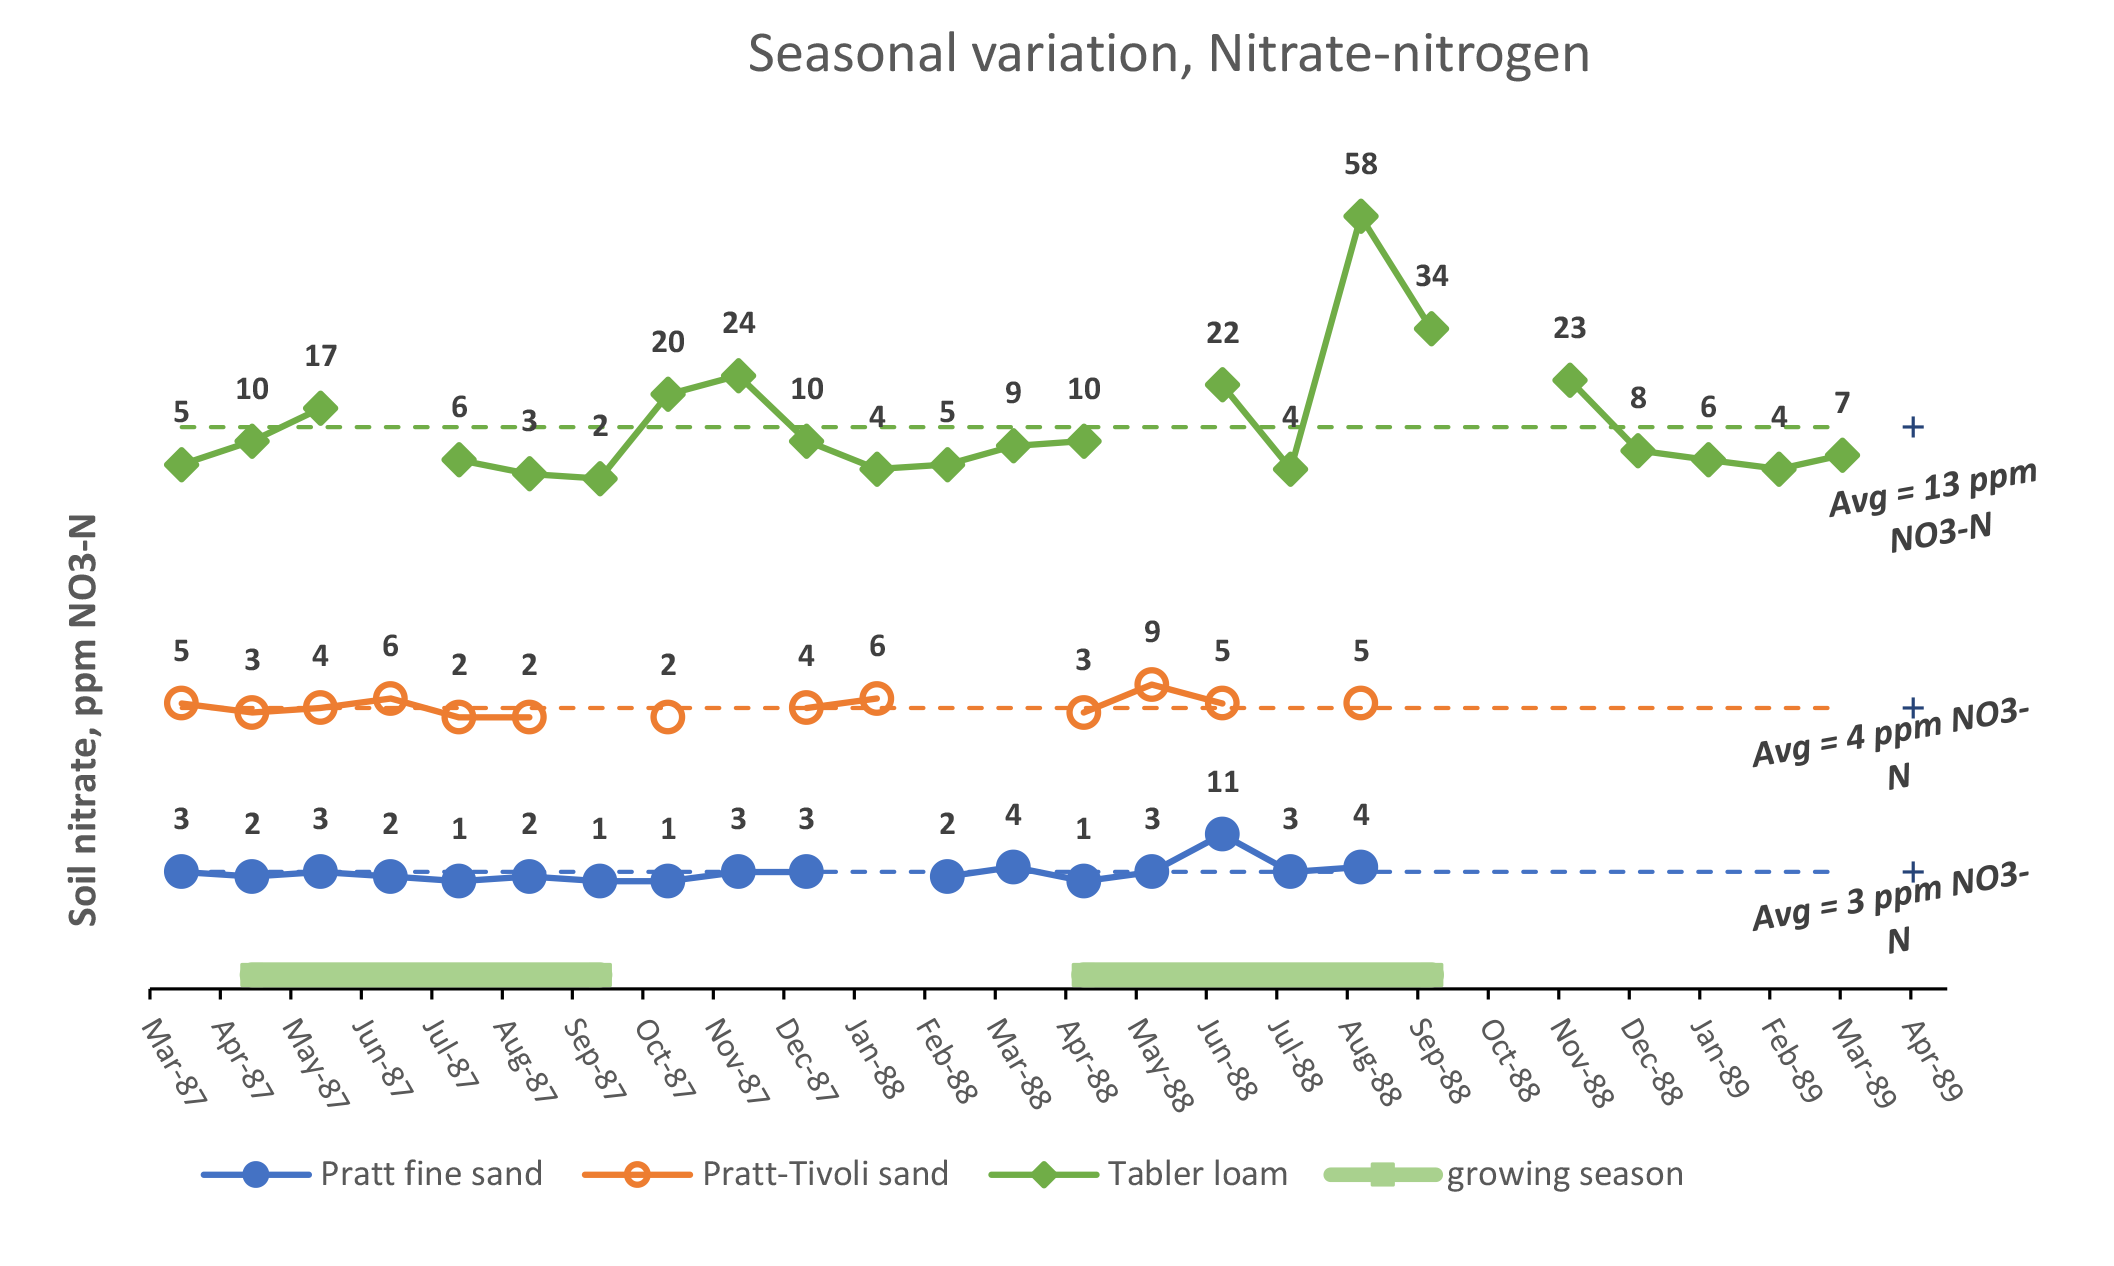
¶ Figure 3a. Seasonal Variation, Nitrate-Nitrogen
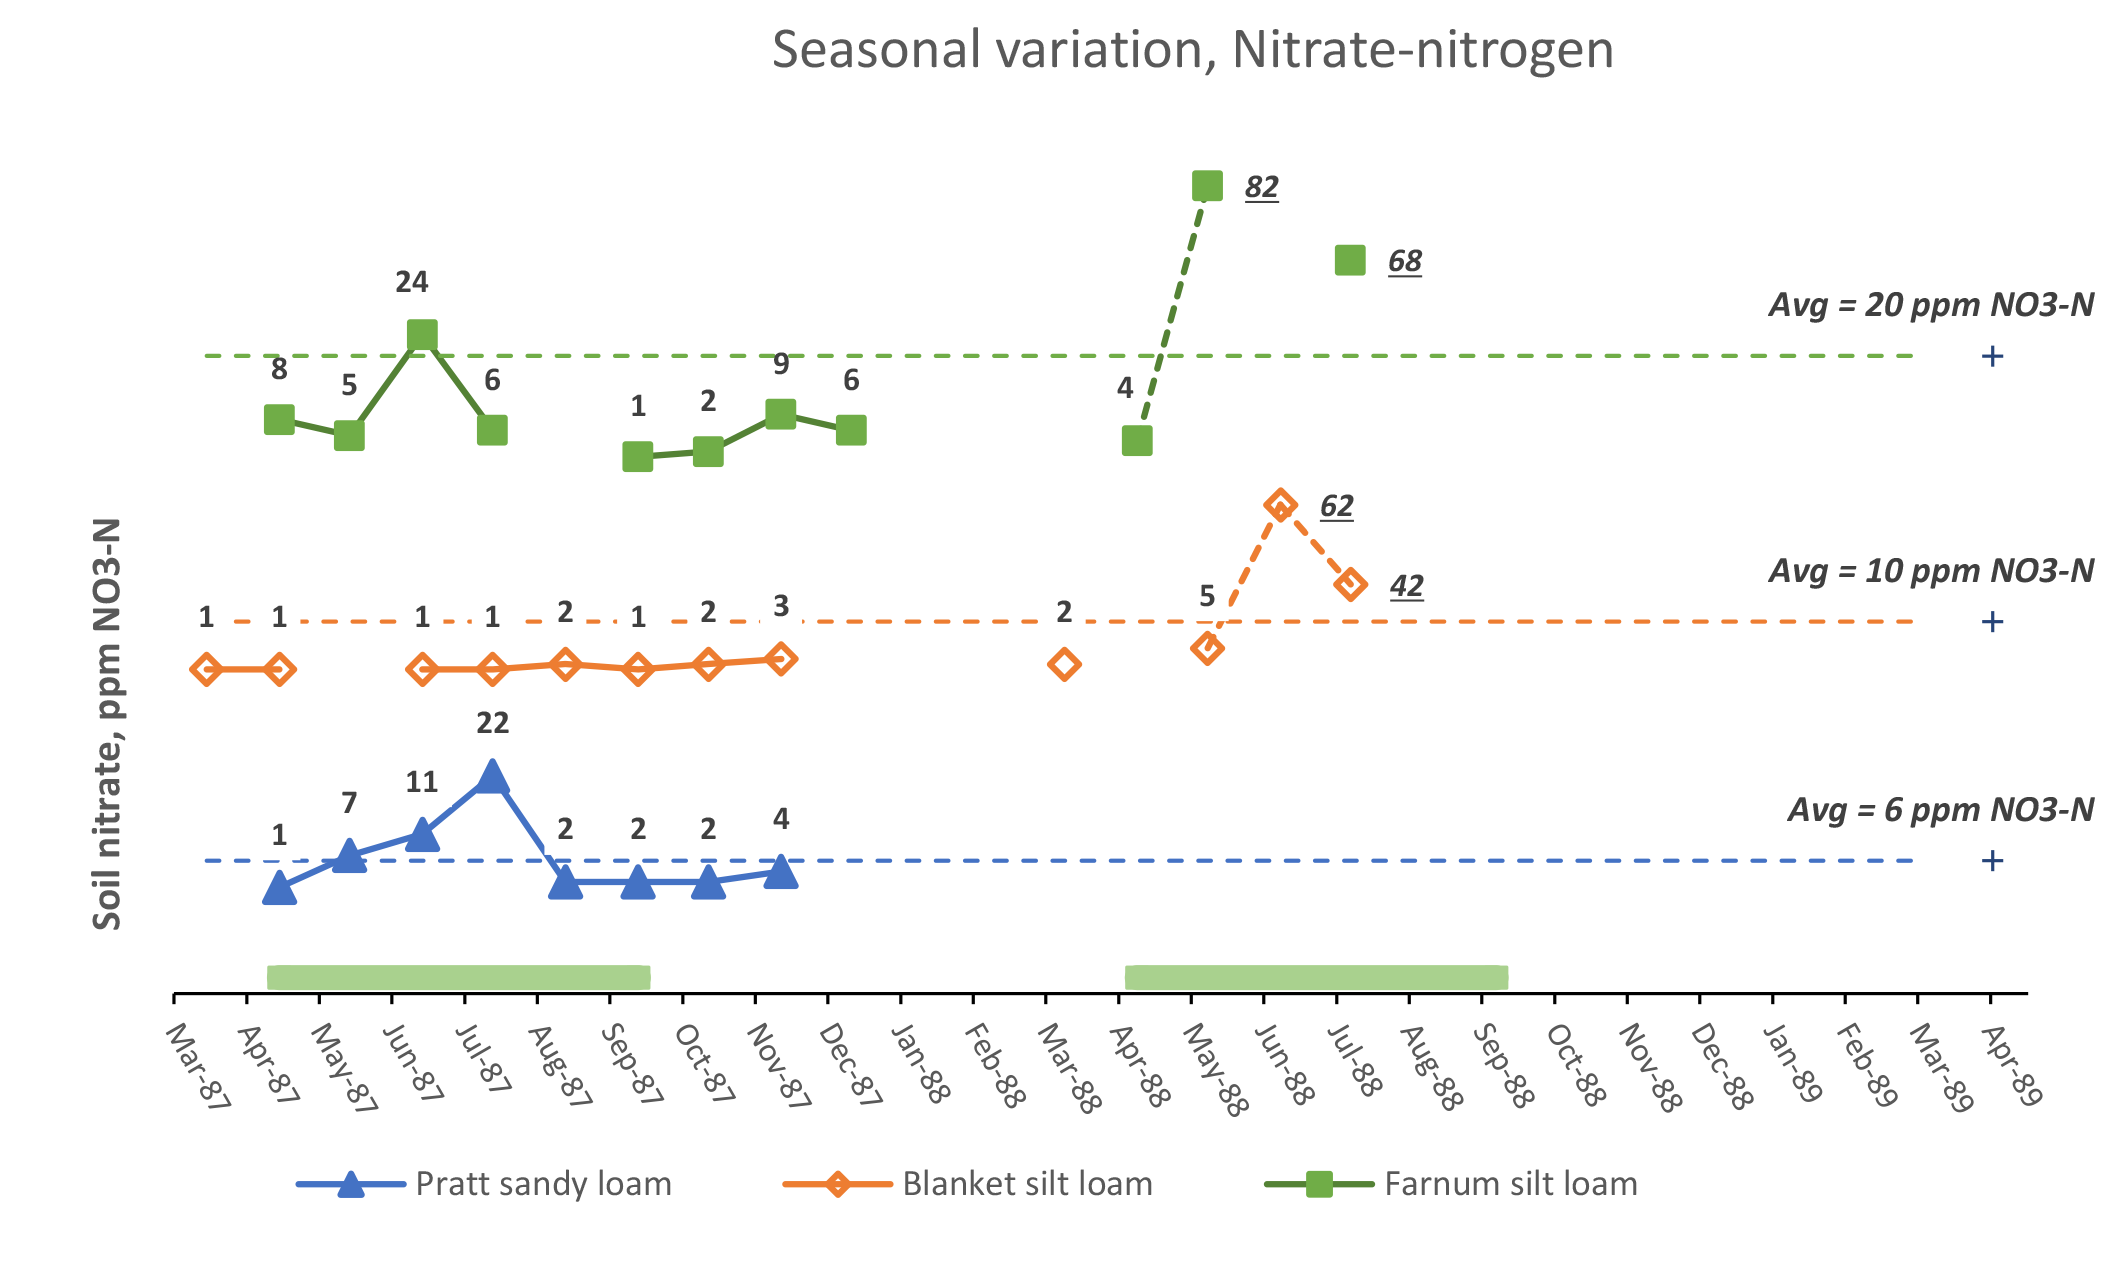
¶ Figure 3b. Seasonal Variation, Nitrate-Nitrogen
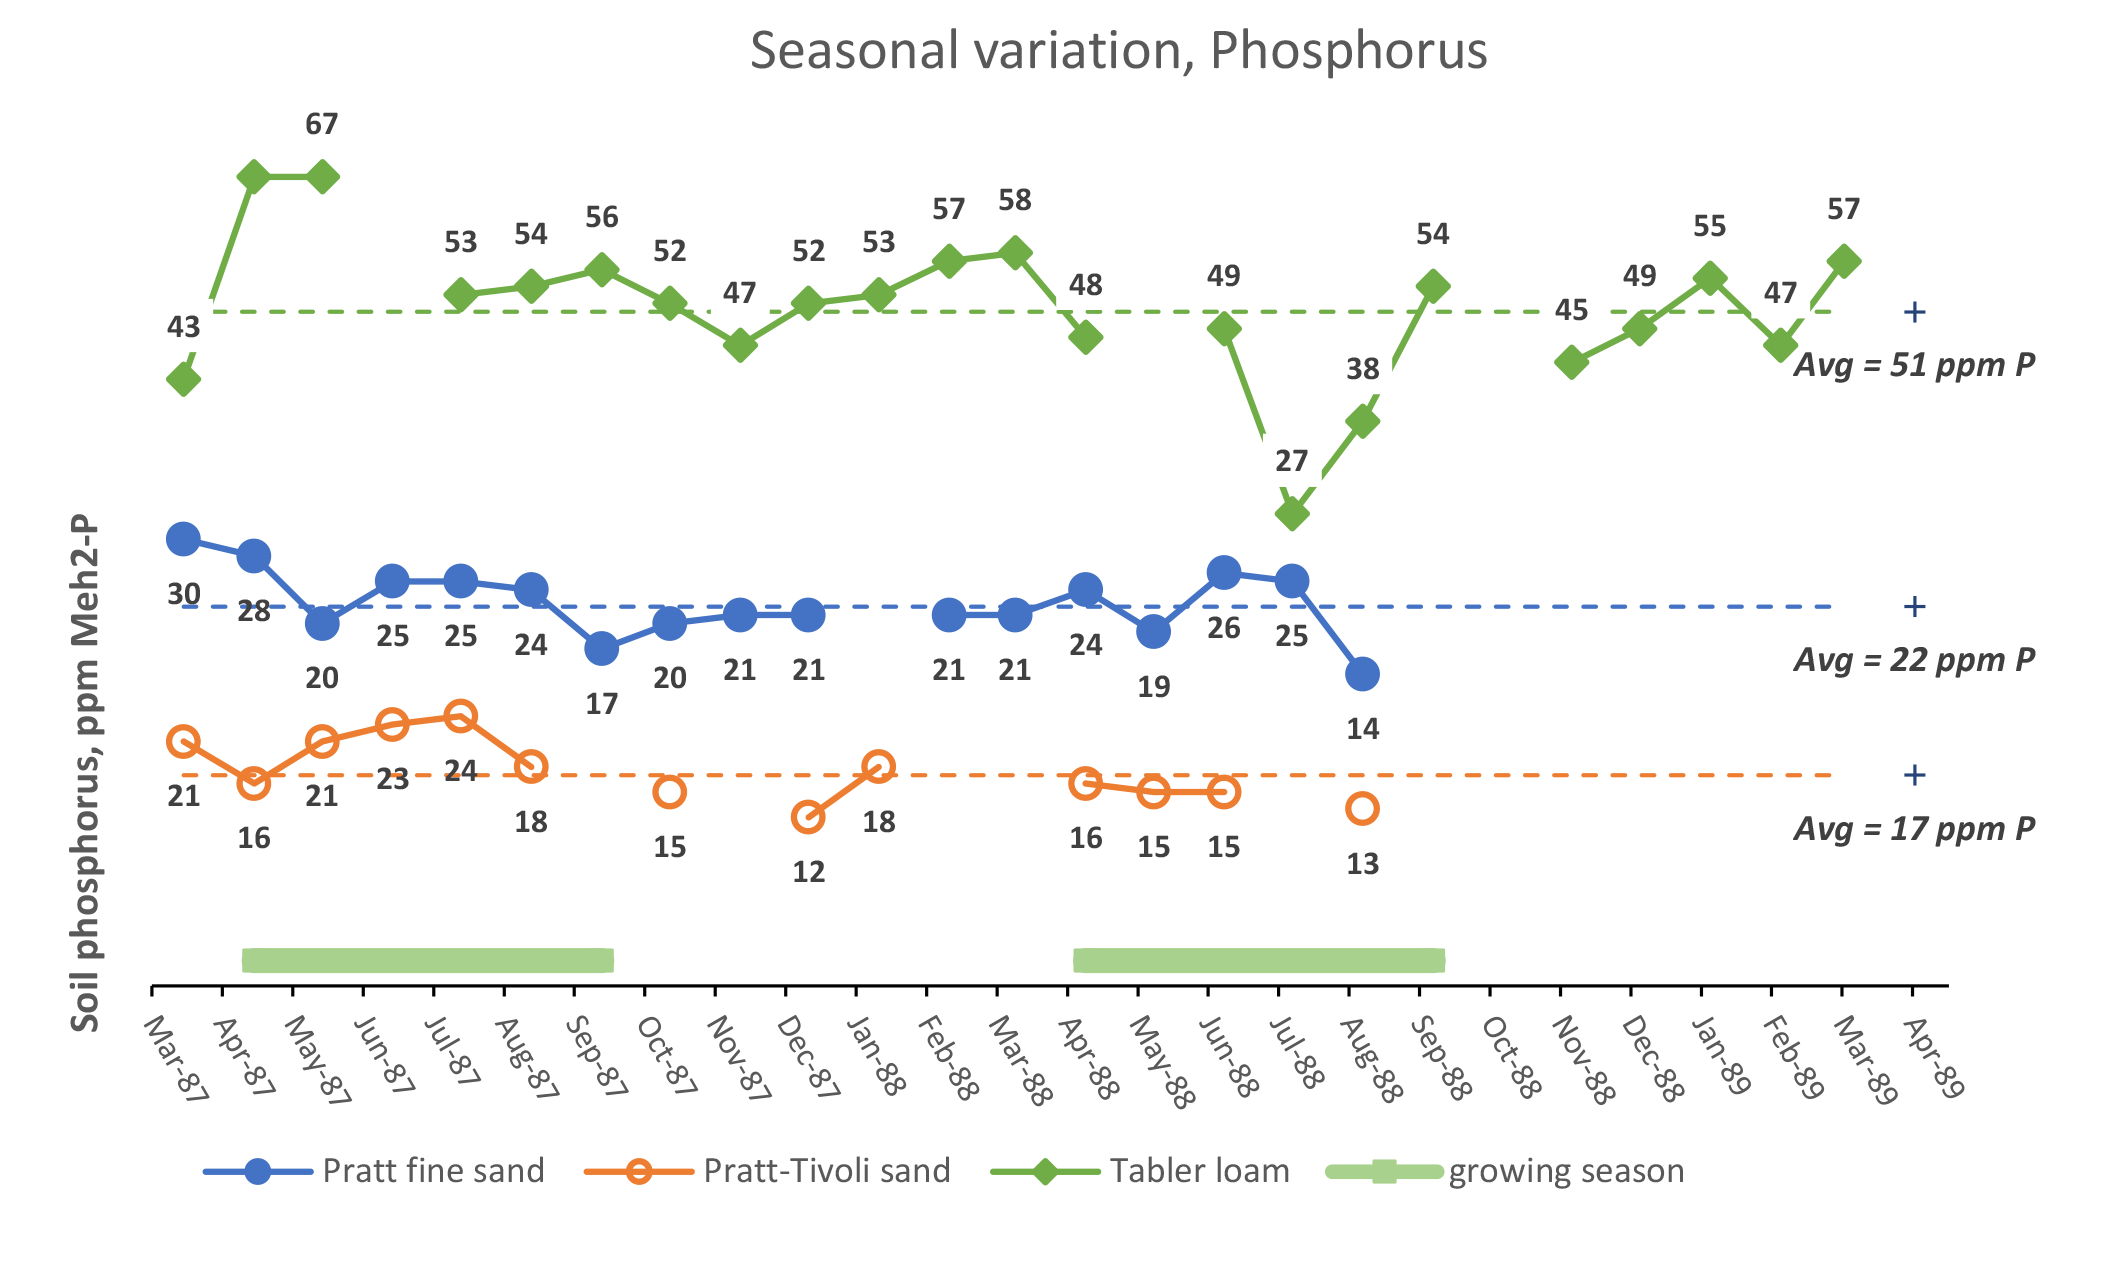
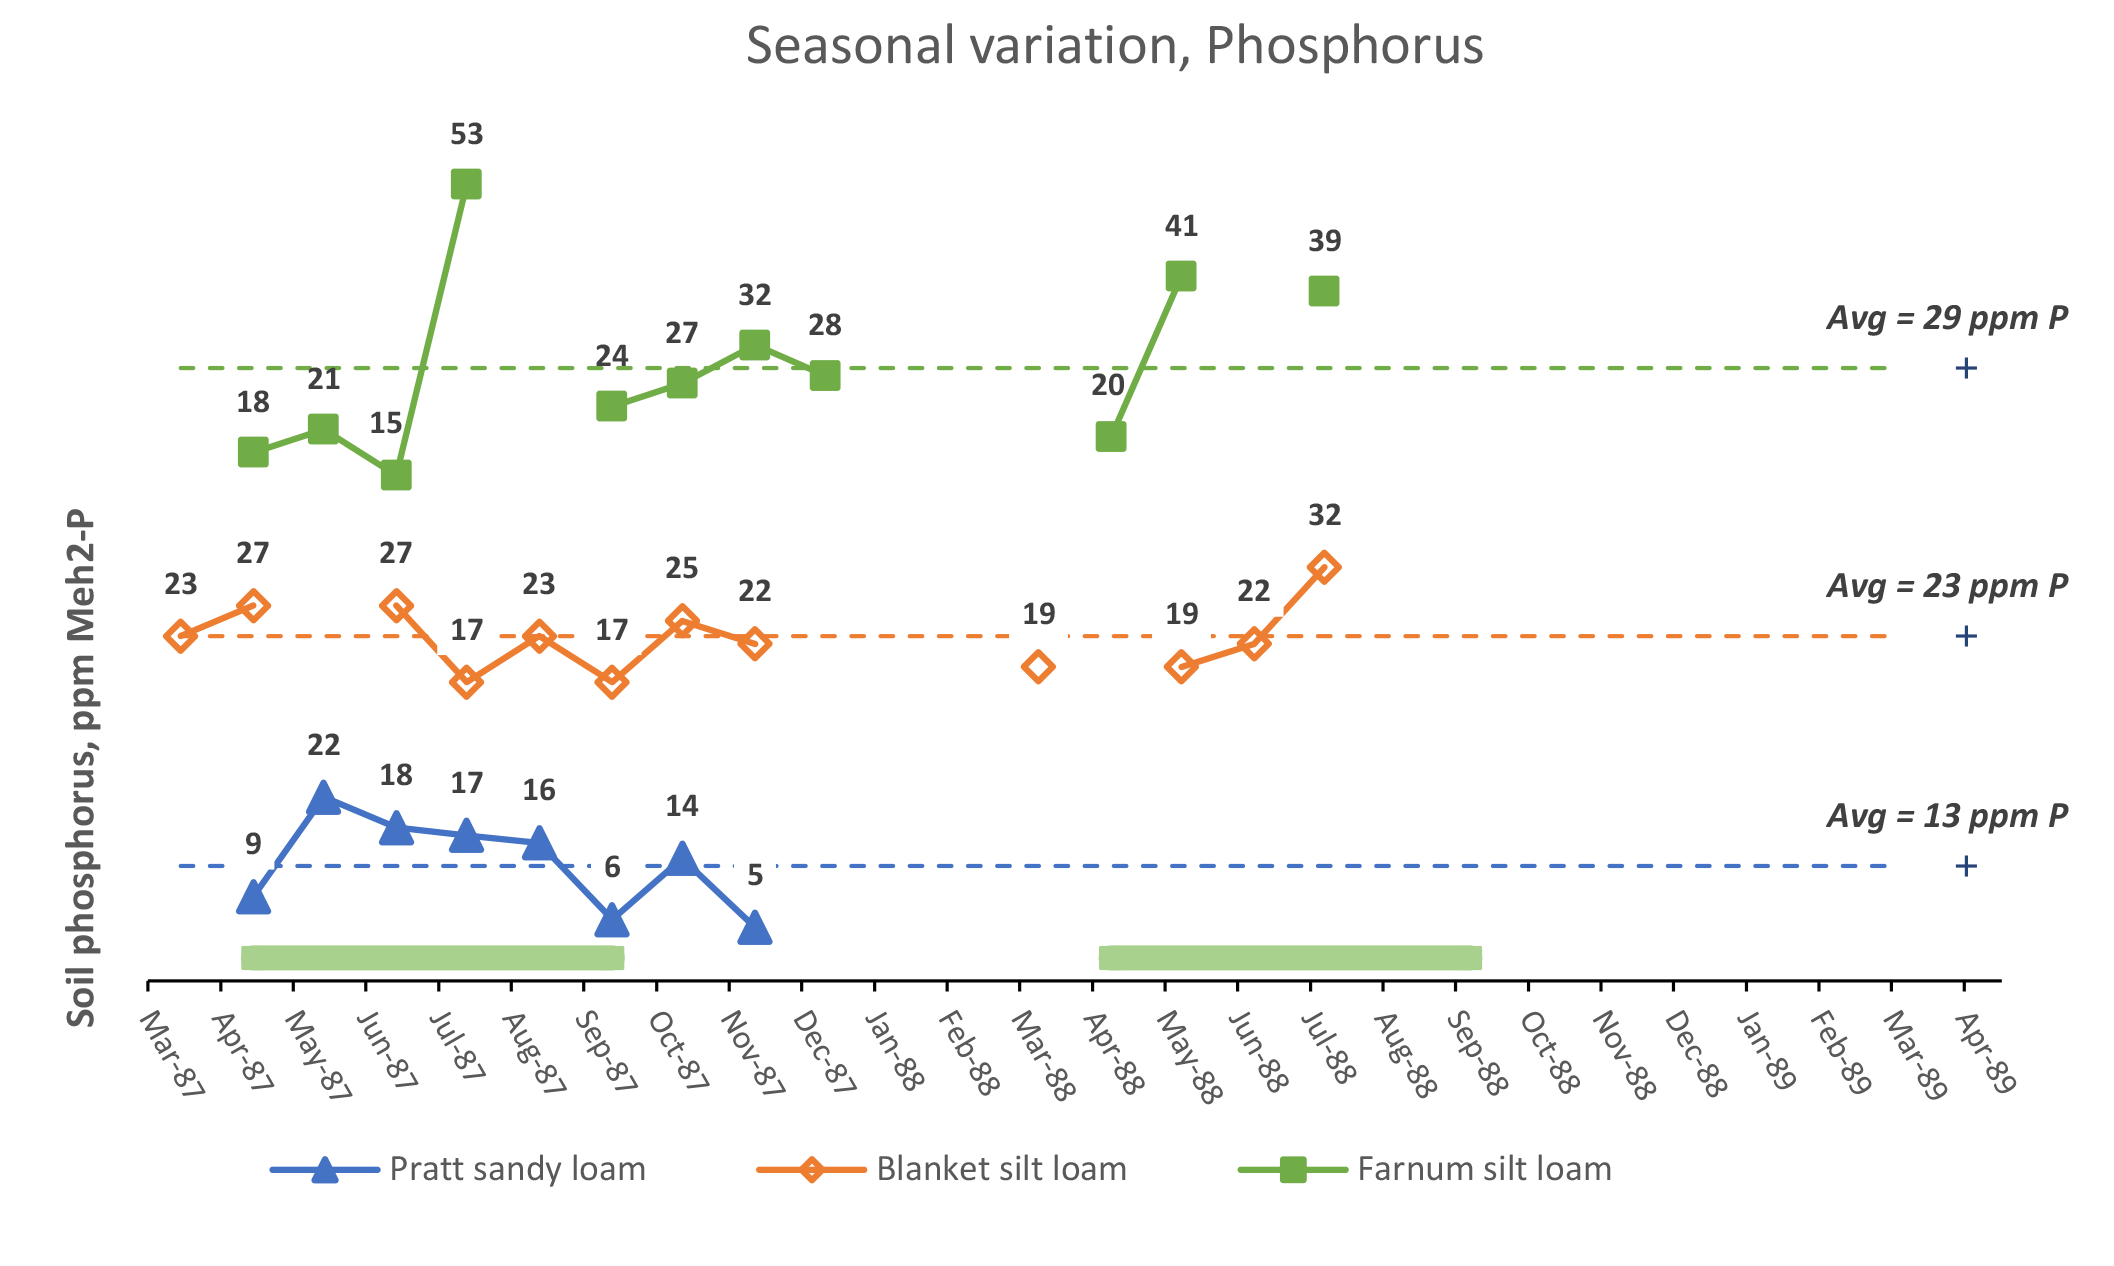
¶ Figure 4a. Seasonal Variation, Phosphorus
¶ Figure 4b. Seasonal Variation, Phosphorus
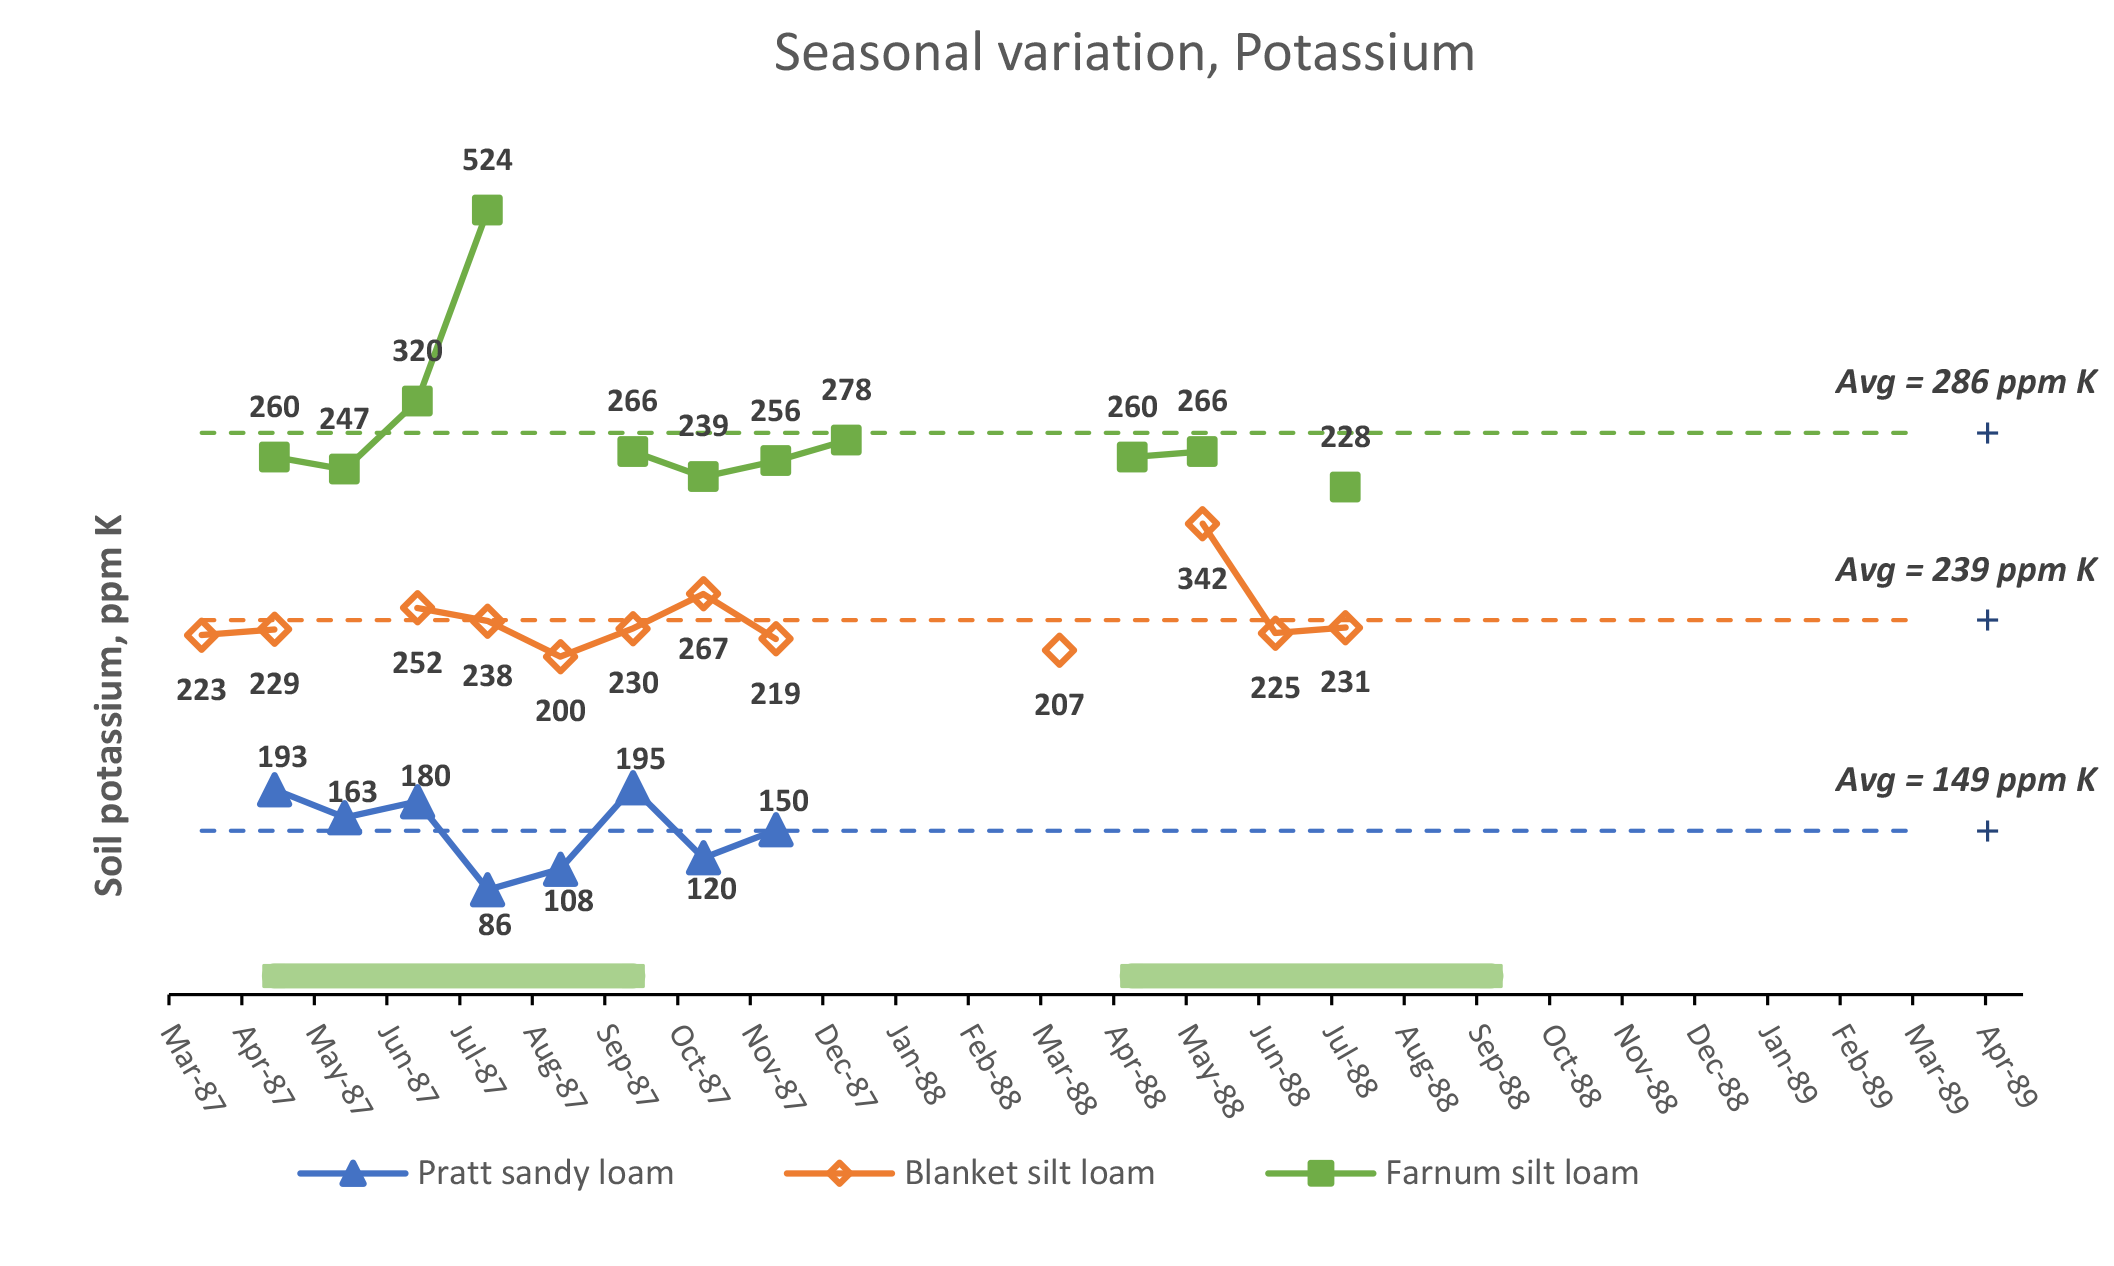
¶ Figure 5a. Seasonal Variation, Potassium
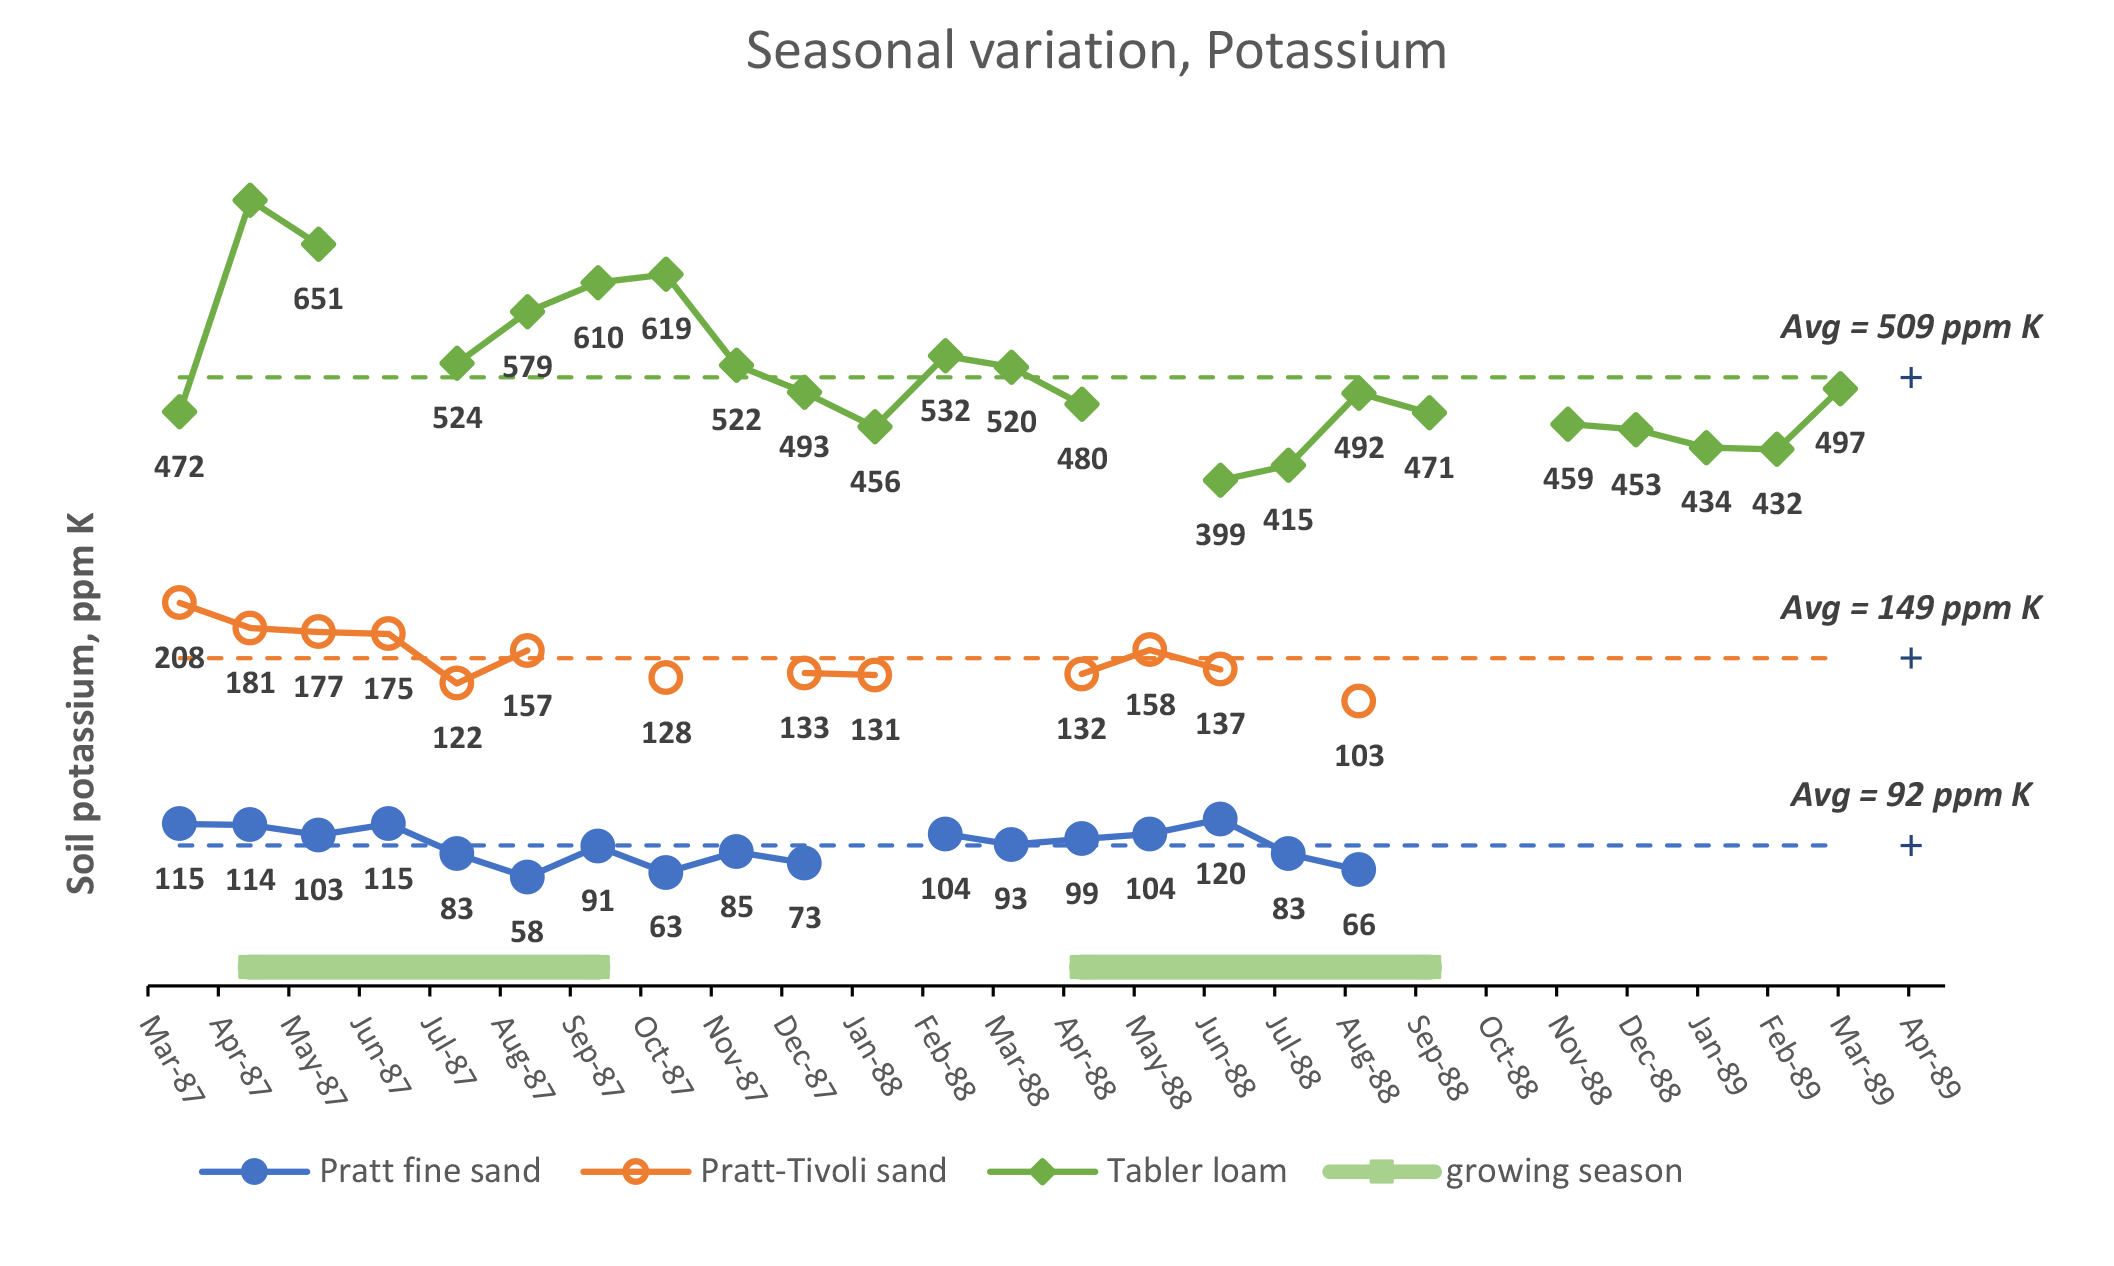
¶ Figure 5b. Seasonal Variation, Potassium
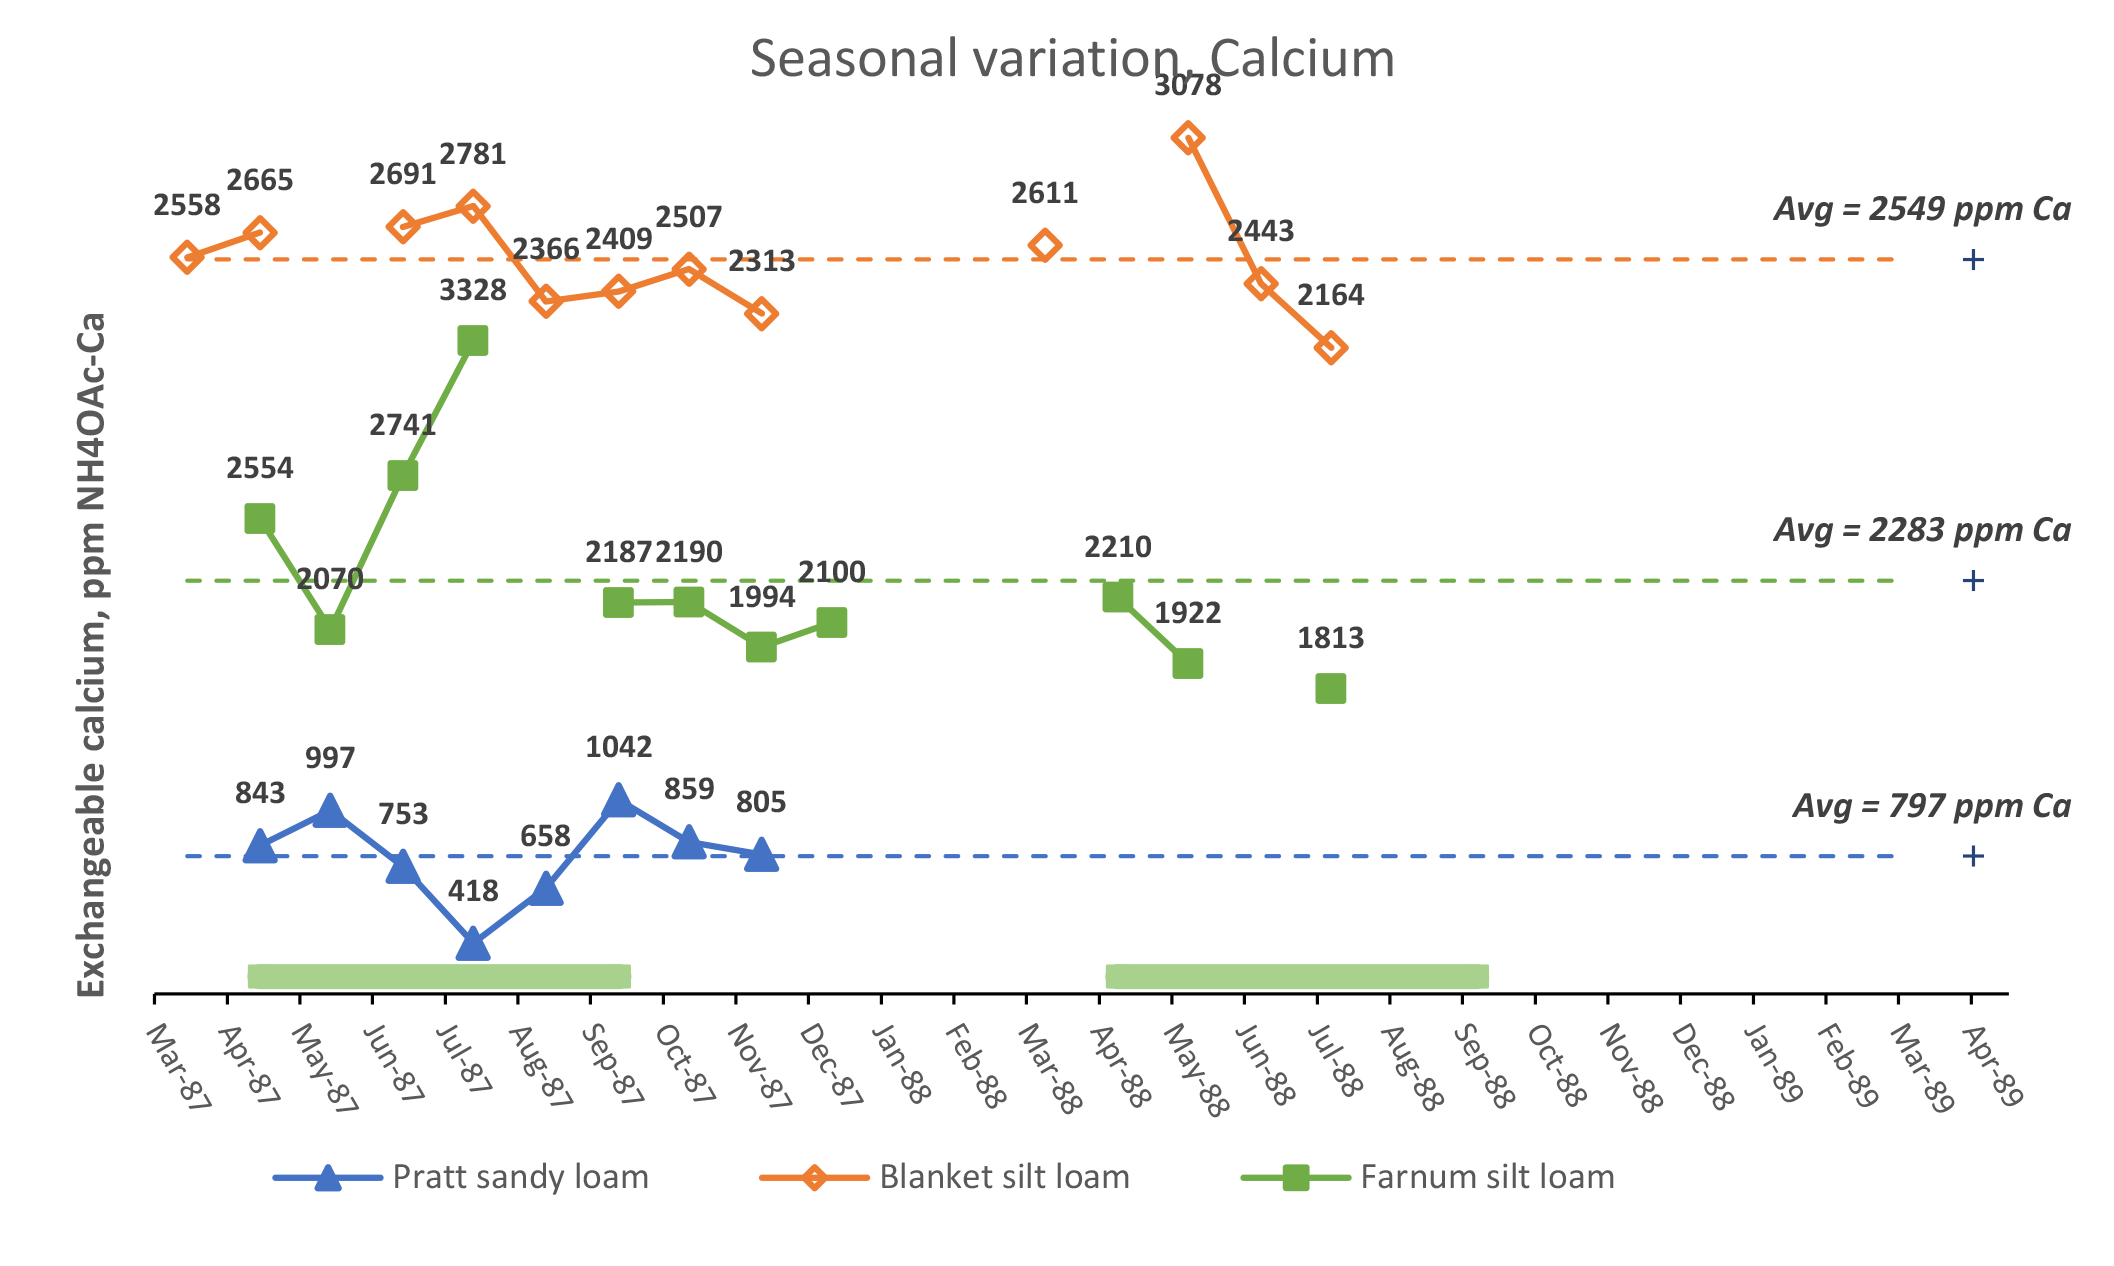
¶ Figure 6a. Seasonal Variation, Calcium
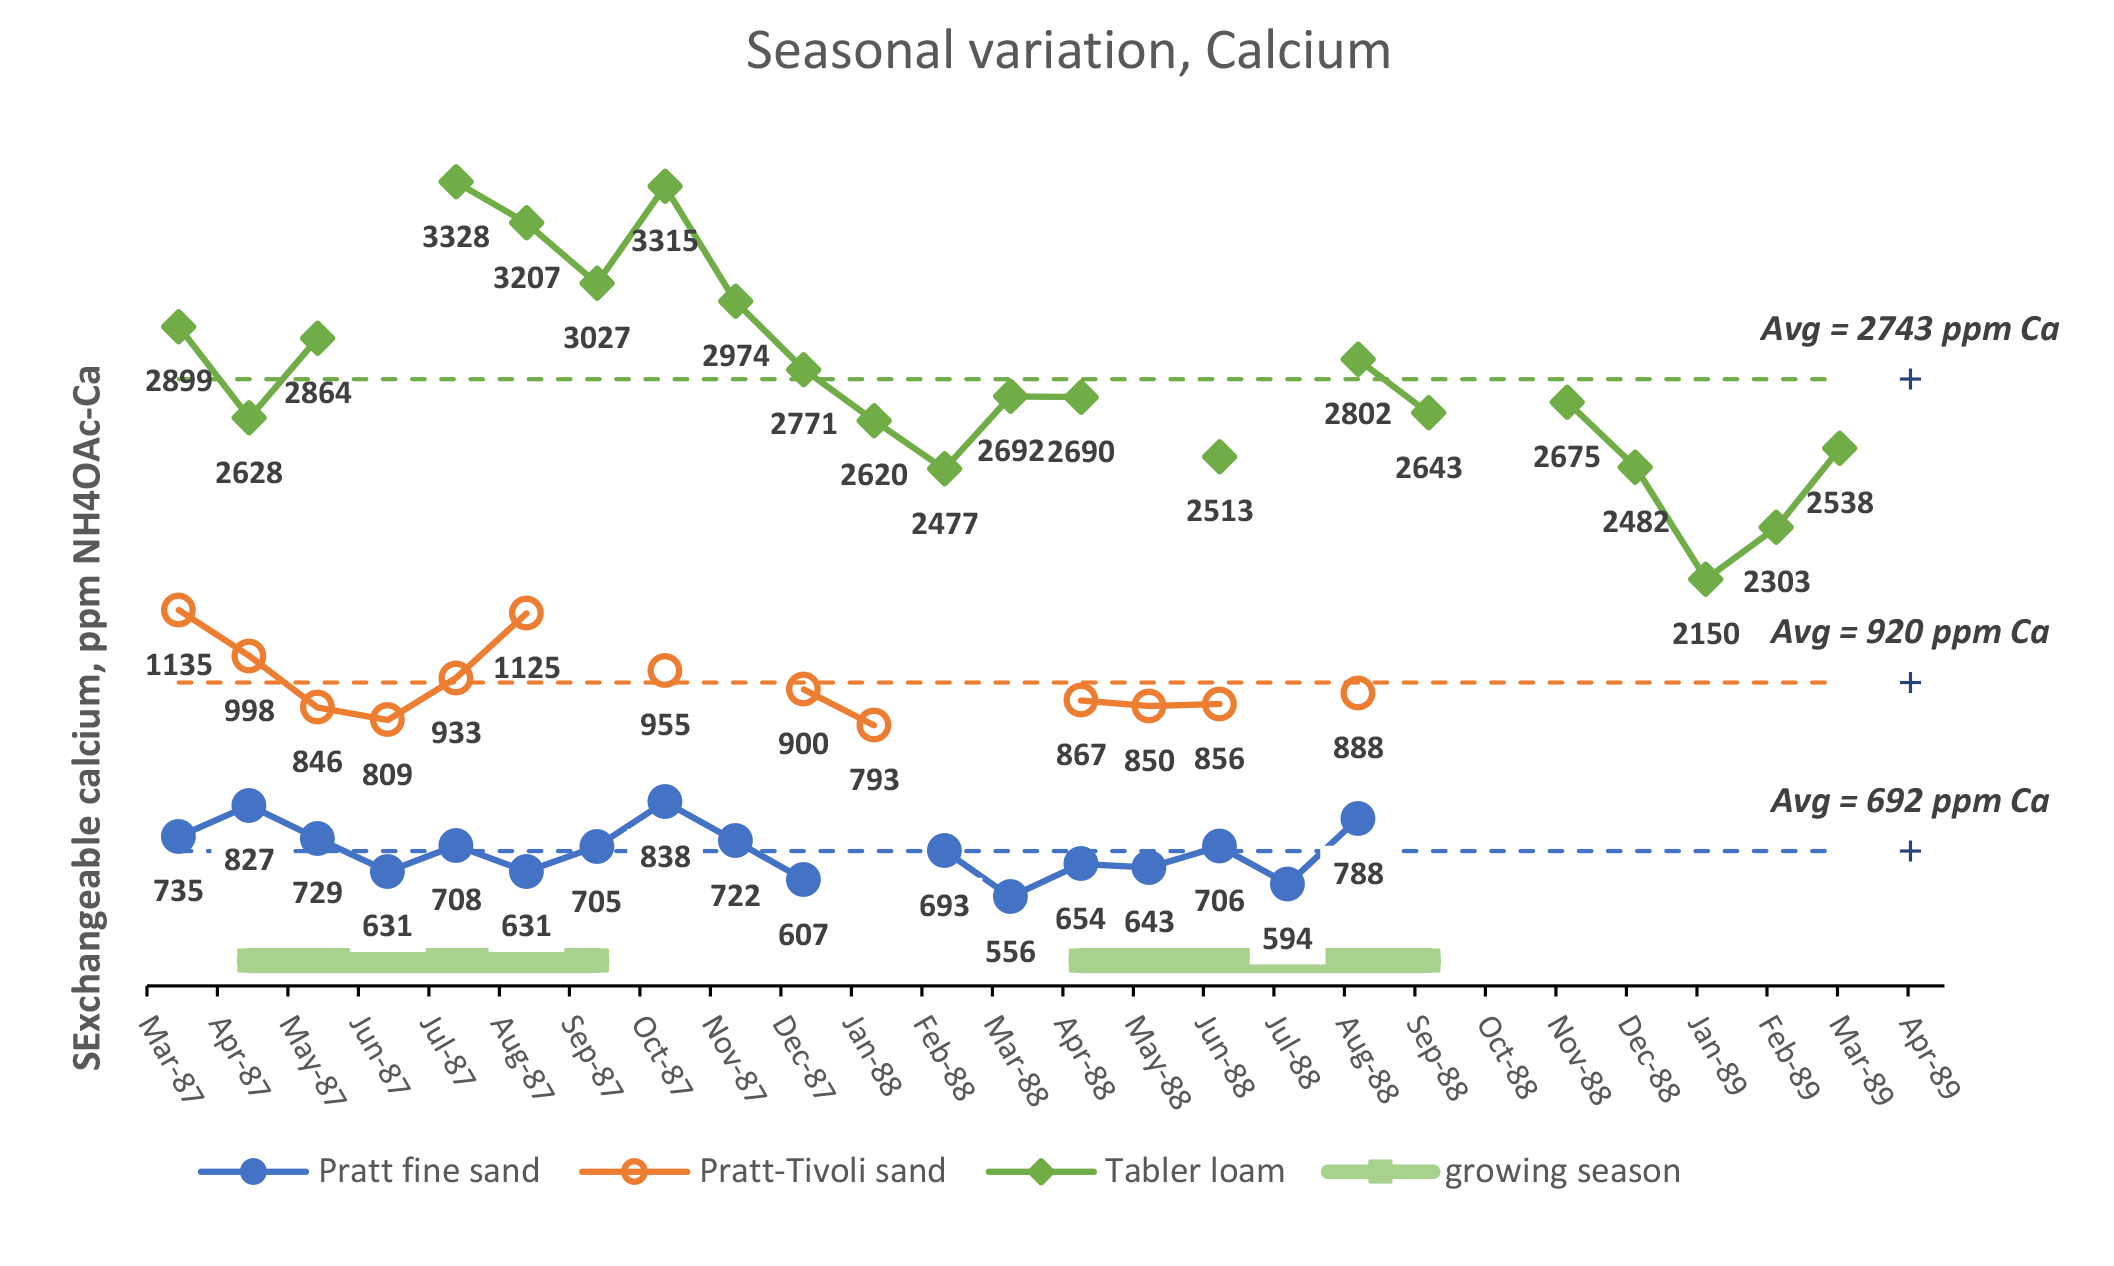
¶ Figure 6b. Seasonal Variation, Calcium
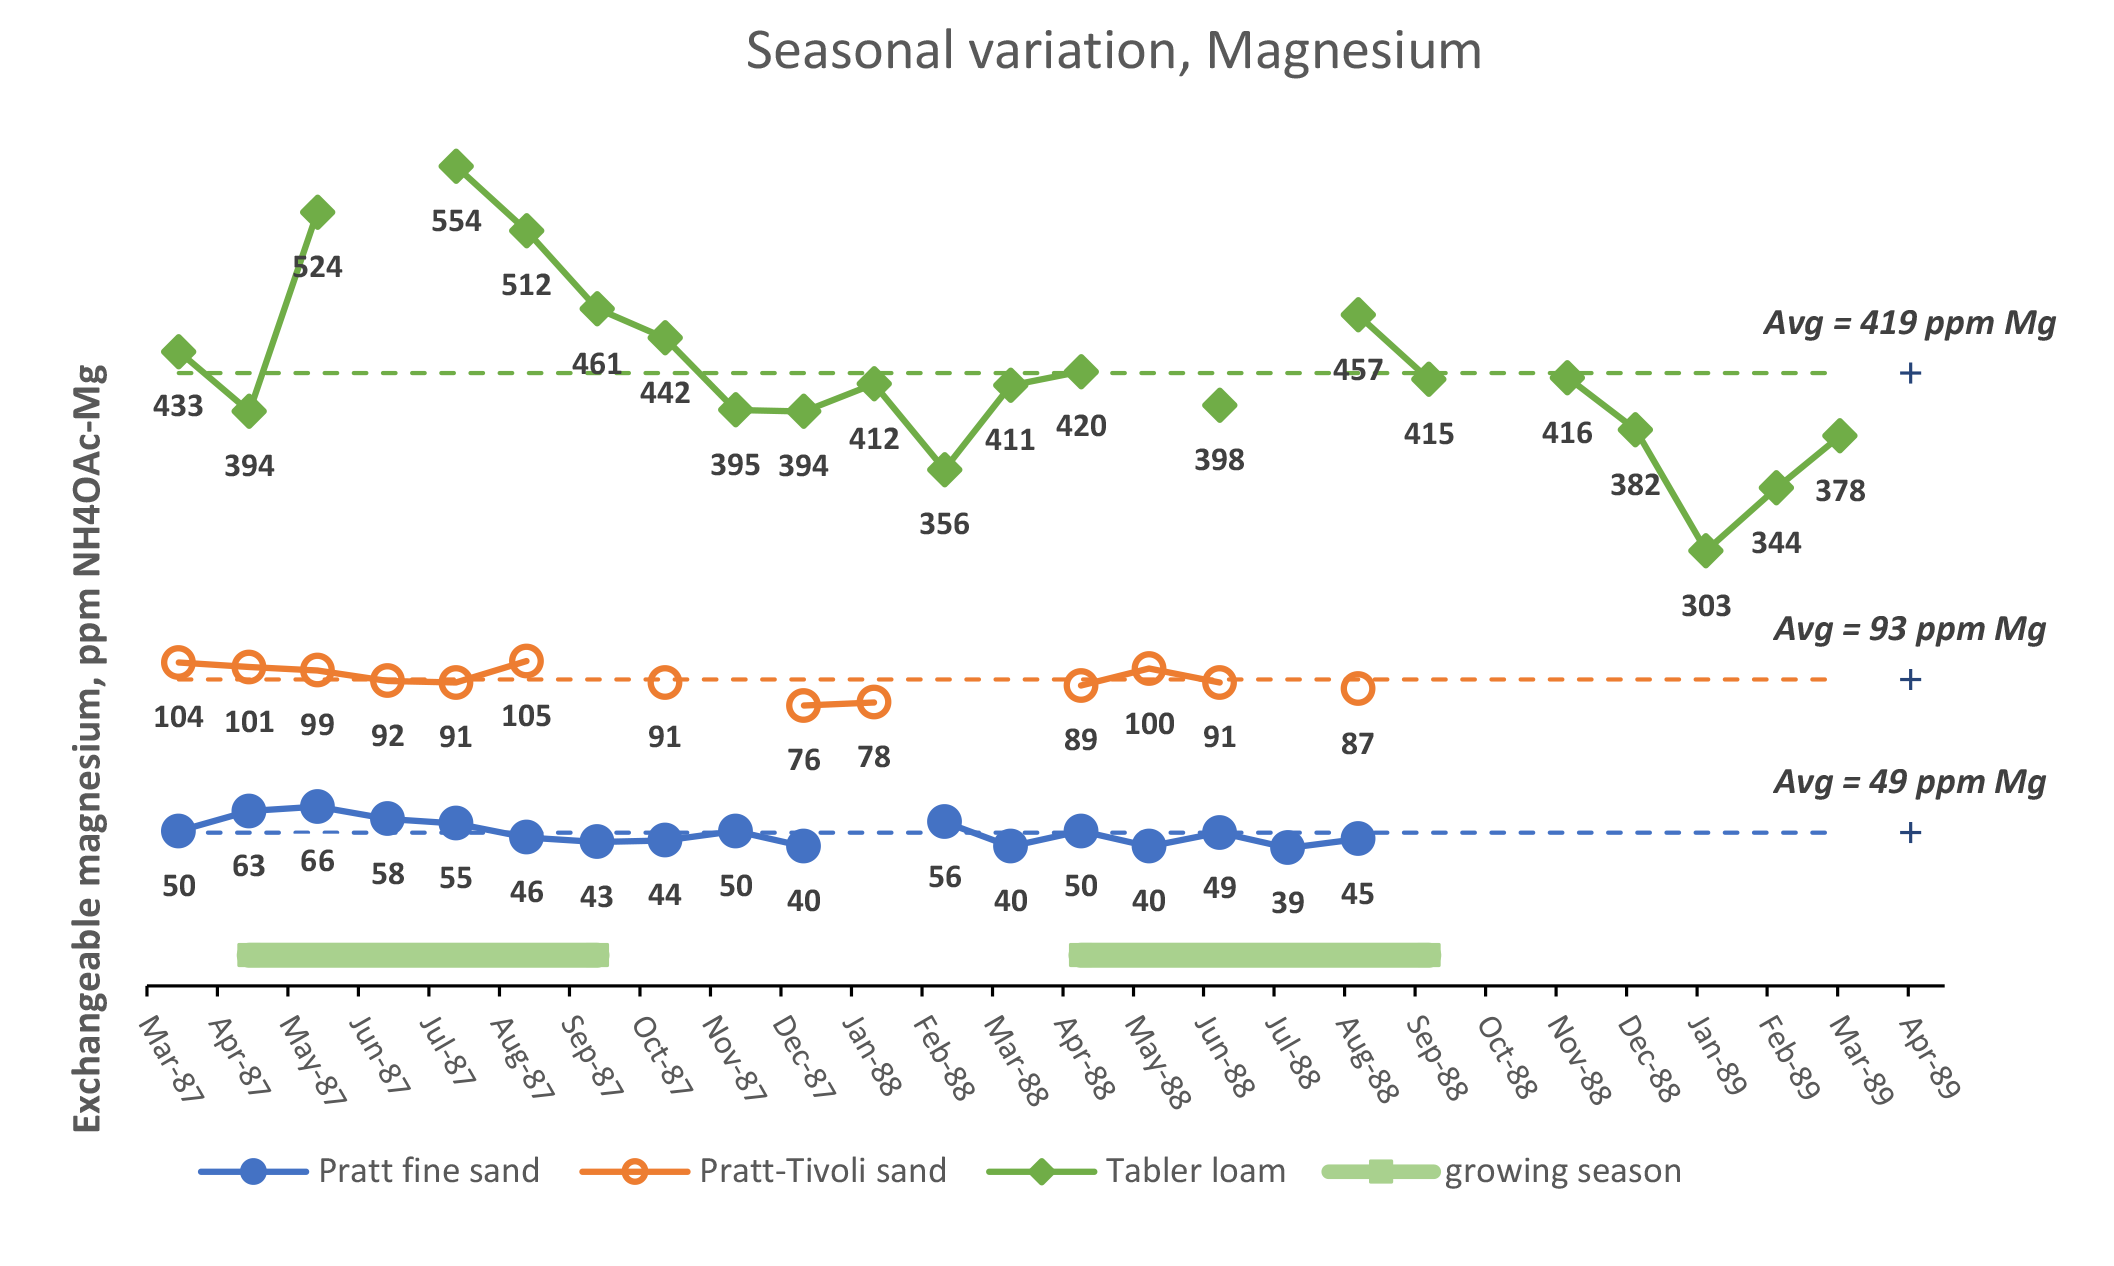
¶ Figure 7a. Seasonal Variation, Magnesium
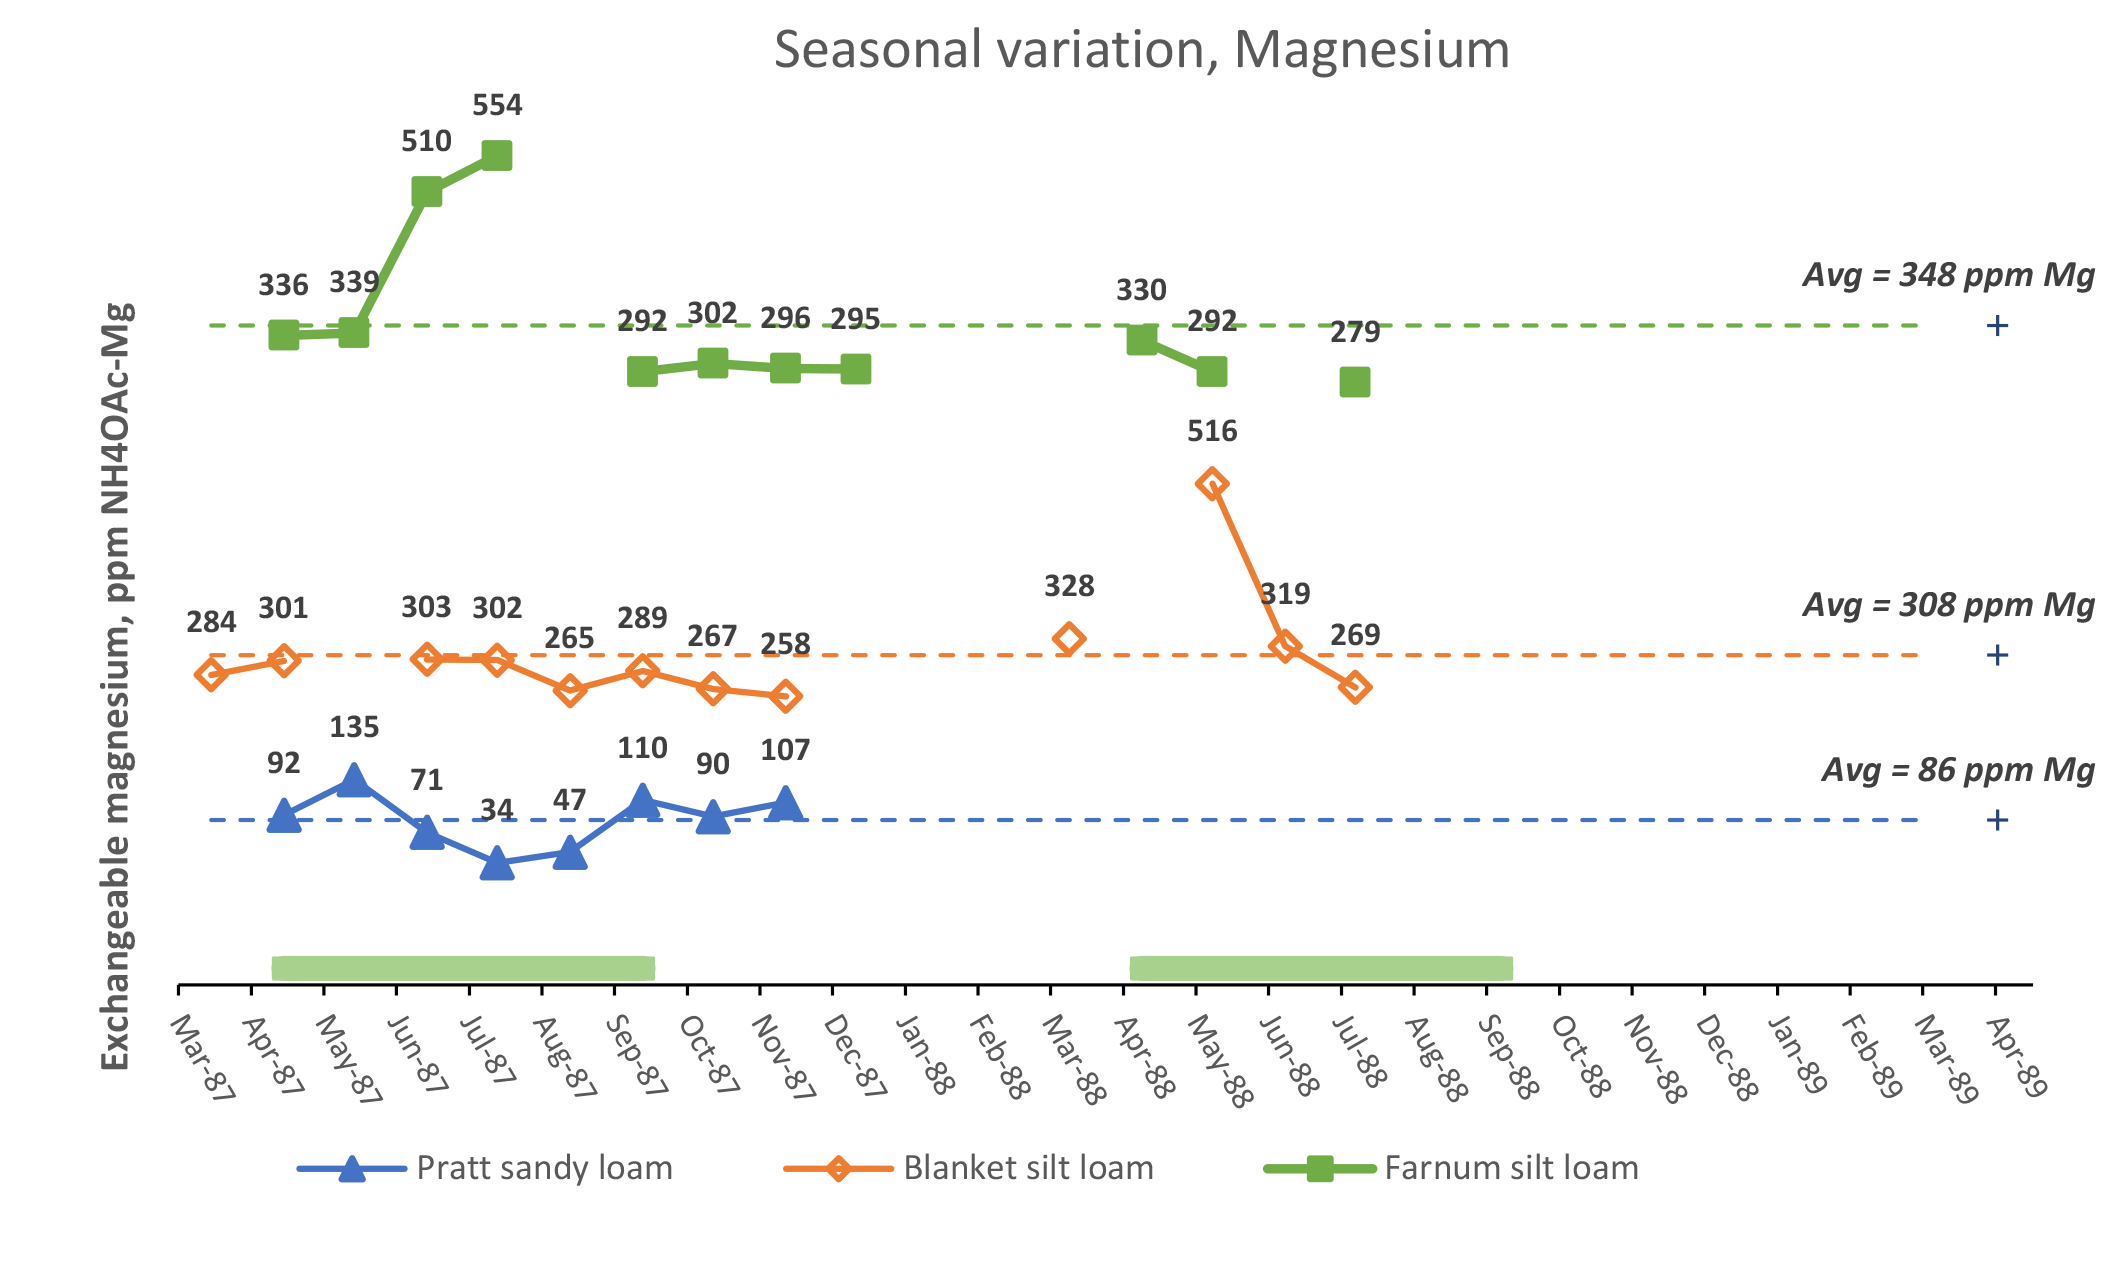
¶ Figure 7b. Seasonal Variation, Magnesium
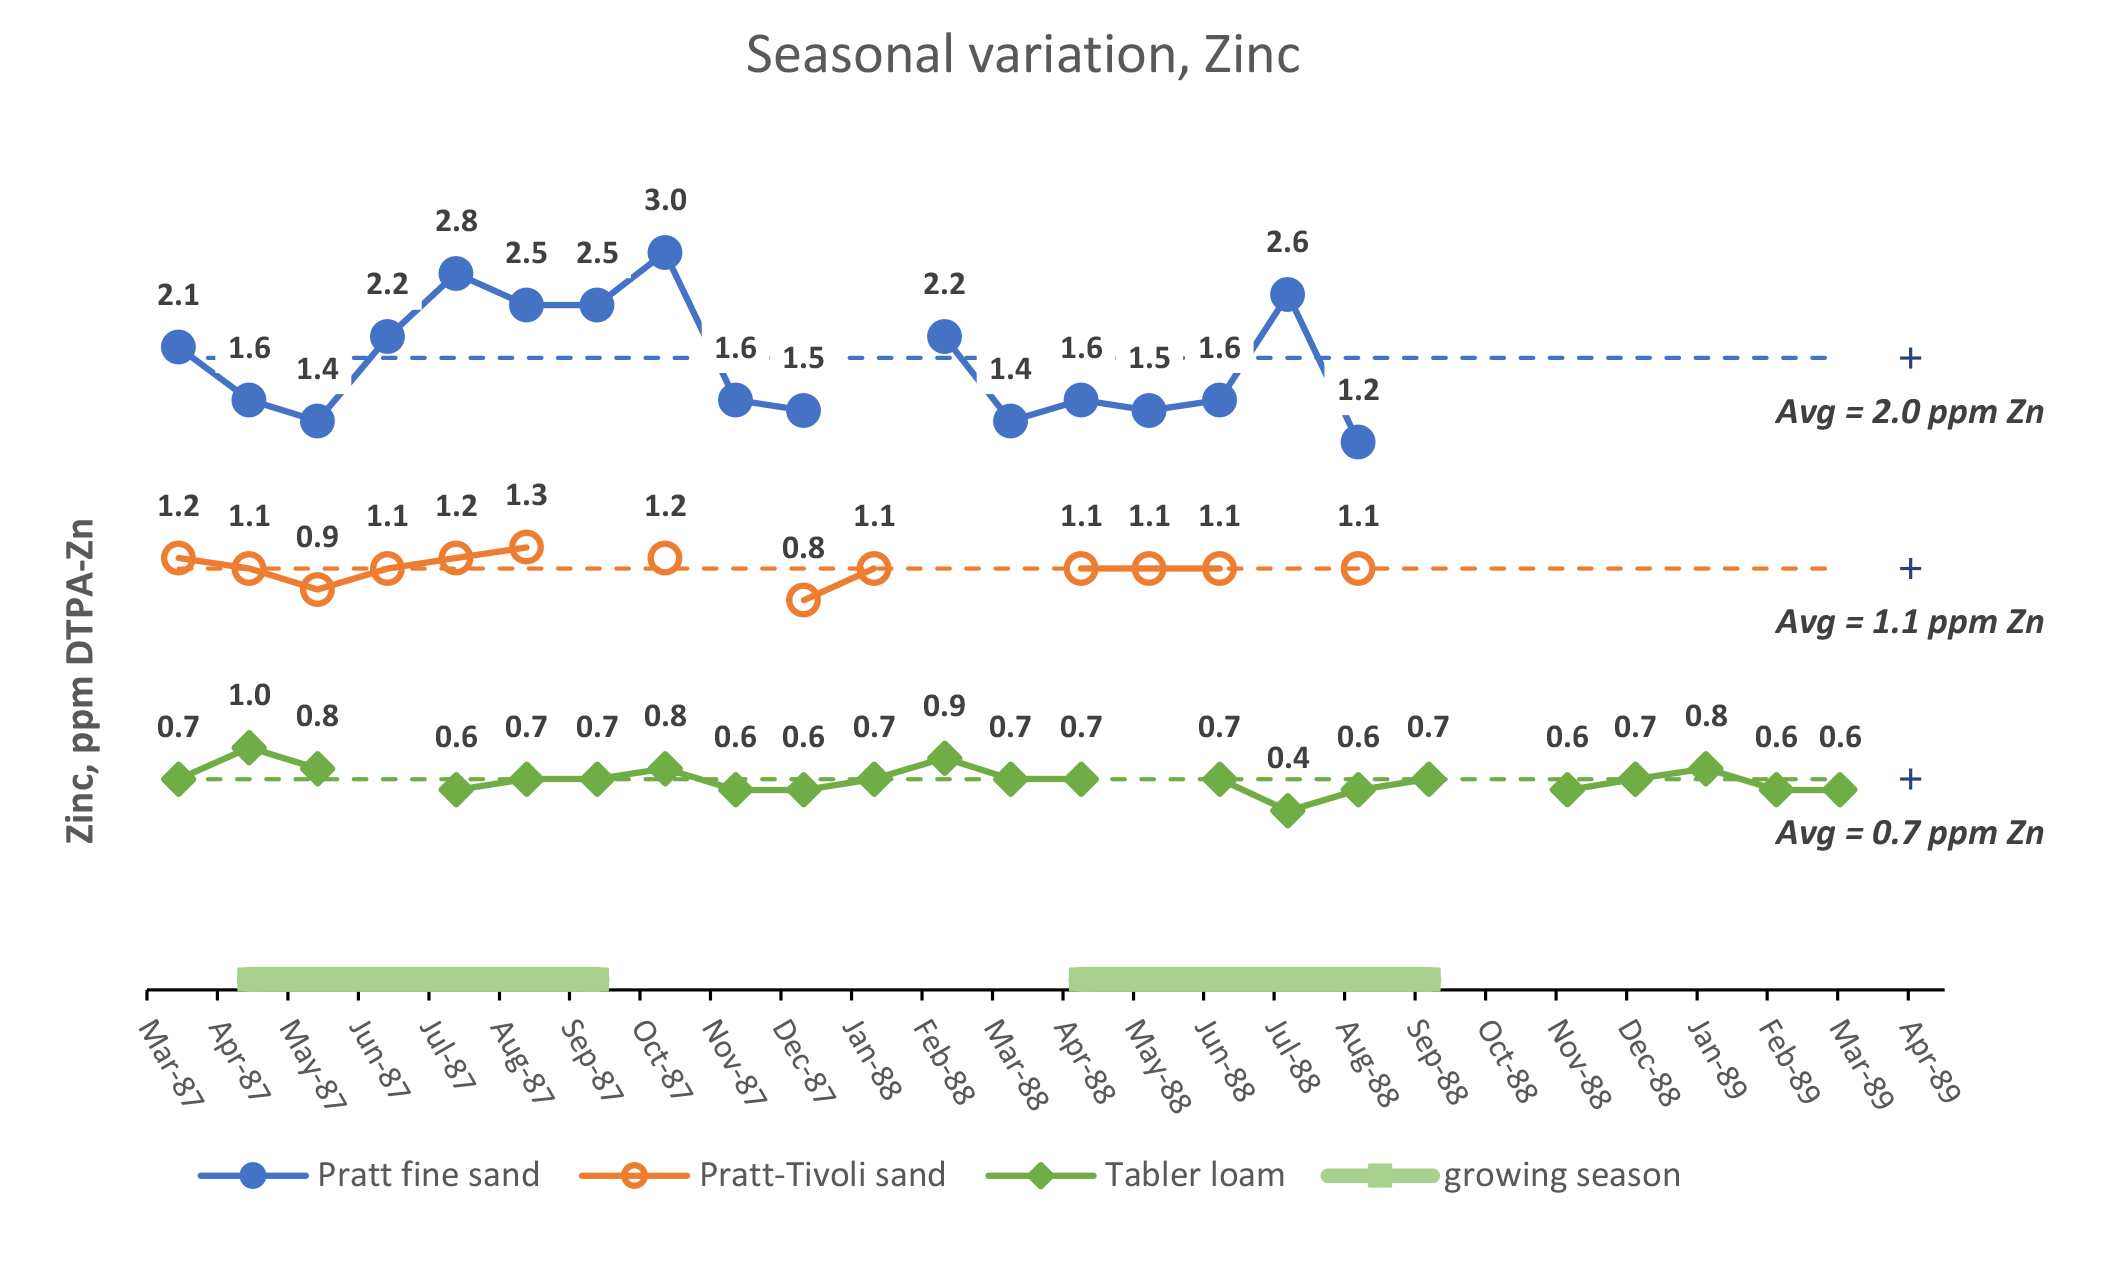
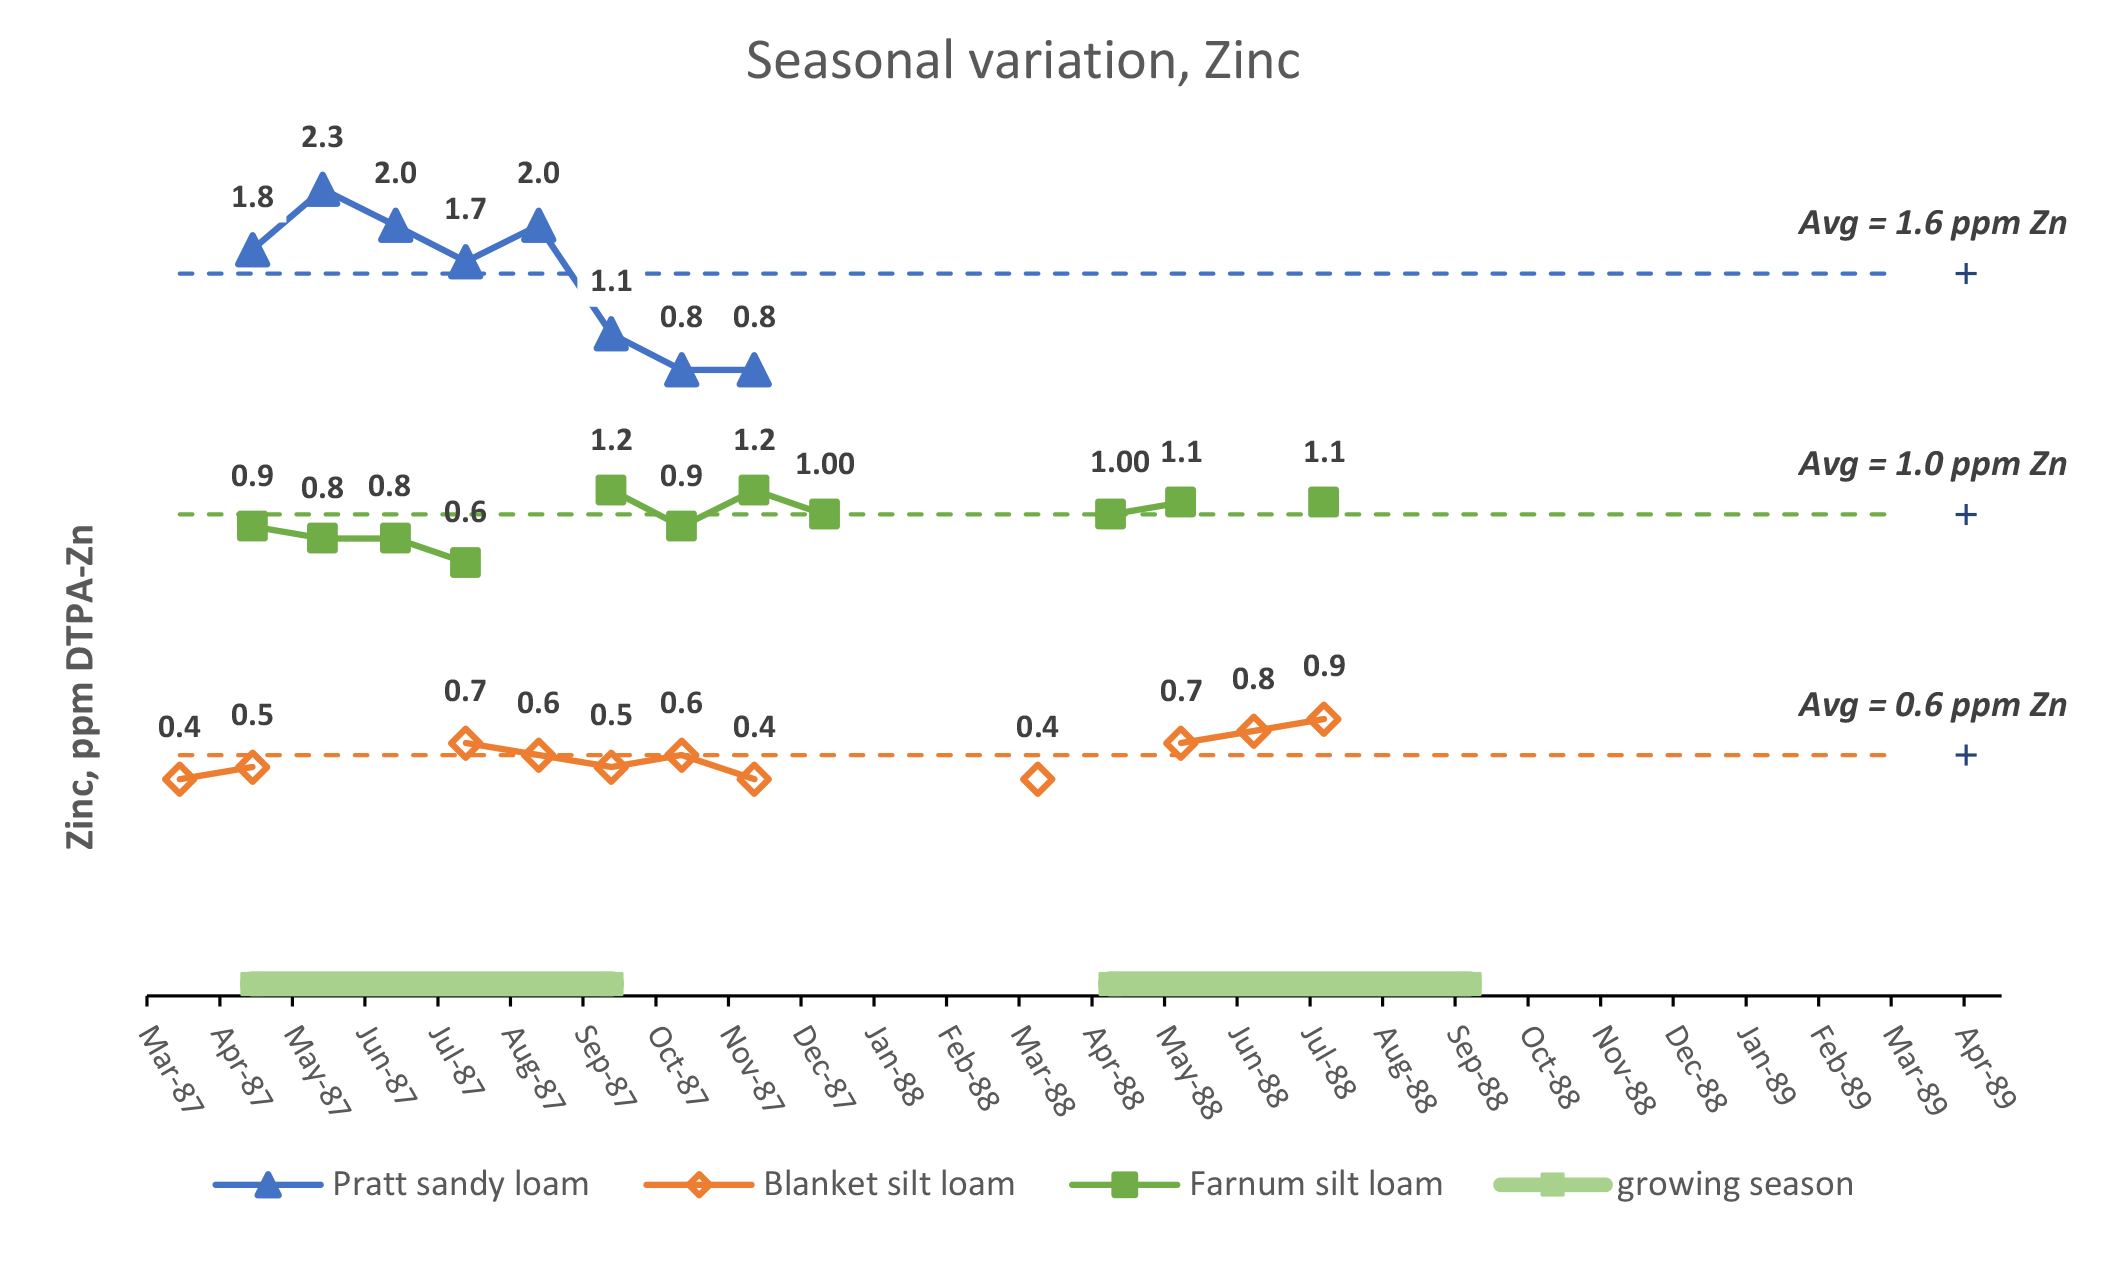
¶ Figure 8a. Seasonal Variation, Zinc
¶ Figure 8b. Seasonal Variation, Zinc
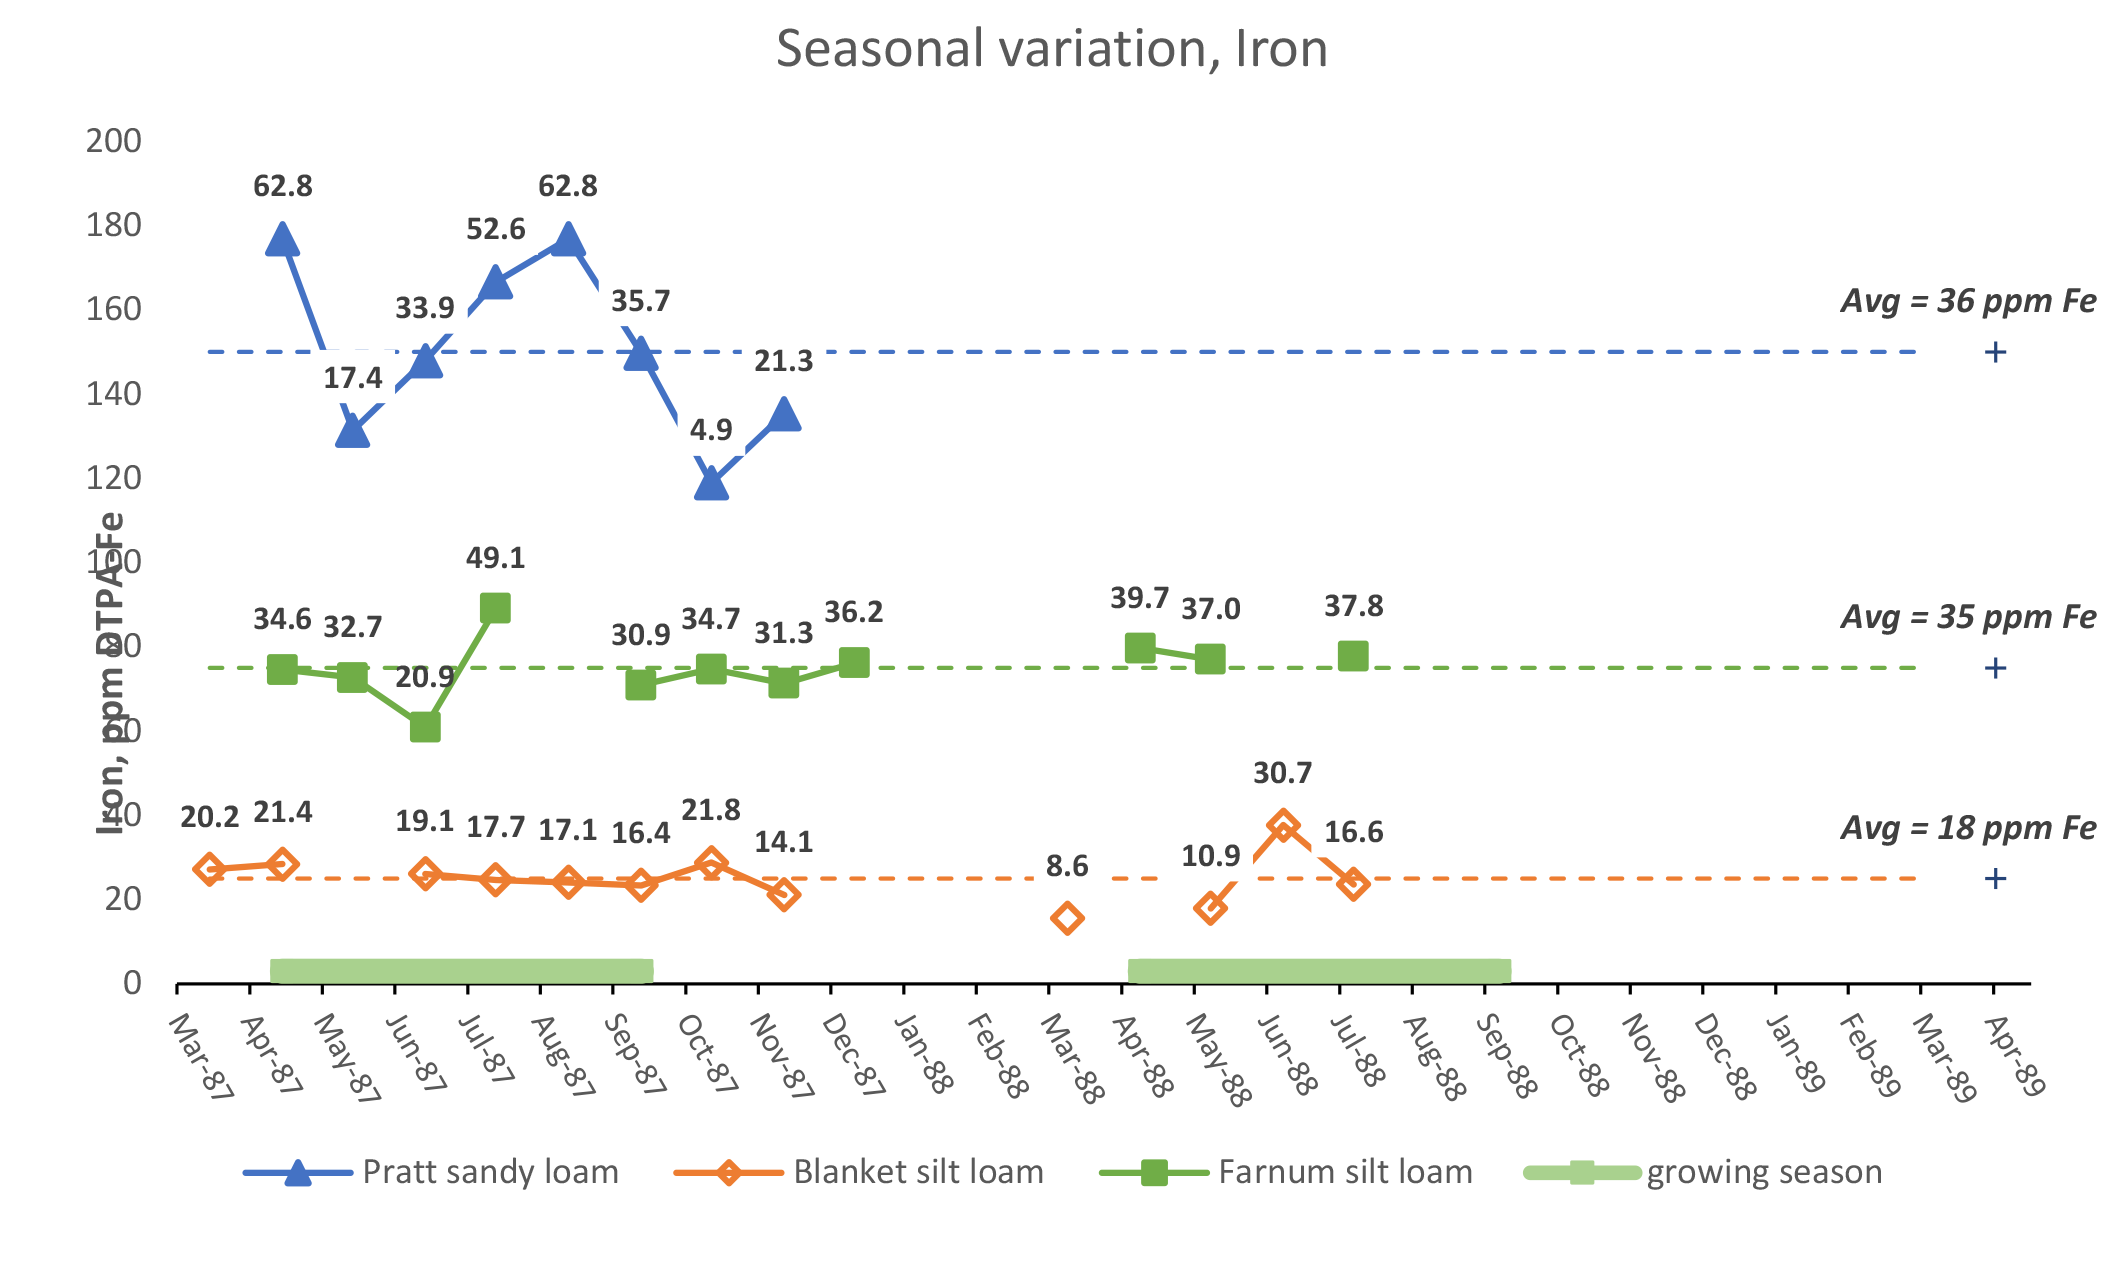
¶ Figure 9a. Seasonal Variation, Iron
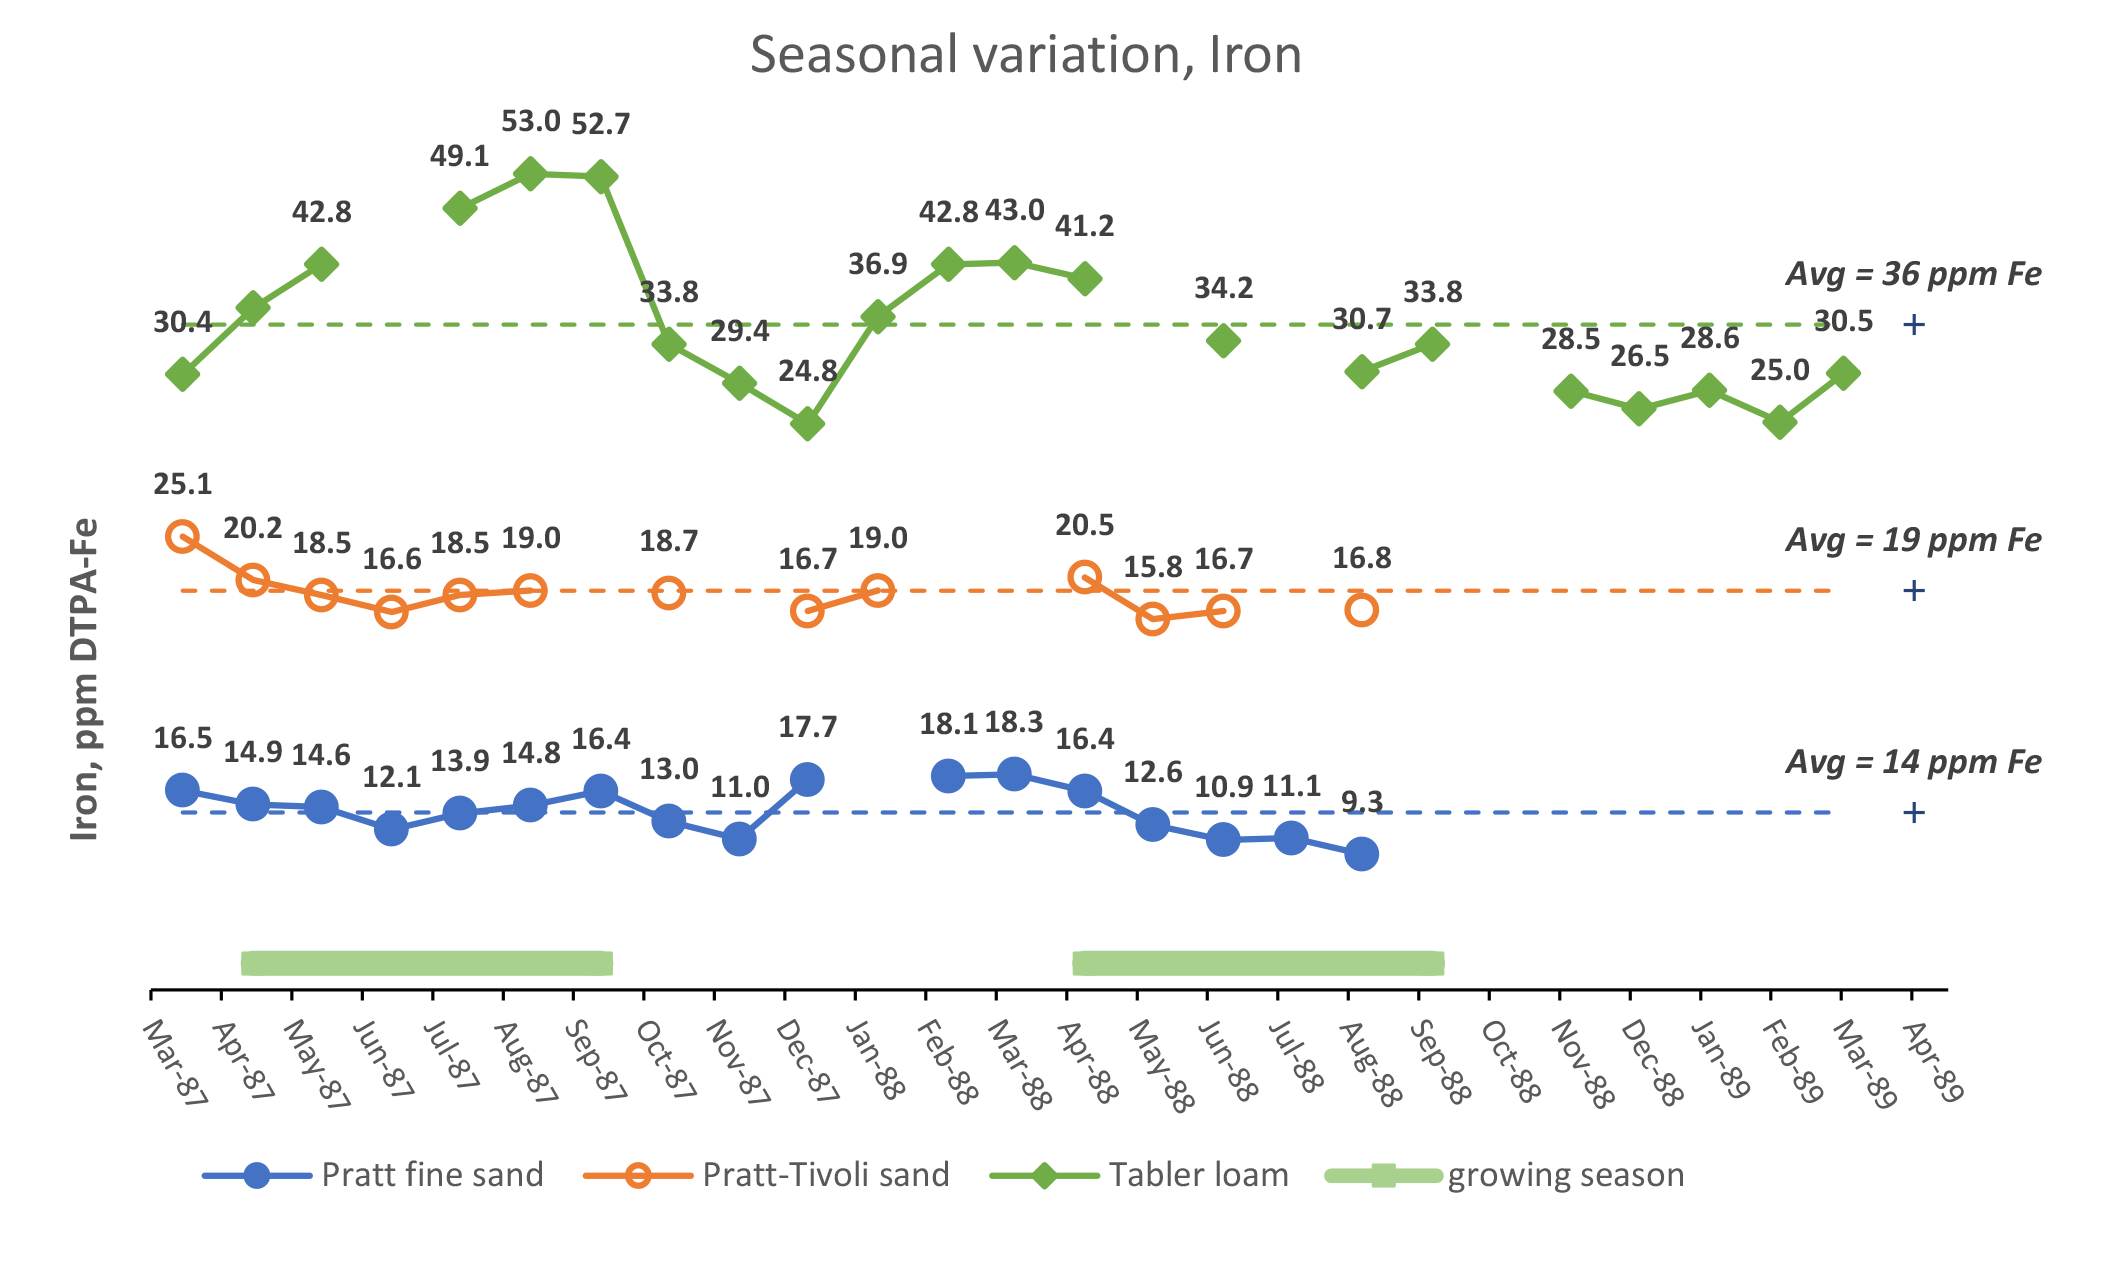
¶ Figure 9b. Seasonal Variation, Iron
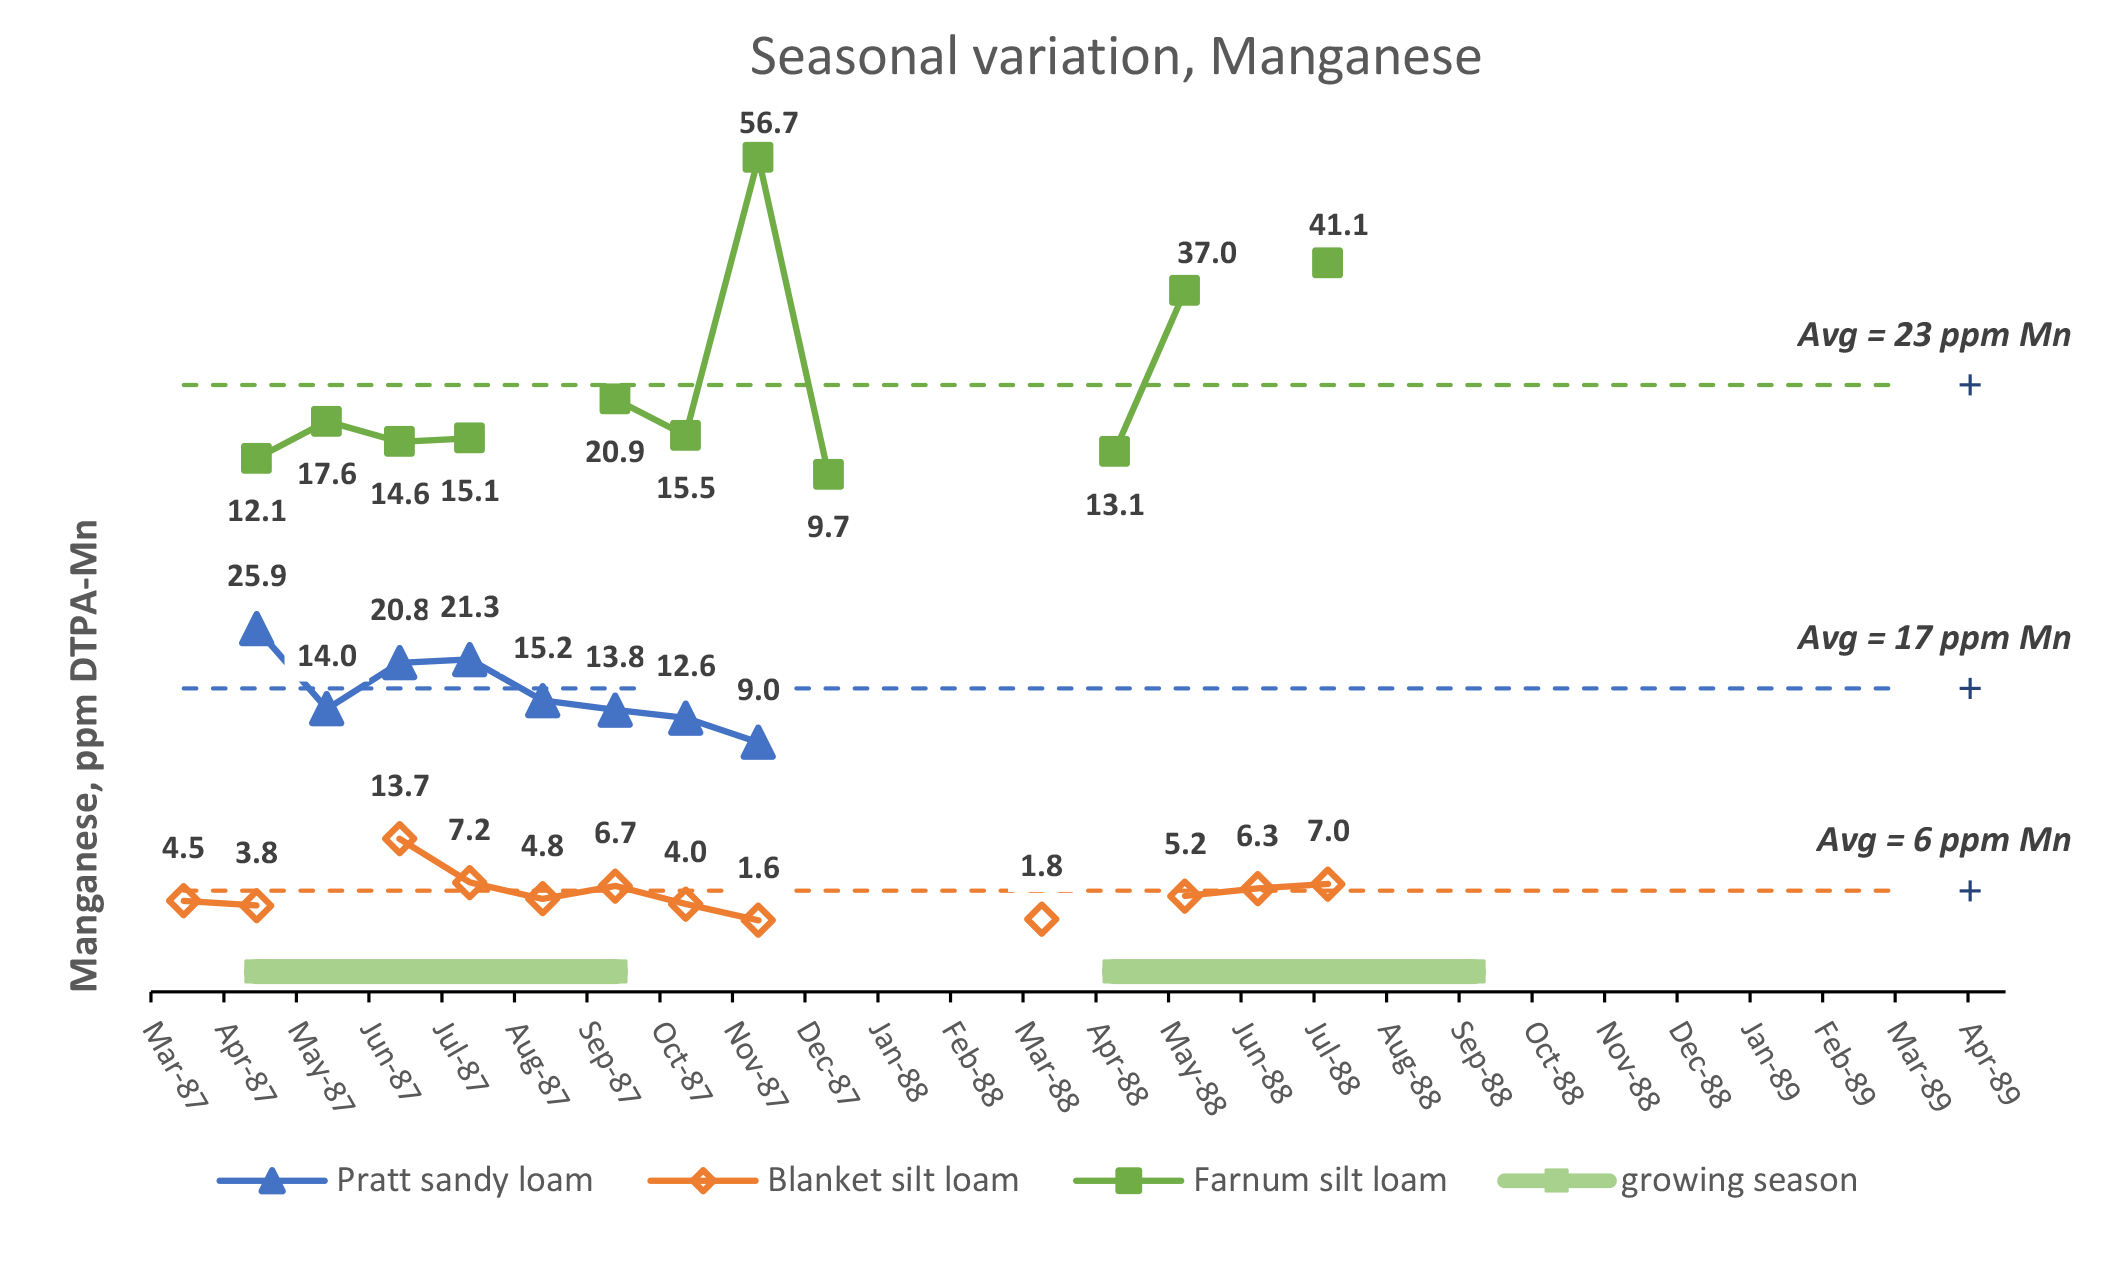
¶ Figure 10a. Seasonal Variation, Manganese
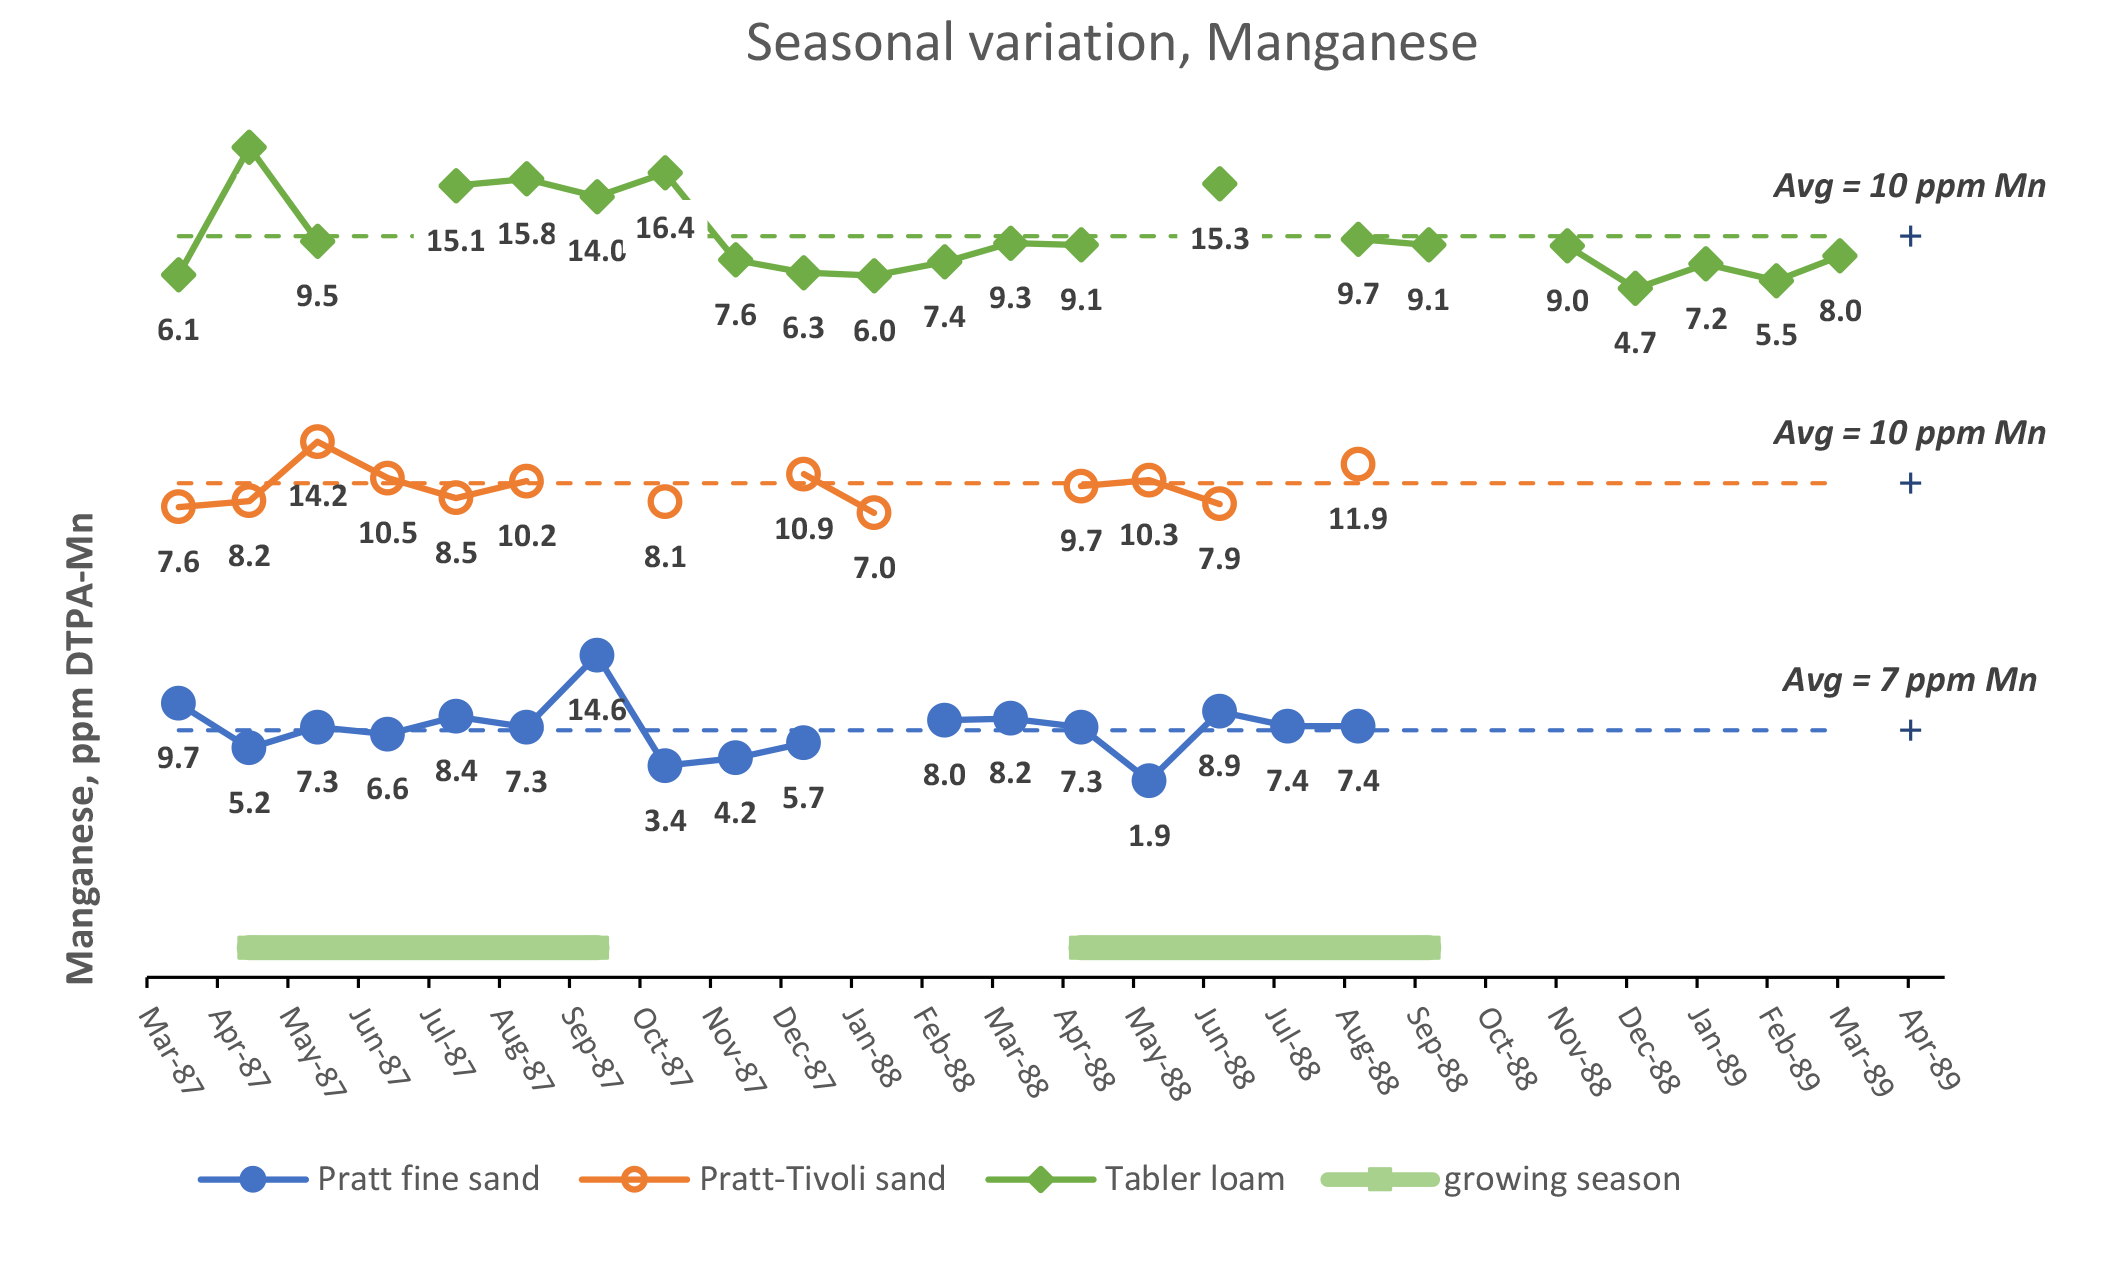
¶ Figure 10b. Seasonal Variation, Manganese
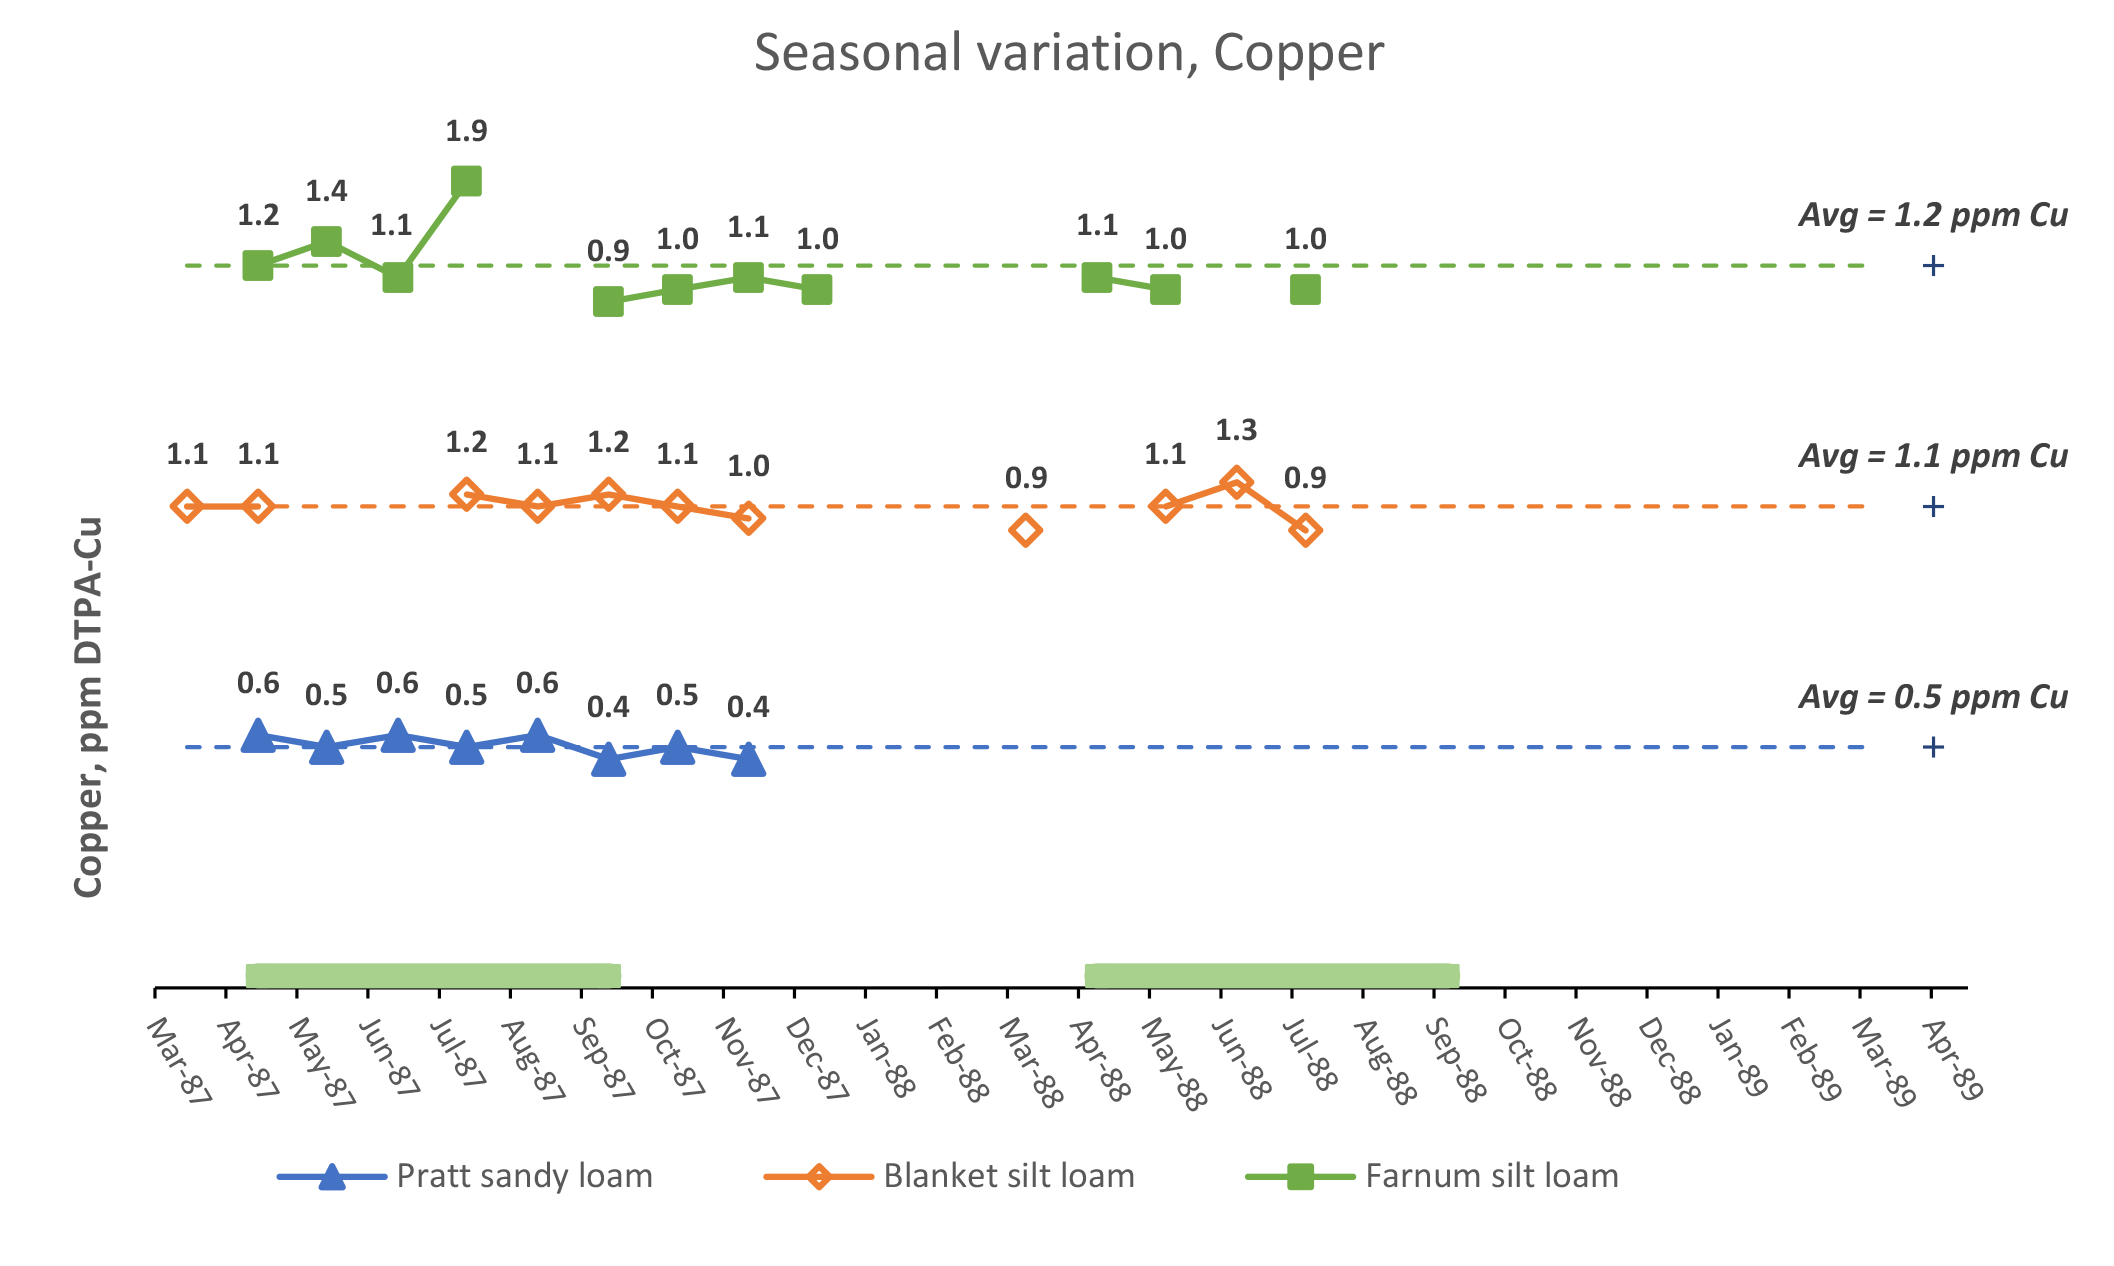
¶ Figure 11a. Seasonal Variation, Copper
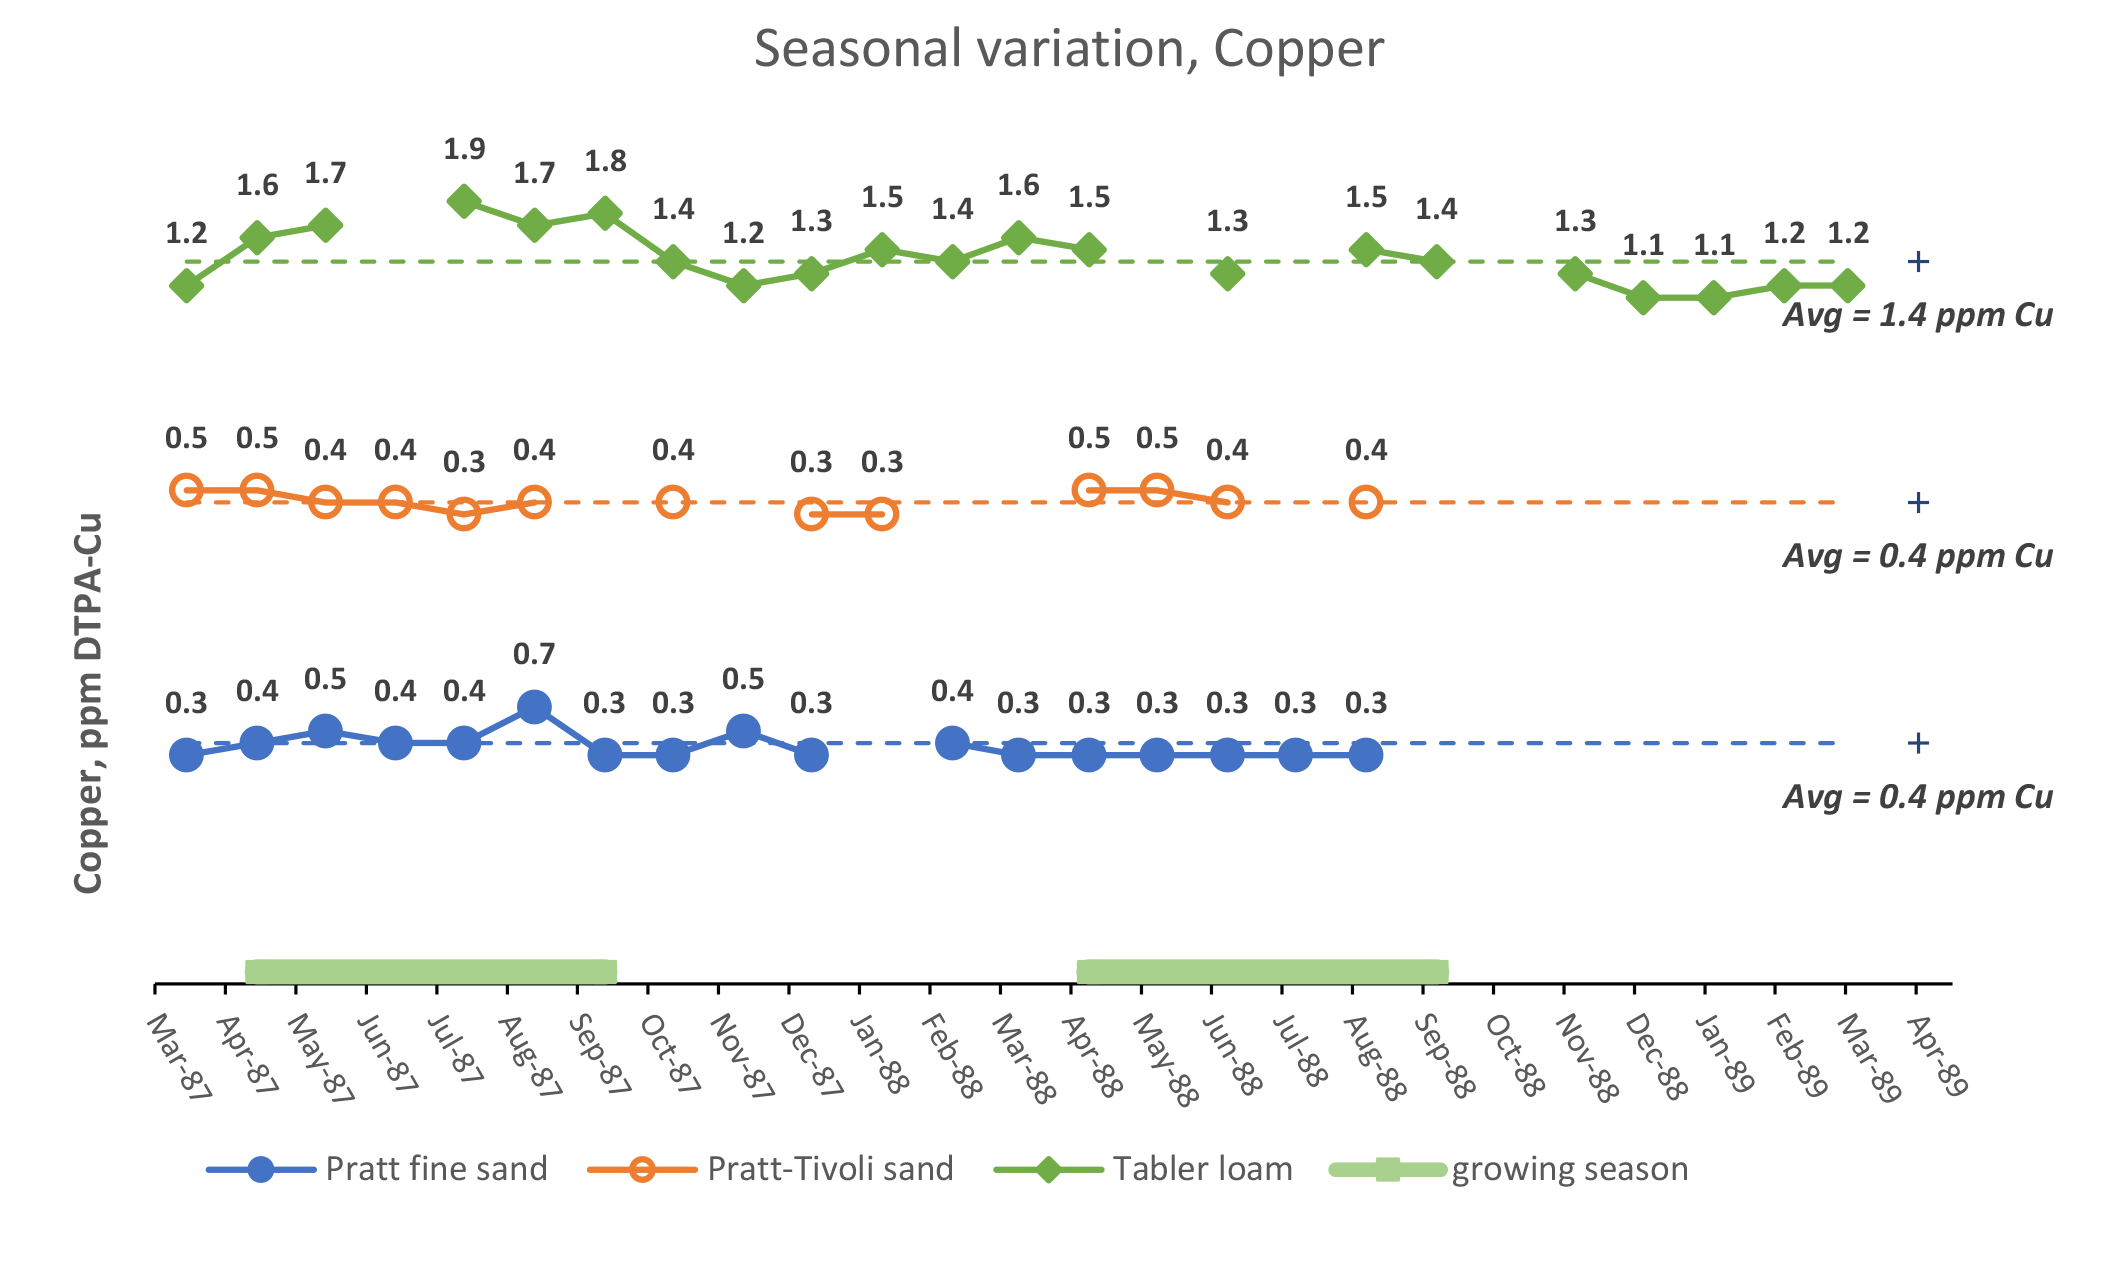
¶ Figure 11b. Seasonal Variation, Copper
¶ Figure 12a. Monthly Weather, Pratt Kansas - Graph
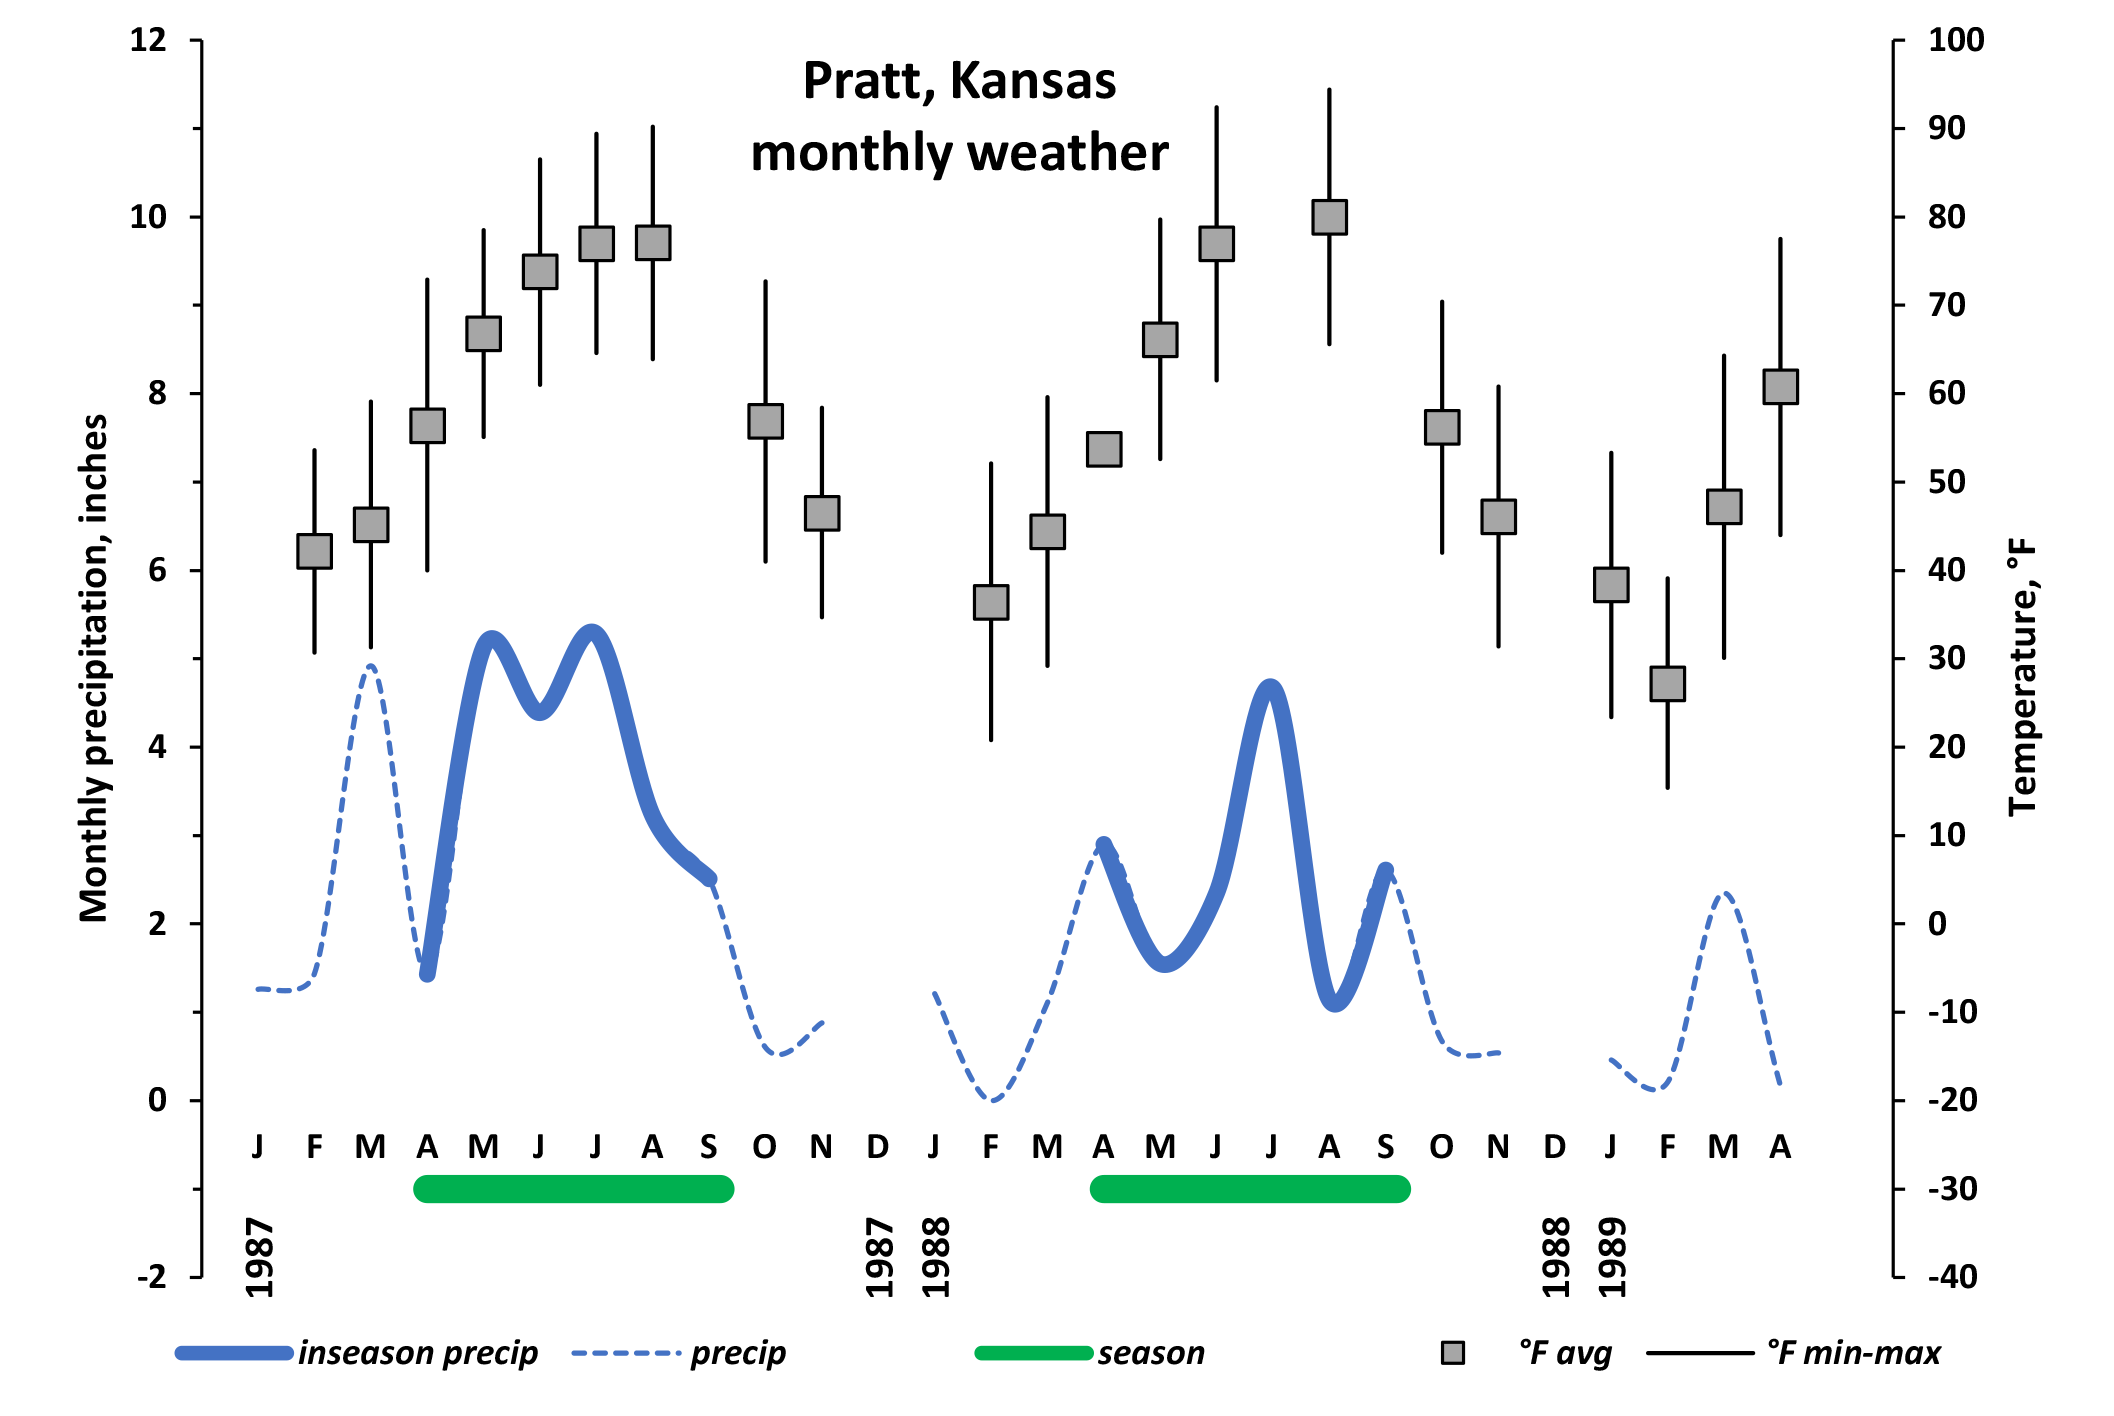
¶ Figure 12b. Monthly Weather, Pratt Kansas - Table