⇦ Back to Soil Fertility and Plant Nutrition Home
¶ Introduction
Fertilizer recommendations have traditionally assumed that phosphate fertilizer (P2O5) will be broadcast and incorporated. Many producers band all or part of the phosphate, which presents challenges when soil sampling these fields.
Phosphate is often banded below the tillage zone. Phosphate bands normally remain intact for some time after application. Repeated band applications result in accumulations of residual phosphorus or "hot zones" in the soil, especially under reduced tillage.
¶ Problems When Sampling Bands
The cross section of a ridge shown in Figure 1 illustrates how phosphate banded with the seed formed a residual “hot zone" under a reduced tillage system. The detailed grid samples reveal soil test levels ranging from less than 10 ppm P in zones under the furrows (which received no phosphate fertilizer) to 90 ppm P in the old band location around the seed slice.
¶ Figure 1. Cross Section of Ridge
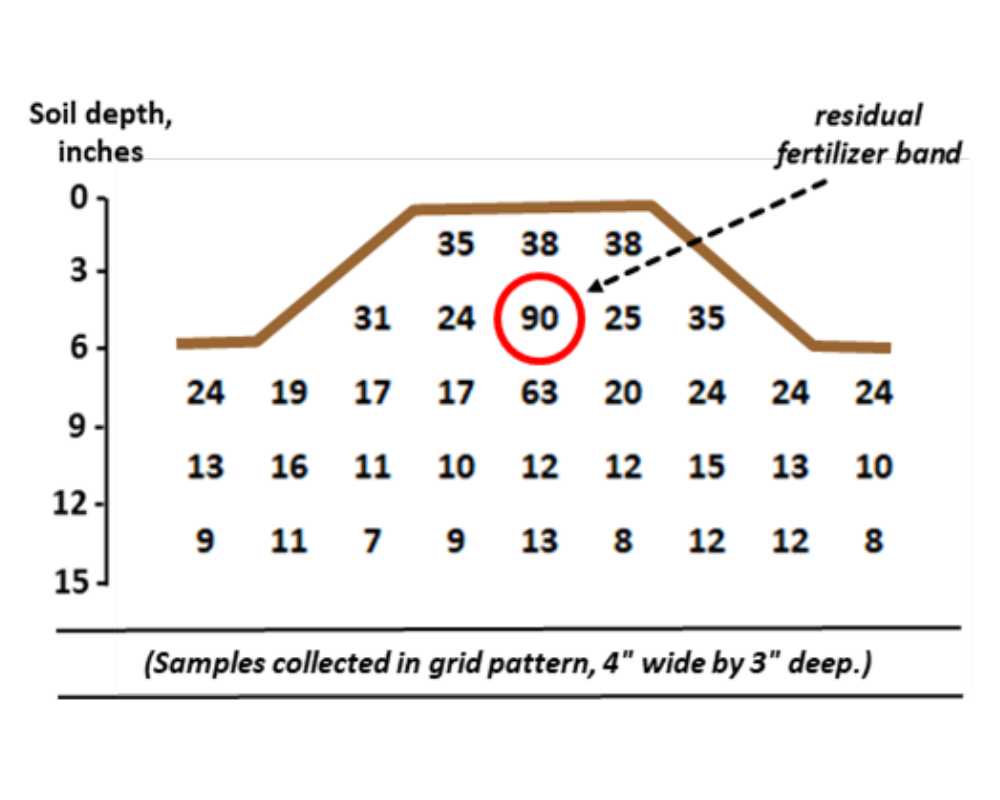
Soil test results using conventional random sampling techniques could differ widely, depending on exactly how soil samples were collected. Eight-inch soil cores taken from the ridge top would likely include the "hot zone" around the old band. Soil cores taken from the ridge side or the furrow bottom would not include residual phosphate from the old fertilizer band.
If too many of the "in-the-band" cores were included in the final composite sample, the soil test phosphorus result would be high. leading to an artificially low phosphate recommendation.
If too few "in-the-band" cores were included, the phosphate recommendation would be higher, but might exceed the actual crop requirement.
Sampling technique would be less of a problem in convention~~age. ~ phosphorus would be distributed more evenly than under reduced tillage, so there would not be "hot zones" to bias the soil test results. random soil sampling techniques would provide an average or "true" soil test level.
Special sampling techniques can reduce variability when phosphate has been banded. These techniques can help determine the "true" soil phosphorus level to provide information for accurate fertilizer recommendations.
A multi-state study provides guidelines for sampling in these situations. This study was carried out on three Great Plains soil types: Keith clay loam, Woodsen silt loam. and Harney silt loam.
¶ Unknown Band Location
The location of the old band is not always obvious, especially if the field has been tilled. A modified random sampling technique can be used if the band spacing and the band application direction is known.
This technique requires that two cores be collected for each subsample and the subsamples be composited to make one soil sample.
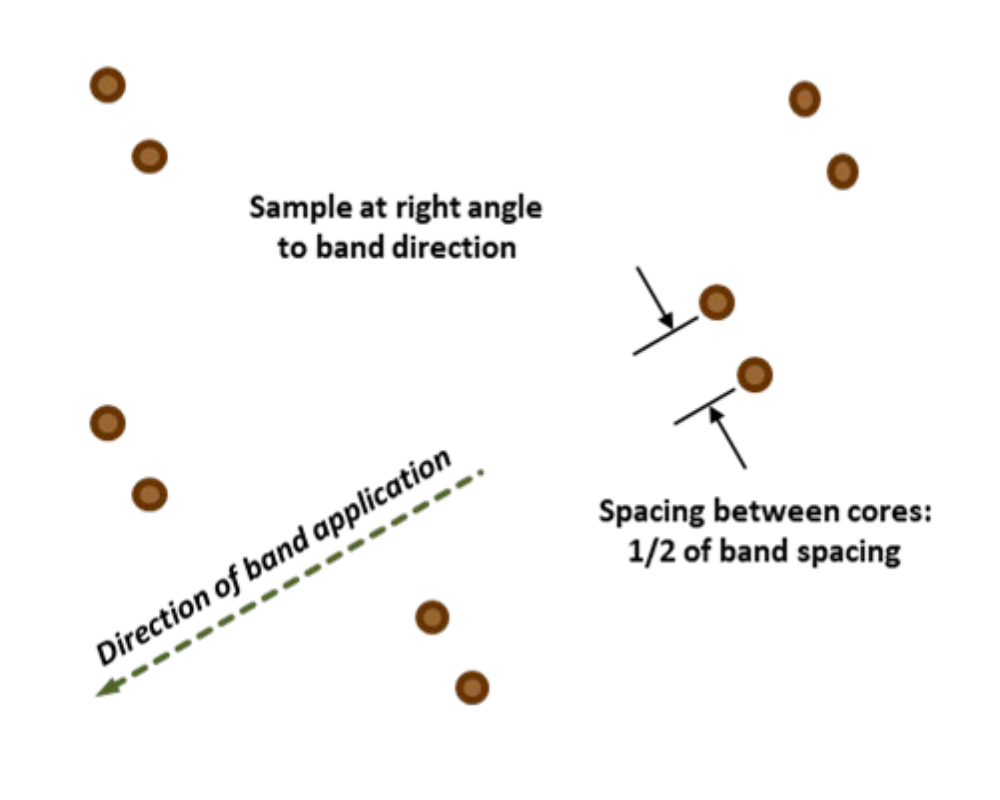
The first core is collected completely at random. The second core is then collected at one-half the fertilizer band spacing away from the first core and at right angles to the band direction. The set of two paired cores makes up one subsample.
One soil sample should consist of 10 to 25 sets of paired cores, otherwise soil test results will not represent the field. Most situations will require about 12 to 15 sets of paired cores for acceptable accuracy.
More than 20 sets of paired cores may be required if one or all of these conditions exist in the field:
- wide band spacings,
- heavy phosphate applications, and/or
- soils with low phosphorus fixing capacity
Figure 2 illustrates this sampling technique. For example, If the band spacing was 15 inches. the paired cores should be taken 7.5 inches apart at right angles to the application direction.
¶ Figure 2. “Paired Core” Sampling Method
¶ Known Band Locations
Producers using no-till, strip-till, or ridge till systems may plant the seed rows and apply fertilizer bands in the same location every year. The position of the old crop row is obvious, so the location of the old phosphorus band can be readily located. A "directed" sampling technique rather than random sampling, is appropriate in these situations.
Cores collected from the "in-the-band" zone can be mixed with cores from the "between-the-band" zone to make up a composite field sample. If the ratio of cores from these two zones is correct, the composite sample will represent the "true" soil test P level more accurately. Table 1 lists the number of "between-the-band" cores to be included with each "in-the-band" core.
¶ Table 1. Ratio of Cores When Phosphorus Band Direction and Spacing is Known |
|
| Band Spacing, inches |
No of “between-band" cores for each ”in-band" core |
| 6 | 4 |
| 10 | 7 |
| 15 | 10 |
| 18 | 12 |
| 22 | 15 |
| 30 | 20 |
| 36 | 24 |
| 40 | 27 |
For example. assume 30-inch spacings in the field represented by Figure 1. The composite sample from this field should consist of 21 cores. One core should be collected from directly over the center of the row to include the old phosphate band. The other twenty cores should be collected from the ridge sides and furrow bottoms
A minimum of 12 to 15 cores is required for a representative sample.
A soil test history is a critical element for either system. Tracking the long-term trends in soil test results can identify changes that may require shifts in crop management or fertilizer management.
¶ References
Kitchen, N.R . J.L. Havlin, and D.G. Westfall. 1990 Soil sampling under no-till banded phosphorus. Soil Sci. Soc. Journ. 54:1661- 1665. Weise, R. Personal comunication. Univ. of Nebraska, Lincoln, Nebr.