⇦ Back to Soil Fertility and Plant Nutrition Home
¶ Introduction
Testing for soil nitrate is most useful before the crop is planted to plan fertilizer management strategy. If heavy rains follow a nitrogen application, it becomes important to know just how much nitrogen is still in the crop root zone and potentially available for uptake. Nitrogen loss from leaching and/or denitrification can hurt yields. The question in the producer’s mind is, "Do I have enough nitrogen or do I need to put on more?”
Collecting post-application soil samples can be helpful, but difficult. It is easy to expect that the applied nitrogen rate should balance exactly with the soil test nitrate. That is seldom the case. It is more of a general estimate rather than a precise number. Understanding potential variability and increased sampling intensity helps improve the soil test’s value when making management decisions.
¶ “Positional” Variability
Field characteristics will affect the amount of ponding, surface infiltration, or moisture storage. Zone sampling will yield more information than whole field sampling. More zones and smaller zones may be better.
Broadcasting dry or liquid fertilizer is assumed to uniformly apply nitrogen. Each dry fertilizer prill will create a minute “hot zone” around it, with no nitrogen between prills. An individual soil core may or may not hold soil that is fertilized with a “hot zone”. The number of cores per composite sample needs to be high enough to prevent biasing the final sample.
When fertilizer nitrogen is banded, it moves radially away from the point of injection or streaming. Nitrogen applied with a knife or shank tends to form a pear-shaped retention zone. The anhydrous ammonia retention zone diameter is about 3 to 4 inches under most conditions, but may be as much as 5 to 7 inches in very sandy or very dry soils. The retention zone diameter for banded granular urea or nitrogen solution is likely to be smaller.The zone diameter is affected primarily by nitrogen rate, band spacing, soil texture, and soil moisture.
The challenge is to collect a reasonable mix of cores from fertilized and unfertilized soil. Chances are that only one in every four to eight randomly collected probes will actually contain soil from the retention zone. The location of fertilizer bands may not be obvious at the soil surface. Sampling is further complicated because the nitrogen concentration is highest right at the injection point and decreases progressively as we move away from this point.
¶ “Chemical” Variability
The form of nitrogen applied as fertilizer is not necessarily in the forms present in the soil sample. Anhydrous ammonia and urea convert to ammonium. Ammonium converts to nitrate. Some portion of the applied nitrogen has probably been metabolized by the soil microbes and present as cellular protein. A portion might have already been taken up by the emerged plants and present as root or shoot tissue protein.
Soil tests should Include both nitrate-nitrogen (NO3-N) and ammonium-nitrogen (NH4-N) to help account for both residual soil nitrogen and applied fertilizer applied. For example, if 100 lb N/ac of nitrogen were applied, then sampled two or three weeks later, only 40 to 50 lb N/ac might be present as nitrate. The remainder could be in urea or ammonium form.
The soil ammonium test will help identify some of the remaining nitrogen. Soil testing cannot identify the amount of nitrogen in microbial biomass or root tissue. This is a “black hole” that can make balancing nitrogen difficult.
Following are five different field situations and suggested sampling procedures to obtain representative soil samples and improve the nitrogen estimate.
¶ Table 1. Suggested Sampling Patterns for In-Season Soil Sampling |
||||
|---|---|---|---|---|
| Field Situation | Number of Cores | Sample Depth | Location | Test |
| Unplanted: no nitrogen applied | 10 to 15 | 0 to 8 in. | Random | NO3-N |
| Unplanted: nitrogen applied | 20 to 25 | 0 to 12 in. | Random | NO3-N & NH4-N |
| Planted: no nitrogen applied | 10 to 15 | 0 to 8 in. | 4 to 6 inches from row | NO3-N |
| Planted: nitrogen applied before planting, no visible bands or knife marks |
5 cores at 12 to 12 spots (40 to 60 cores total) |
0 to 12 in. | Pattern A | NO3-N & NH4-N |
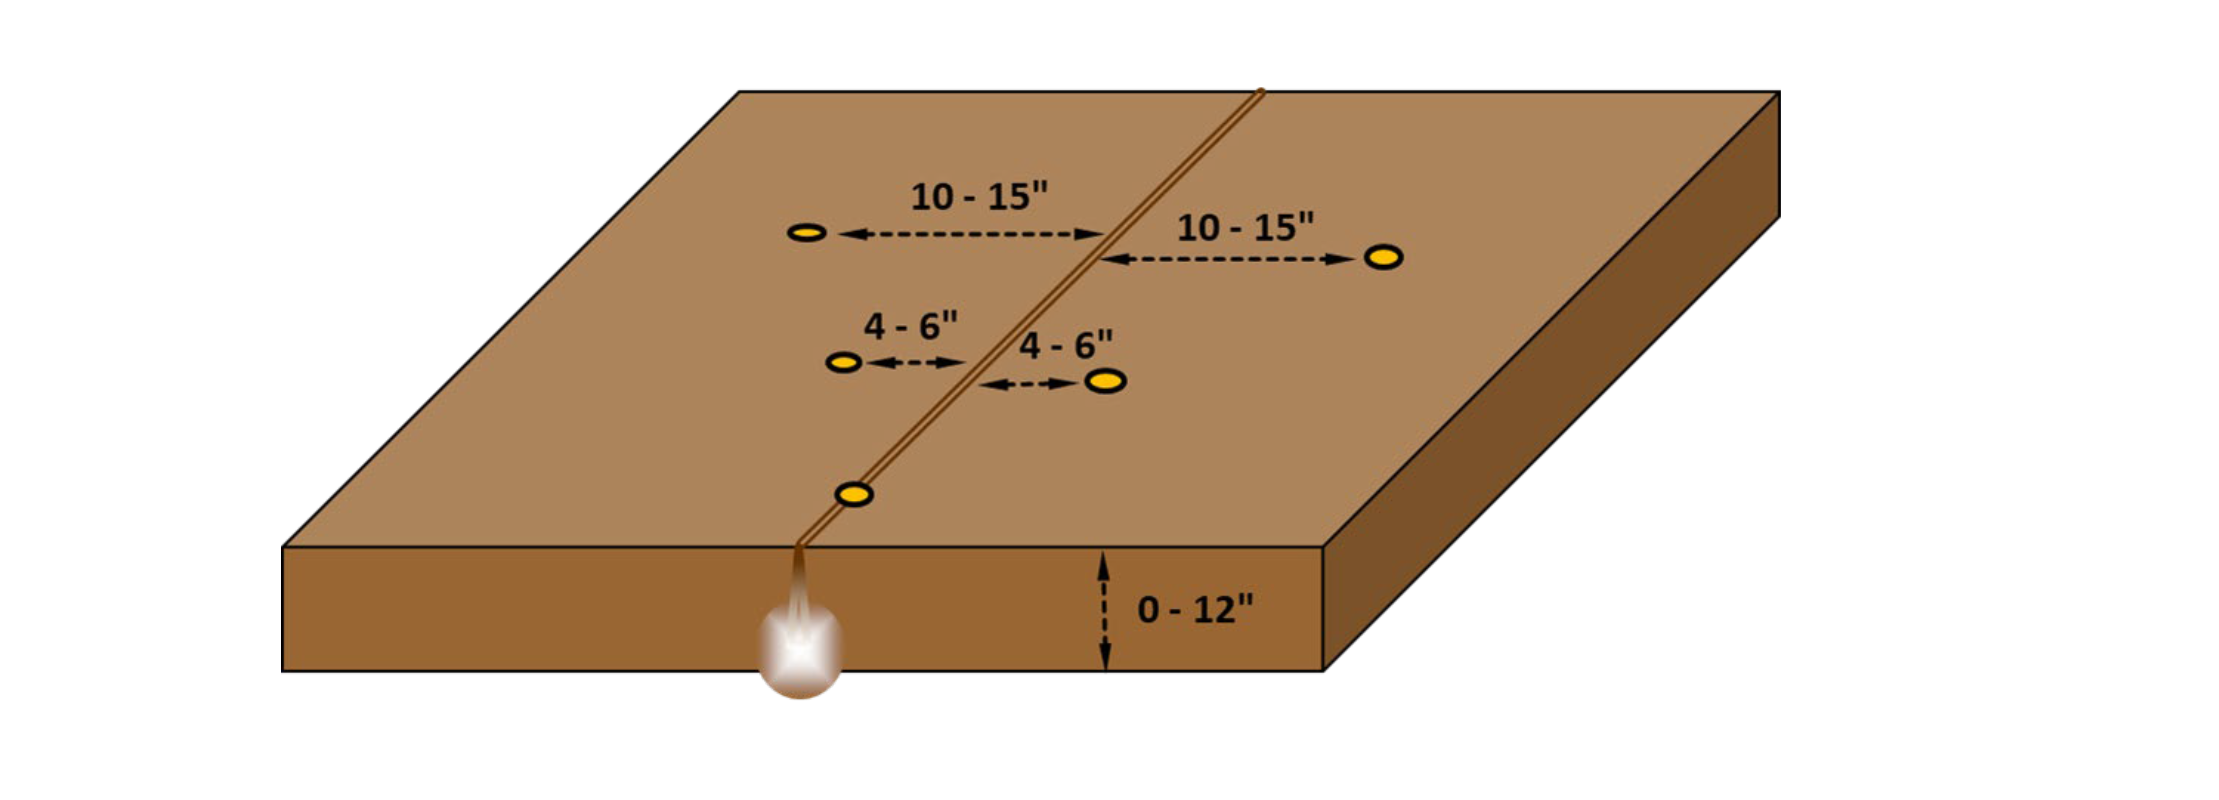
| Planted: nitrogen applied before planting, visible bands or knife marks |
5 cores at 12 to 12 spots (40 to 60 cores total) |
0 to 12 in. | Pattern B | NO3-N & NH4-N |
¶ Figure 1. Sampling Pattern "A": No Visible Application Mark
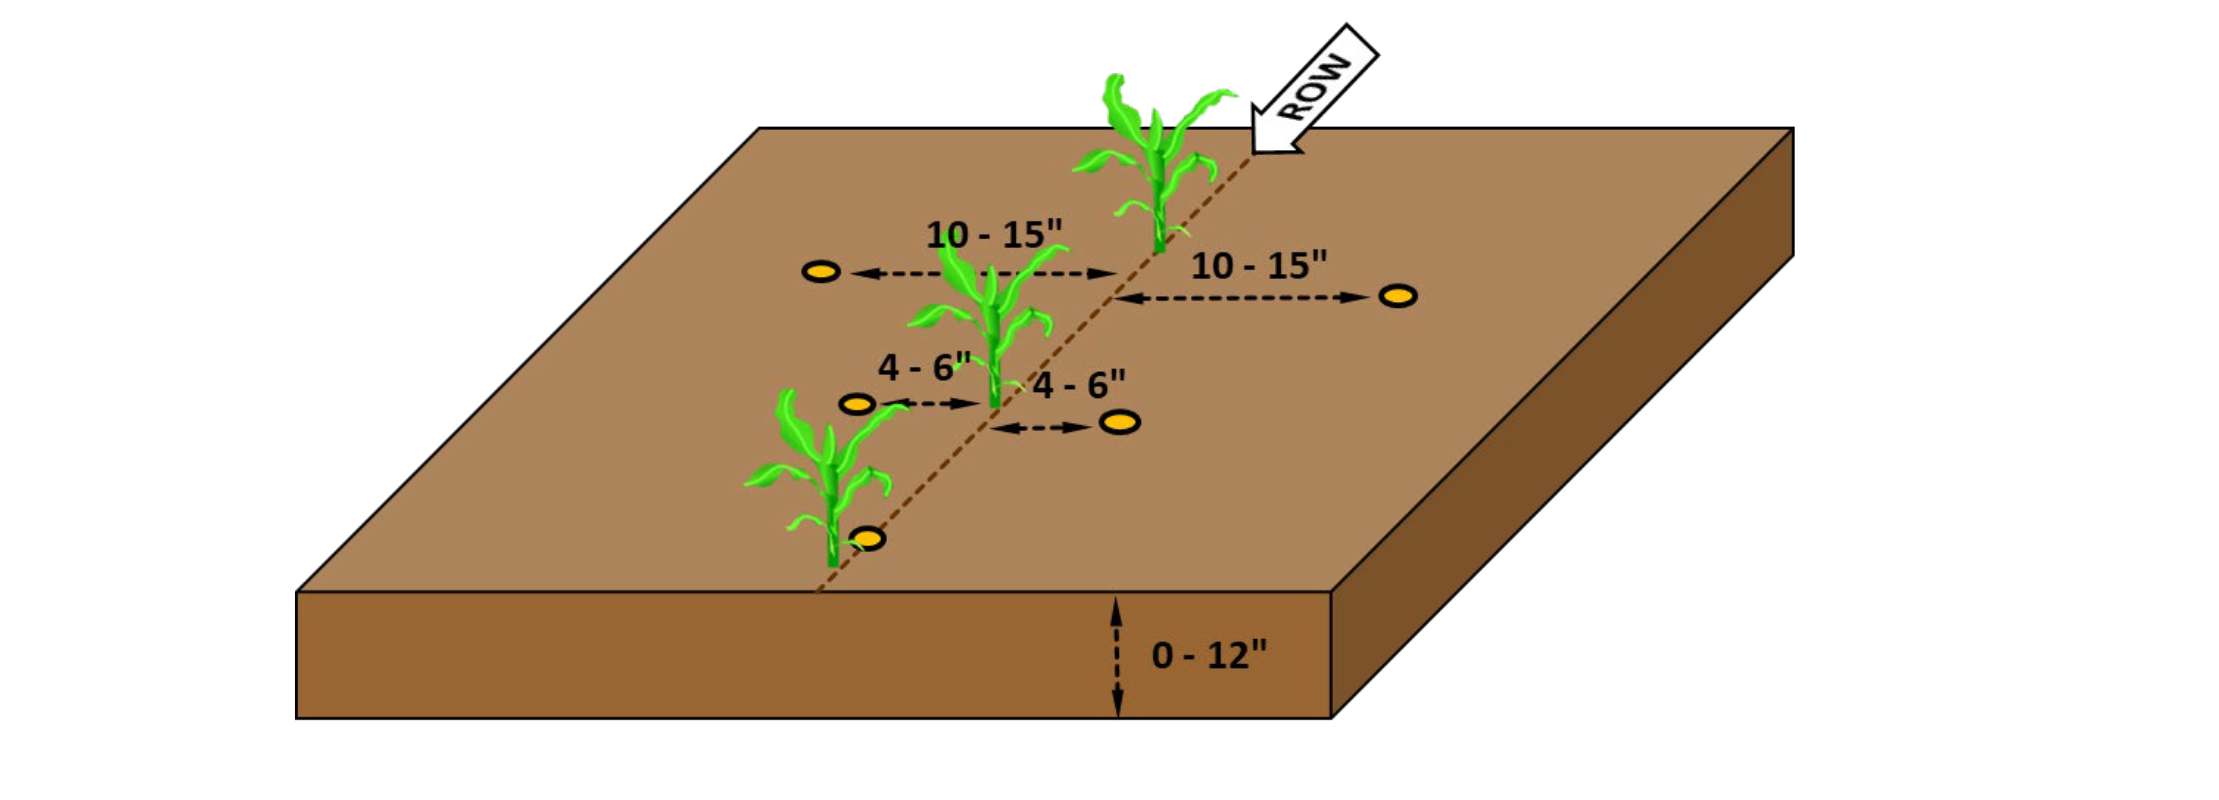
¶ Figure 2. Sampling Pattern "B": Visible Application Mark